The operational analysis feature provides statistics on data such as traffic, bandwidth, number of unique visitors, and user distribution. This topic describes how to view the relevant metrics.
- Log on to the ApsaraVideo Live console.
In the left-side navigation pane, choose . The Operational Analysis page appears.
View the statistics details.
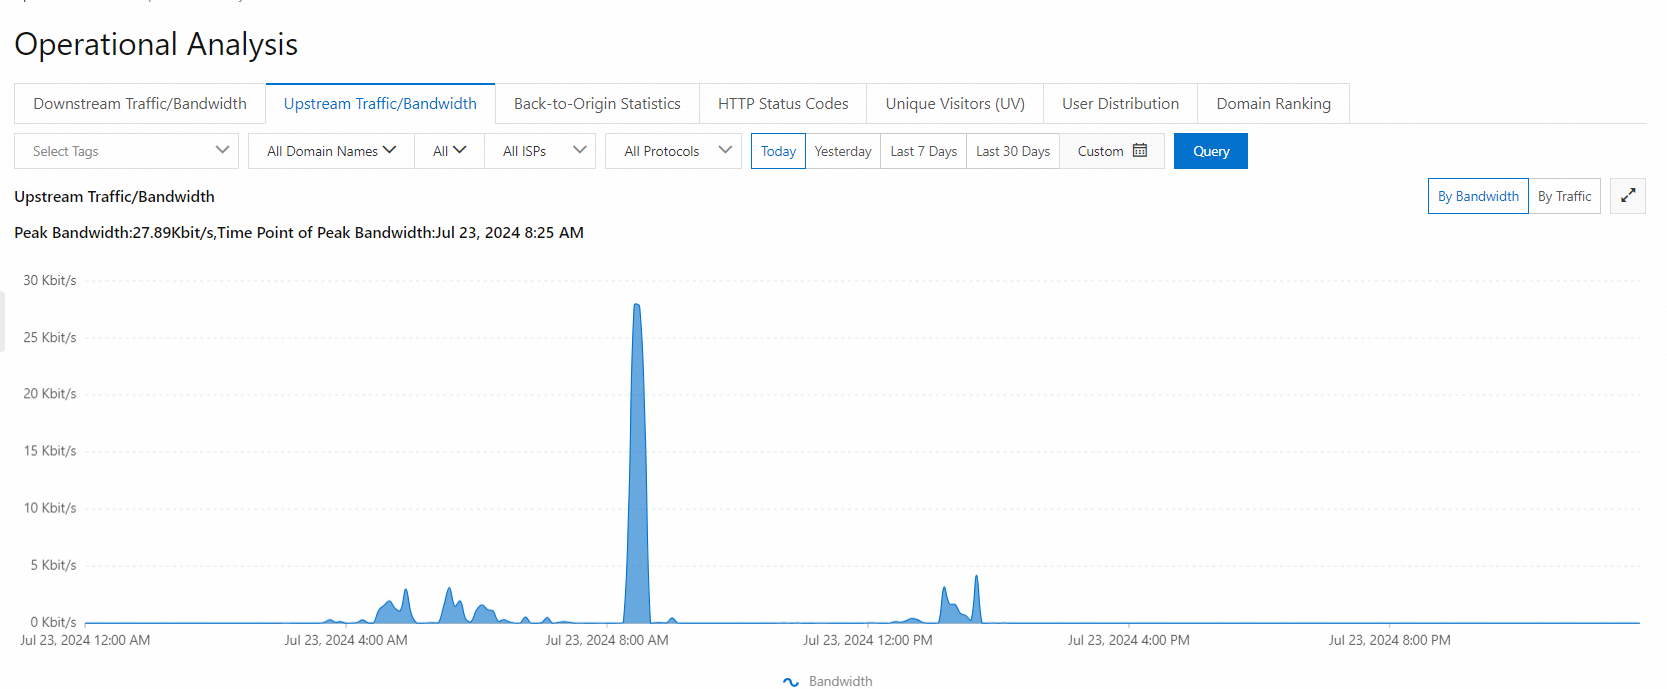
You can specify a domain name and a time range to view the following statistical items and their metrics. The optional time ranges include today, yesterday, last 7 days, last 30 days, and a custom time range.
Item | Metric |
Downstream Traffic/Bandwidth | Upstream bandwidth and traffic |
Upstream Traffic/Bandwidth | Downstream bandwidth and traffic |
Back-to-Origin Statistics | Back-to-origin bandwidth and traffic |
HTTP Status Codes | 5xx status codes, 4xx status codes, 3xx status codes, and 2xx status codes |
Unique Visitors (UV) | Number of unique visitors |
User Distribution | Region, total traffic, traffic (%), visits (%), and response time |
Domain Ranking | Visit rankings of accelerated domain names |