In PolarDB-X 1.0, SQL statements that are executed for more than 1 second are defined as slow SQL queries. Slow SQL queries consist of logical and physical slow SQL queries. This topic describes the definitions and query methods of the two types of slow SQL queries.
Definitions of slow SQL queries
- Logical slow SQL queries: slow SQL queries that are sent from a client to PolarDB-X 1.0. The slow queries queried in the PolarDB-X 1.0 console are all logical slow SQL queries.
- Physical slow SQL queries: slow SQL queries that are sent from PolarDB-X 1.0 to the storage layer MySQL. All the slow SQL queries queried at the storage layer MySQL are physical slow SQL statements.
Precautions
Each PolarDB-X 1.0 node stores the details about a maximum of 5,000 slow SQL queries. The details about extra slow SQL queries are deleted in a rolling way.
Procedure
- Log on to the PolarDB for Xscale console.
- In the top navigation bar, select the region where the target instance is located.
- In the left-side navigation pane, click Instances.
- Find the target instance and click the instance ID to go to the Basic Information page.
- In the left-side navigation pane, click Slow SQL Queries.
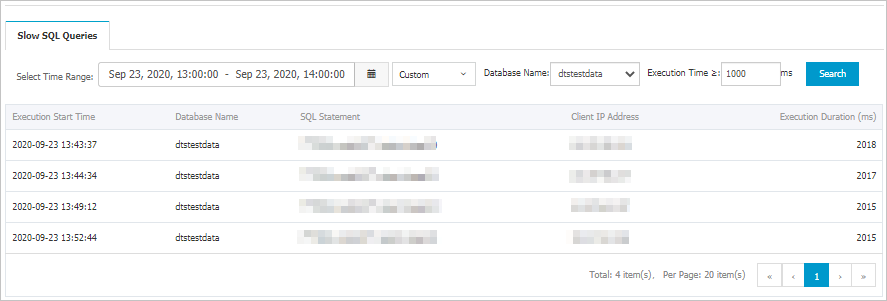
- Specify Select Time Range, Database Name, and Execution Time, and then click Search to view the information about slow SQL queries.
- You can also view the information about the corresponding physical slow SQL queries at the storage layer MySQL by performing the following steps:Note Only physical slow SQL queries in PolarDB for MySQL that serves as the storage layer can be queried.
- Click Slow Log Details and select the required database and the primary node to view details about slow query logs
 Note For more information about slow SQL analysis and diagnostics features, see Slow SQL query.
- Click Slow Log Details and select the required database and the primary node to view details about slow query logs