Alibaba Cloud Managed Service for Prometheusを使用すると、NGINXエクスポーターをインストールおよび構成できます。Managed Service for Prometheusは、アプリケーションの監視に使用できるすぐに使えるダッシュボードも提供します。このトピックでは、新しいバージョンのNGINXエクスポーターをインストールおよび構成する方法について説明します。
前提条件
NGINXサービスがインストールされ、想定どおりに実行されていること。
背景情報
NGINXステータス監視モジュール(ngx_http_stub_status_module)は、NGINXサービスによって受信および処理されるリクエストの数に関する統計を収集します。
ngx_http_stub_status_moduleは、新しいバージョンのNGINXエクスポーター用にインストールされています。
次の表に、新しいバージョンのNGINXエクスポーターのメトリックを示します。
メトリック
説明
nginx_connections_accepted
受け入れられたクライアント接続の数。
nginx_connections_active
アクティブなクライアント接続の数。
nginx_connections_handled
処理されたクライアント接続の数。
nginx_connections_reading
読み取りに使用されるクライアント接続の数。
nginx_connections_waiting
待機中のクライアント接続の数。
nginx_connections_writing
書き戻しに使用されるクライアント接続の数。
nginx_http_requests_total
クライアントリクエストの総数。
nginx_up
NGINXエクスポーターが正しく実行されているかどうかを示します。
nginxexporter_build_info
NGINXエクスポーターに関するビルド情報。
手順1: ngx_http_stub_status_moduleをインストールする
NGINXサービスがElastic Compute Service(ECS)インスタンスで実行されている場合は、次の手順を実行してNGINXエクスポーターをインストールします。
ngx_http_stub_status_moduleがインストールされているかどうかを確認します。
nginx -V 2>&1 | grep -o with-http_stub_status_module次の情報が表示された場合は、ngx_http_stub_status_moduleがインストールされています。
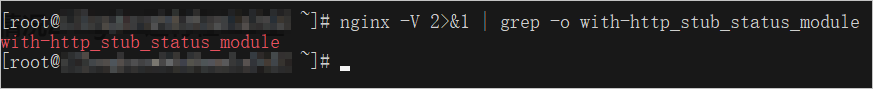
上記の情報が表示されない場合は、ngx_http_stub_status_moduleがインストールされていません。次のコマンドを実行してモジュールをインストールします。
wget http://nginx.org/download/nginx-1.13.12.tar.gz
tar xfz nginx-1.13.12.tar.gz
cd nginx-1.13.12/
./configure --with-http_stub_status_module
make
make install
ngx_http_stub_status_moduleを起動して、NGINXサービスのステータスをクエリします。
location /nginx_status { stub_status on; allow 127.0.0.1; // ローカルホストからのリクエストのみ許可 deny all; // 他のすべてのホストを拒否 }説明locationの値は
nginx_statusである必要があります。allow 127.0.0.1およびdeny allは、ローカルアクセスのみが許可されることを指定します。NGINXエクスポーターからのアクセスを許可するには、これらの2行のコードをコメントアウトするか、127.0.0.1をNGINXエクスポーターのIPアドレスに変更します。
NGINXを再起動します。
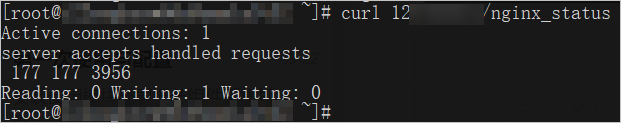
nginx -t nginx -s reloadオプション:ngx_http_stub_status_moduleモジュールが起動されているかどうかを確認します。
curl http://127.0.0.1/nginx_status次の出力は、ngx_http_stub_status_moduleモジュールが起動されていることを示します。
手順2: 新しいバージョンのNGINXエクスポーターをインストールして構成する
手順
手順1: Managed Service For Prometheusの統合センター
ARMSコンソールにログインします。
左側のナビゲーションペインで、を選択します。
管理するPrometheusインスタンスインスタンスの名前をクリックして、統合センターページに移動します。
手順2: ARMSコンソールの統合センター
ARMSコンソールにログインします。
左側のナビゲーションペインで、統合センターをクリックします。統合センターページで、Nginx(新規)アプリケーションコンポーネントセクションのをクリックします。表示されるNginx(new)の監視パネルで、画面の指示に従ってエクスポーターを追加します。
新しいバージョンのNGINXエクスポーターをインストールして構成する
このセクションでは、Managed Service for Prometheusの統合センターページで新しいバージョンのNGINXエクスポーターをインストールおよび構成する方法について説明します。
新しいバージョンのNGINXエクスポーターをインストールします。
新しいバージョンのNGINXエクスポーターを初めてインストールする場合は、次の操作を実行します。
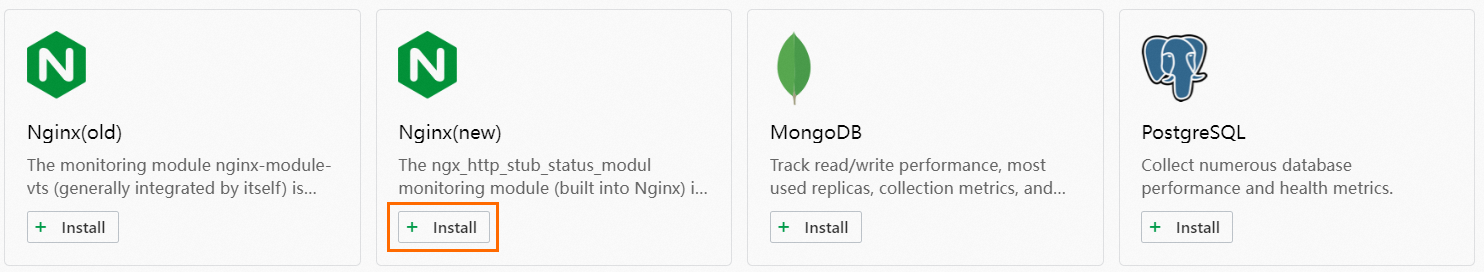
統合センターページの未インストールセクションで、Nginx(new)エクスポーターを見つけ、インストールをクリックします。
新しいバージョンのNGINXエクスポーターを既にインストールしている場合は、エクスポーターを再度追加する必要があります。
統合センターページのインストール済みセクションで、Nginx(new)エクスポーターの追加をクリックします。
構成タブの手順 2 セクションで、パラメーターを構成し、OK をクリックします。次の表にパラメーターの説明を示します。
パラメーター
説明
エクスポーター名
新しいバージョンのNGINXエクスポーターの名前。名前は次の要件を満たしている必要があります。
名前には、小文字、数字、ハイフン(-)のみを含めることができ、ハイフン(-)で開始または終了することはできません。
名前は一意である必要があります。
説明このパラメーターを指定しない場合、システムはデフォルト名を使用します。デフォルト名は、エクスポータータイプと数値サフィックスで構成されます。
Nginx(new)アドレス
NGINXサービスにアクセスするために使用されるURL。
Nginx(new)ポート
NGINXサービスのポート番号。例:80。
説明手順2セクションのメトリックタブで監視メトリックを表示できます。
インストールされたコンポーネントは、統合管理ARMSコンソールの統合管理ページに表示されます。統合管理ページは、統合環境、統合アドオン、クエリダッシュボードタブで構成され、ターゲット、メトリック、ダッシュボード、アラートなどの情報を表示できます。