x13_arima is an algorithm used for time series analysis, specifically designed for seasonal data adjustment. It is based on the open-source package X-13ARIMA-SEATS, combining ARIMA modeling with seasonal adjustment techniques to enhance the accuracy of predictions and the effectiveness of data analysis.
Background information
ARIMA was proposed in the Box-Jenkins method by Box and Jenkins in the early 1970s for time series forecasting. ARIMA models are also known as Box-Jenkins models.
Algorithm description:
Supported scale
Row: a maximum of 1,200 data records in a group
Column: one numeric column
Resource calculation method
Default calculation method if the groupColNames parameter is not specified:
coreNum=1
memSizePerCore=4096
Default calculation method if the groupColNames parameter is specified:
coreNum = floor(Total number of rows/120,000)
memSizePerCore=4096
Configure the component
You can use one of the following methods to configure the x13_arima component:
Method 1: Configure the component in the PAI console
You can configure the parameters of the x13_arima component on the pipeline page of Machine Learning Designer. The following table describes the parameters.
Tab | Parameter | Description |
Fields Setting | Time Series Column | Required. This parameter is used only to sort values in the numeric column. |
Value Column | Required. | |
Stratification Column | Optional. You can separate multiple columns with commas (,), such as col0,col1. A time series is created for each group. | |
Parameters Setting | Format | The supported format is p,d,q. p, d, and q are non-negative integers in the range of [0,36].
|
Start Date | The supported format is year.seasonal. Example: 1986.1. | |
Series Frequency | The value must be a positive integer in the range of [1,12]. | |
Format | The supported format is sp,sd,sq. sp, sd, and sq are non-negative integers in the range of [0,36].
| |
Seasonal Cycle | The value must be a number in the range of (0,12]. Default value: 12. | |
Prediction Entries | The value must be a positive integer in the range of (0,120]. Default value: 12. | |
Prediction Confidence Level | The value must be a number in the range of (0,1). Default value: 0.95. | |
Tuning | Cores | The number of cores. By default, the system determines the value. |
Memory | The memory size per core. Unit: MB. |
Method 2: Configure the component by using PAI commands
You can use SQL scripts to call PAI commands. For more information, see SQL Script.
PAI -name x13_arima
    -project algo_public
    -DinputTableName=pai_ft_x13_arima_input
    -DseqColName=id
    -DvalueColName=number
    -Dorder=3,1,1
    -Dstart=1949.1
    -Dfrequency=12
    -Dseasonal=0,1,1
    -Dperiod=12
    -DpredictStep=12
    -DoutputPredictTableName=pai_ft_x13_arima_out_predict
    -DoutputDetailTableName=pai_ft_x13_arima_out_detail
Parameter | Required | Description | Default value |
inputTableName | Yes | The name of the input table. | N/A |
inputTablePartitions | No | The feature columns that are selected from the input table for training. | Full table |
seqColName | Yes | The time series column. This parameter is used only to sort values in the valueColName column. | N/A |
valueColName | Yes | The numeric column. | N/A |
groupColNames | No | The grouping columns. You can separate multiple columns with commas (,). Example: col0,col1. A time series is created for each group. | N/A |
order | Yes | p indicates the autoregressive coefficient. d indicates the difference. q indicates the moving regression coefficient. The value must be a non-negative integer in the range of [0,36]. | N/A |
start | No | The start date of a time series. The value must be a string in the year.seasonal format, such as 1986.1. For more information, see Time series format. | 1.1 |
frequency | No | The time series frequency. The value must be a positive integer in the range of (0,12]. For more information, see Time series format. | 12 Note A value of 12 indicates 12 months per year. |
seasonal | No | sp indicates the seasonal autoregressive coefficient. sd indicates the seasonal difference. sq indicates the seasonal moving regression coefficient. The value must be a non-negative integer in the range of [0,36]. | Non-seasonal |
period | No | The seasonal cycle. The value must be a number in the range of (0,100]. | frequency |
maxiter | No | The maximum number of iterations. The value must be a positive integer. | 1500 |
tol | No | The tolerance. The value is of the DOUBLE type. | 1e-5 |
predictStep | No | The number of prediction entries. The value must be a positive integer in the range of (0,365]. | 12 |
confidenceLevel | No | The confidence level. The value must be a number in the range of (0,1). | 0.95 |
outputPredictTableName | Yes | The prediction output table. | N/A |
outputDetailTableName | Yes | The details table. | N/A |
outputTablePartition | No | Specifies whether to export data to partitions. | Does not export data to partitions |
coreNum | No | The number of cores. The value must be a positive integer. This parameter is used together with memSizePerCore. | Determined by the system |
memSizePerCore | No | The memory size of each core. Unit: MB. The value must be a positive integer in the range of [1024,64 × 1024]. | Determined by the system |
lifecycle | No | The lifecycle of the output table. | N/A |
Time series format
The start and frequency parameters specify the time dimensions ts1 and ts2 for the numeric column.
The frequency parameter specifies the data frequency within a unit period, which means the frequency of ts2 in each ts1.
The value of the start parameter is in the n1.n2 format. This indicates that the start date is the n2th ts2 in the n1th ts1.
Time Unit | ts1 | ts2 | frequency | start |
12 months/year | Year | Month | 12 | 1949.2 indicates the second month of the year 1949. |
4 quarters/year | Year | Quarter | 4 | 1949.2 indicates the second quarter of the year 1949. |
7 days/week | Week | Day | 7 | 1949.2 indicates the second day of the 1949th week. |
1 | Any time unit | 1 | 1 | 1949.1 indicates the year 1949, or the 1949th day or hour. |
Example: value=[1,2,3,5,6,7,8,9,10,11,12,13,14,15]
indicates that the unit time is 12 months per year, and the prediction starts from June of the year 1950.year
Jan
Feb
Mar
Apr
May
Jun
Jul
Aug
Sep
Oct
1949
1
2
3
4
5
6
7
8
9
10
1950
11
12
13
14
15
indicates that the unit time is four quarters per year, and the prediction starts from the second quarter of the year 1953.year
Qtr1
Qtr2
Qtr3
Qtr4
1949
1
2
1950
3
4
5
6
1951
7
8
9
10
1952
11
12
13
14
1953
14
15
indicates that the unit time is seven days per week, and the prediction starts from the fourth day of the 1951st week.week
Sun
Mon
Tue
Wed
Thu
Fri
Sat
1949
1
2
3
4
5
1950
6
7
8
9
10
11
12
1951
13
14
15
indicates that the prediction starts in 1963.00.cycle
p1
1949
1
1950
2
1951
3
1952
4
1953
5
1954
6
1955
7
1956
8
1957
9
1958
10
1959
11
1960
12
1961
13
1962
14
1963
15
Example
Prepare test data
This example uses the AirPassengers.csv dataset, which records the number of international airline passengers each month from the year 1949 to the year 1960. For more information about the dataset, see AirPassengers.
id | number |
1 | 112 |
2 | 118 |
3 | 132 |
4 | 129 |
5 | 121 |
... | ... |
Run the following Tunnel commands on the MaxCompute client to upload data. For information about how to install and configure the MaxCompute client, see MaxCompute client (odpscmd). For more information about Tunnel commands, see Tunnel commands.
create table pai_ft_x13_arima_input(id bigint,number bigint);
tunnel upload xxxx/airpassengers.csv pai_ft_x13_arima_input -h true;
Run PAI commands
You can use the SQL script or ODPS SQL component to run the following PAI commands:
PAI -name x13_arima
    -project algo_public
    -DinputTableName=pai_ft_x13_arima_input
    -DseqColName=id
    -DvalueColName=number
    -Dorder=3,1,1
    -Dseasonal=0,1,1
    -Dstart=1949.1
    -Dfrequency=12
    -Dperiod=12
    -DpredictStep=12
    -DoutputPredictTableName=pai_ft_x13_arima_out_predict
    -DoutputDetailTableName=pai_ft_x13_arima_out_detail
Output description
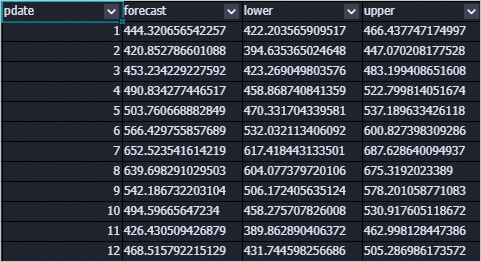
Output table outputPredictTableName
Field description
column name
comment
pdate
The date of the prediction.
forecast
The prediction conclusion.
lower
The lower threshold of the prediction results when the confidence level is specified. The default confidence level is 0.95.
upper
The upper threshold of the prediction results when the confidence level is specified. The default confidence level is 0.95.
The following figure shows the data.
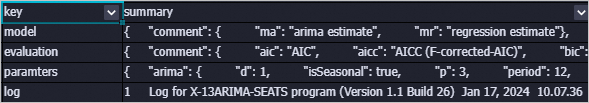
Output table outputDetailTableName
Field description
column name
comment
key
model: the model in use.
evaluation: the evaluation result.
parameters: the training parameters.
log: the training logs.
summary
The storage details.
The following figure shows the data.
FAQ
Why are prediction results the same?
If an exception occurs during model training, the mean model is called. In this case, all prediction results are the mean of the training data. Common exceptions include instability after temporal-difference learning, training without convergence, and variance 0. You can view the stderr file of individual nodes in Logview to obtain specific information about exceptions.
How do I configure the component parameters?
You need to configure the p, d, q, sp, sd, and sq parameters for the x13_arima component. If you are not confident with the parameter settings, we recommend that you use the x13_auto_arima component.
You need to only set the upper limits for the component. The component automatically tunes the parameters.
Error message:
ERROR: Number of observations after differencing and/or conditional AR estimation is 9, which is less than the minimum series length required for the model estimated, 24The training data is insufficient. Modify the frequency parameter or add more training data.
Error message:
ERROR: Order of the MA operator is too largeIn most cases, this error occurs because the training data is insufficient.
Error message:
ERROR: Series to be modelled and/or seasonally adjusted must have at least 3 complete years of dataIf you have specified the seasonal parameters, at least three years of data is required.
References
You need to configure parameters such as p, d, q, sp, sd, and sq for the x13_arima component. If you are not sure how to configure the parameters, we recommend that you use the x13_auto_arima component. You only need to specify the upper limit for the parameters for this component, and the system automatically specifies the optimal parameter values. For more information, see x13_auto_arima.