Database Autonomy Service (DAS) Auto Scaling monitors real-time performance data of database instances to detect traffic anomalies and automatically scale storage, computing specifications, and bandwidth — without manual intervention.
When to use Auto Scaling
DAS Auto Scaling is designed for workloads where demand is unpredictable or variable. The following table compares Auto Scaling with manual capacity management.
| Auto Scaling | Manual management | |
|---|---|---|
| Traffic pattern | Unpredictable spikes, periodic surges, or intermittent high load | Stable, predictable workloads |
| Scaling action | Automatic, triggered by thresholds or ML-based forecasting | Manual specification changes |
| Response time | Real-time detection and scaling | Depends on O&M response speed |
| Scale-back | Automatic rollback after traffic normalizes | Manual |
| Best for | New product launches, flash sales, daily punch-in peaks, viral events | Long-running workloads with known, stable traffic |
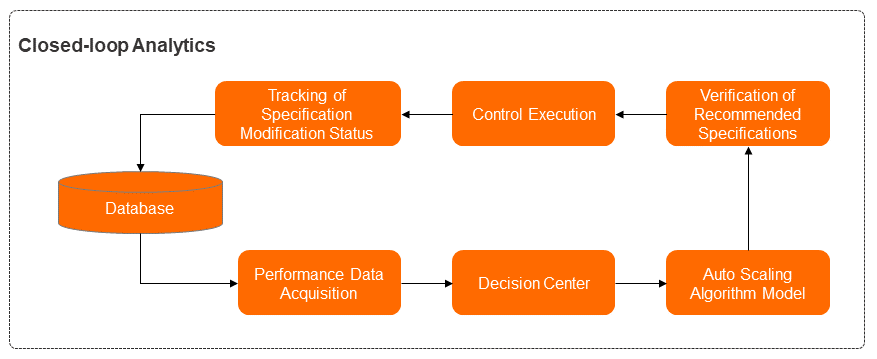
How it works
DAS Auto Scaling uses a closed-loop system with six modules that work in sequence:
Performance data collection — Collects real-time performance metrics, specification configurations, and session information from running database instances.
Decision-making center — Analyzes the current performance data and session list to decide the appropriate action: enable SQL throttling (when slow queries are the root cause) or proceed with scaling (when traffic is genuinely exceeding capacity).
Algorithm model — The core module. Runs anomaly detection on business traffic and generates capacity specification recommendations.
Specification recommendation and verification — Validates that recommended specifications match the instance's deployment type, operating environment, and available specifications in the current region.
Management — Distributes and applies the specification changes.
Status tracking — Measures performance before and after specification changes to evaluate results.
Features
DAS Auto Scaling provides three scaling capabilities.
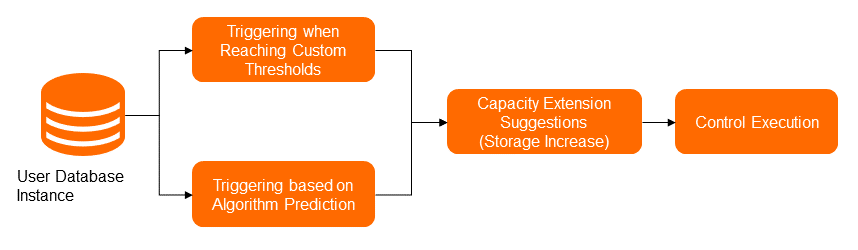
Automatic storage expansion
Automatic storage expansion prevents disk-full situations by expanding disk capacity before it reaches the limit.
Trigger conditions:
Storage expansion is triggered when either of the following conditions is met:
Disk utilization exceeds the configured threshold (default: 90%). You can configure a custom threshold to override this default.
The time-series forecasting algorithm predicts that disk space will be exhausted in the near term, based on historical disk usage trends.
Expansion rules:
Each expansion increases disk space by at least 5 GB and at most 15%.
Notifications sent:
Specification recommendations — describes the current disk size and the recommended expanded size
Task status — reports the progress and result of the expansion
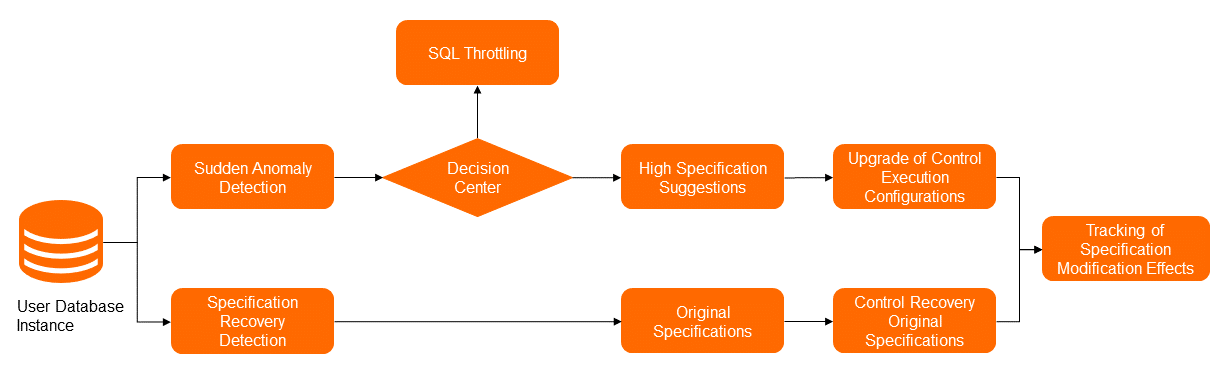
Auto scaling for specifications
Auto scaling for specifications automatically changes instance specifications (CPU cores and memory) in response to traffic spikes and rolls back to the original specifications after traffic normalizes.
How the scaling decision is made:
The anomaly detection module monitors multiple performance metrics simultaneously — including QPS (queries per second), TPS (transactions per second), active sessions, and IOPS — to identify genuine traffic spikes. The decision-making center then determines the appropriate action:
If slow SQL queries are congesting the task queue, SQL throttling is applied as the emergency measure instead of scaling up.
If actual business traffic exceeds the current capacity, the scaling process proceeds.
Scale-out vs. scale-up:
| Method | When it applies | How it works |
|---|---|---|
| Scale-out (horizontal) | Read-heavy traffic | Adds read-only nodes to distribute read load |
| Scale-up (vertical) | Write-heavy traffic | Upgrades instance specifications; upgrades the secondary node first, then performs a primary/secondary switchover to minimize impact |
The specification recommendation algorithm uses a trained model combined with current and historical performance data to recommend the most appropriate target specifications — avoiding over-provisioning and unnecessary repeated changes.
Rollback:
After the traffic anomaly ends, DAS detects that metrics return to normal within the observation window and automatically rolls back to the original specifications stored in the metadata.
Configurable parameters:
Abruptness level — sensitivity of anomaly detection
Duration of traffic load — observation window for triggering and rollback
Maximum specifications — upper limit for scaling up
Whether to roll back after scaling
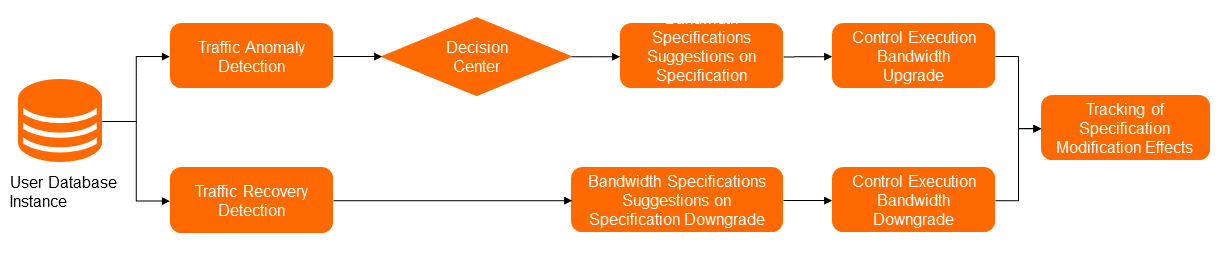
Automatic bandwidth adjustment
Automatic bandwidth adjustment detects anomalies in outbound and inbound traffic usage and upgrades bandwidth specifications when the current bandwidth is insufficient. After traffic normalizes, DAS rolls back to the original bandwidth specifications.
Supported database engines
| Feature | Supported database engines |
|---|---|
| Auto scaling for specifications | ApsaraDB RDS for MySQL High-availability Edition (standard SSDs or ESSDs); general-purpose ApsaraDB RDS for MySQL High-availability Edition (local disks); general-purpose ApsaraDB RDS for MySQL Enterprise Edition; PolarDB for MySQL Cluster Edition; ApsaraDB for Redis Community Edition; memory-optimized ApsaraDB for Redis Enhanced Edition (Tair) |
| Automatic storage expansion | ApsaraDB RDS for MySQL High-availability Edition (standard SSDs or ESSDs); ApsaraDB RDS for MySQL Cluster Edition; ApsaraDB RDS for PostgreSQL High-availability Edition (standard SSDs or ESSDs); ApsaraDB MyBase for MySQL High-availability Edition (standard SSDs or ESSDs); ApsaraDB MyBase for MySQL High-availability Edition (local disks) |
| Automatic bandwidth adjustment | ApsaraDB for Redis (local disks) |
Core technologies
DAS Auto Scaling is built on five key technologies developed by the Alibaba Cloud database team:
Network-wide real-time monitoring — Collects performance data from database instances across the entire network with a latency of several seconds. Processes more than 10 million monitoring metrics per second in real time, providing the data foundation for all scaling decisions.
Unified management task flows — Executes O&M operations across the entire Alibaba Cloud network to reliably apply scaling changes.
Time-series anomaly detection algorithm — Uses machine learning to perform periodic detection, identify turning points, and detect continuous anomaly intervals. Covers more than 700,000 online database instances. For next-day forecasts, more than 99% of instances have a forecast error below 5%. For 14-day forecasts, more than 94% meet the same threshold.
Deep learning-based response time (RT) forecasting model — Forecasts database RT based on performance metrics such as CPU utilization, logical reads, physical reads, and IOPS. This model has reduced buffer pool memory usage by 27 TB across Alibaba Cloud databases — approximately 17% of total memory.
Next generation PolarDB for MySQL — A relational database built on the cloud computing architecture where compute nodes are separated from storage nodes. This separation provides powerful technical support for Auto Scaling by preventing additional overheads caused by data replication and storage, significantly improving user experience.
Example
The following example shows how DAS Auto Scaling responds to two successive traffic events on an ApsaraDB RDS for MySQL instance, configured with a 15-minute observation window and an 80% CPU utilization threshold.
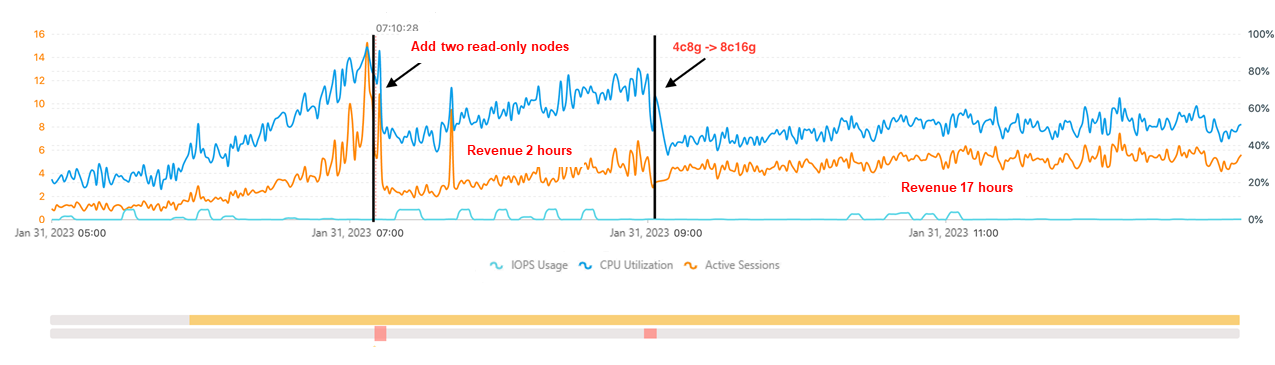
Event 1 — 07:10: CPU utilization and active sessions surge due to a traffic spike. CPU reaches 80%. Traffic analysis shows the workload is read-heavy, so DAS adds two read-only nodes. CPU drops to 60% and the instance stabilizes.
Event 2 — 09:00: CPU surges again as business volume increases. Traffic analysis shows the workload is now write-heavy, so DAS upgrades the computing specifications instead of adding read-only nodes. CPU drops to 50% and the instance stabilizes again.
This example demonstrates how the decision-making center selects the appropriate scaling method based on traffic characteristics — not a one-size-fits-all approach.