Modularity is a metric that measures the strength of division of a network into communities. This metric quantifies the density of links within communities as compared to links between communities. A Modularity value greater than 0.3 indicates that the network has a strong community structure. Machine Learning Designer provides the Modularity component, which can calculate the Modularity value of a graph.
Configure the component
Method 1: Use the Platform for AI (PAI) console
To configure the component in the PAI console, log on to the PAI console, go to the Visualized Modeling (Designer) page, and then open a pipeline. On the pipeline page, drag the Modularity component to the canvas and configure the parameters in the right-side pane. The following table describes the parameters.
Category | Parameter | Description |
Fields Setting | Source Vertex Column | The column that contains the start vertices in the edge list. |
Initial Vertex Label Column | The group to which the start vertices in the edge list belong. | |
Target Vertex Column | The column that contains the end vertices in the edge list. | |
Target Vertex Label Column | The group to which the end vertices in the edge list belong. | |
Tuning | Number of Workers | The number of workers that are run at the same time. A higher value results in higher communication overhead. |
Worker Memory (MB) | The maximum amount of memory that can be used by a worker. Unit: MB. Default value: 4096. If the actual memory usage exceeds this value, the |
Method 2: Use PAI commands
To configure the Modularity component by using PAI commands, run the commands in the SQL Script component. For more information, see Scenario 4: Execute PAI commands within the SQL script component.
PAI -name Modularity
    -project algo_public
    -DinputEdgeTableName=Modularity_func_test_edge
    -DfromVertexCol=flow_out_id
    -DfromGroupCol=group_out_id
    -DtoVertexCol=flow_in_id
    -DtoGroupCol=group_in_id
    -DoutputTableName=Modularity_func_test_result;
Parameter | Required | Default value | Description |
inputEdgeTableName | Yes | N/A | The name of the input edge list. |
inputEdgeTablePartitions | No | Full list | The partitions in the input edge list. |
fromVertexCol | Yes | N/A | The column that contains the start vertices in the edge list. |
fromGroupCol | Yes | N/A | The group to which the start vertices in the edge list belong. |
toVertexCol | Yes | N/A | The column that contains the end vertices in the edge list. |
toGroupCol | Yes | N/A | The group to which the end vertices in the edge list belong. |
outputTableName | Yes | N/A | The name of the output table. |
outputTablePartitions | No | N/A | The partitions in the output table. |
lifecycle | No | N/A | The lifecycle of the output table. |
workerNum | No | None | The number of workers that are run at the same time. A higher value results in higher communication overhead. |
workerMem | No | 4096 | The maximum amount of memory that can be used by a worker. Unit: MB. Default value: 4096. If the actual memory usage exceeds this value, the |
splitSize | No | 64 | The size of the split input data. Unit: MB. |
Example
Clear the Use Script Mode and Whether the system adds a create table statement check boxes in the right-side pane when you perform the following steps.
Add the SQL Script component and paste the following SQL statements to the editor in the right-side pane to generate training data:
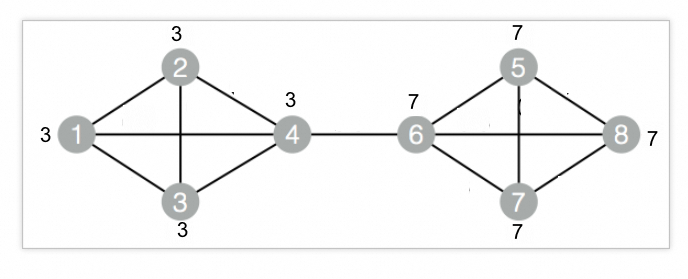
drop table if exists Modularity_func_test_edge;
create table Modularity_func_test_edge as
select * from
(
    select '1' as flow_out_id,'3' as group_out_id,'2' as flow_in_id,'3' as group_in_id
    union all
    select '1' as flow_out_id,'3' as group_out_id,'3' as flow_in_id,'3' as group_in_id
    union all
    select '1' as flow_out_id,'3' as group_out_id,'4' as flow_in_id,'3' as group_in_id
    union all
    select '2' as flow_out_id,'3' as group_out_id,'3' as flow_in_id,'3' as group_in_id
    union all
    select '2' as flow_out_id,'3' as group_out_id,'4' as flow_in_id,'3' as group_in_id
    union all
    select '3' as flow_out_id,'3' as group_out_id,'4' as flow_in_id,'3' as group_in_id
    union all
    select '4' as flow_out_id,'3' as group_out_id,'6' as flow_in_id,'7' as group_in_id
    union all
    select '5' as flow_out_id,'7' as group_out_id,'6' as flow_in_id,'7' as group_in_id
    union all
    select '5' as flow_out_id,'7' as group_out_id,'7' as flow_in_id,'7' as group_in_id
    union all
    select '5' as flow_out_id,'7' as group_out_id,'8' as flow_in_id,'7' as group_in_id
    union all
    select '6' as flow_out_id,'7' as group_out_id,'7' as flow_in_id,'7' as group_in_id
    union all
    select '6' as flow_out_id,'7' as group_out_id,'8' as flow_in_id,'7' as group_in_id
    union all
    select '7' as flow_out_id,'7' as group_out_id,'8' as flow_in_id,'7' as group_in_id
)tmp
;
Corresponding graph data structure:
Add another SQL Script component and paste the following commands to the editor in the right-side pane to start training. Then, connect the two components you added.
drop table if exists ${o1};
PAI -name Modularity
    -project algo_public
    -DinputEdgeTableName=Modularity_func_test_edge
    -DfromVertexCol=flow_out_id
    -DfromGroupCol=group_out_id
    -DtoVertexCol=flow_in_id
    -DtoGroupCol=group_in_id
    -DoutputTableName=${o1};
Run the pipeline. After the pipeline execution is complete, right-click the SQL Script component that you added in the previous step and choose View Data > SQL Script Output in the shortcut menu to view the training results.
| val                 |
| ------------------- |
| 0.42307692766189575 |