Business performance reports
You can use this feature to view the recommendation results of AIRec. You can set trace_id to Alibaba to obtain recommendation results that are generated in AIRec, and set trace_id to selfhold to obtain recommendation results that are generated in a self-developed or self-operated recommendation system. Then, you can compare the recommendation results.
1. Instance dashboard
The instance dashboard allows you to view recommendation results in AIRec. You can compare current recommendation results with historical recommendation results to monitor the status of business data at the earliest opportunity.
Metrics
PV_CTR: the Click Through Rate (CTR). Calculation formula: Total number of clicks/Total number of exposures. Duplicate records are counted.
UV_CTR: the proportion of users who click an item. Calculation formula: Number of users who click an item/Total number of users who view a page.
PV_CVR: the conversion rate. Calculation formula: Number of purchases/Number of clicks.
UV_CVR: the proportion of converted users. Calculation formula: Number of users who purchase an item/Number of users who click the item.
Active items: the total number of items on which users performed operations.
Compare (Day to Day): the comparison of the current value with the value of the previous day.
Compare (Week over Week): the comparison of the current value with the value of the same day last week.
Highest: the maximum value in a query period.
Lowest: the minimum value in a query period.
Average: the average value of all days in a query period.
Daily Active Users: the number of users whose behavioral data is returned within one day.
Monthly Active Users: the number of users whose behavioral data is returned within 30 days.
Terms
trace_id: specified in a behavior table. This field is used to specify whether behavior entries are generated by using AIRec or a self-developed recommendation system. For more information about the trace_id field, see data specifications.
Cross-channel users: the number of users in different buckets for A/B testing. Users must be randomly assigned and can obtain recommendations only from AIRec or a self-developed recommendation system for comparison testing on the recommendation effect. In this case, the metric value is 0.
Example: Two behavior entries are returned for a user whose user_id is 1. The bhv_type field is set to expose in both behavior entries, and the trace_id field is separately set to Alibaba and selfhold. This indicates that the recommendation results that are viewed by the user are separately generated by AIRec and a self-developed recommendation system. In this case, the user is a cross-channel user.
scene_id: specified in a behavior table.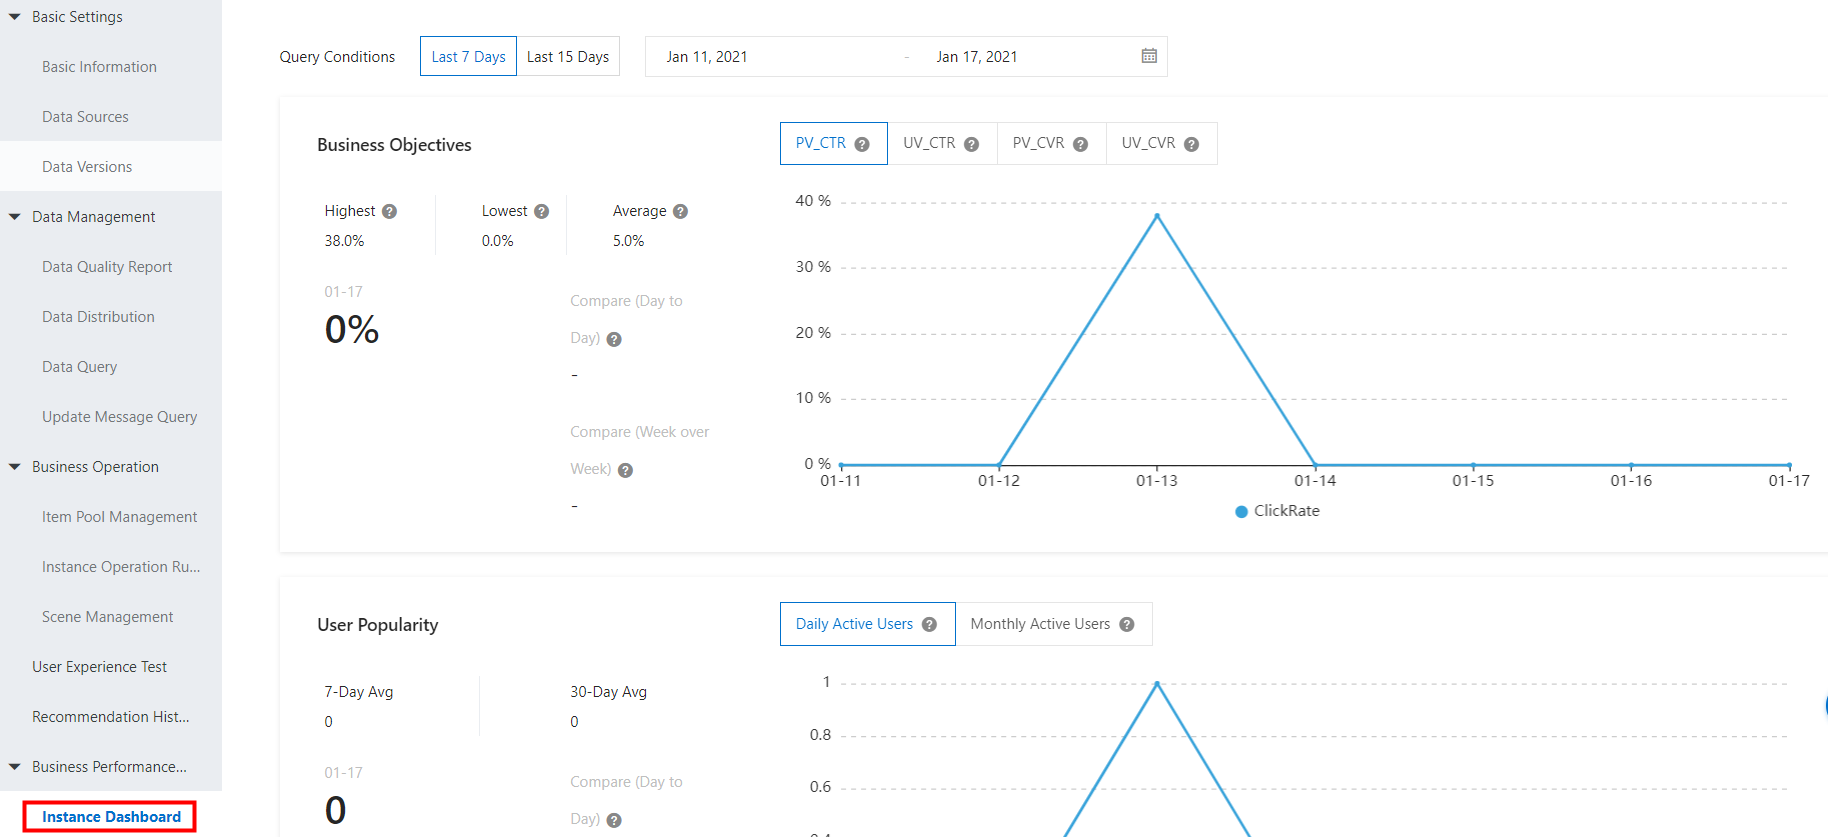
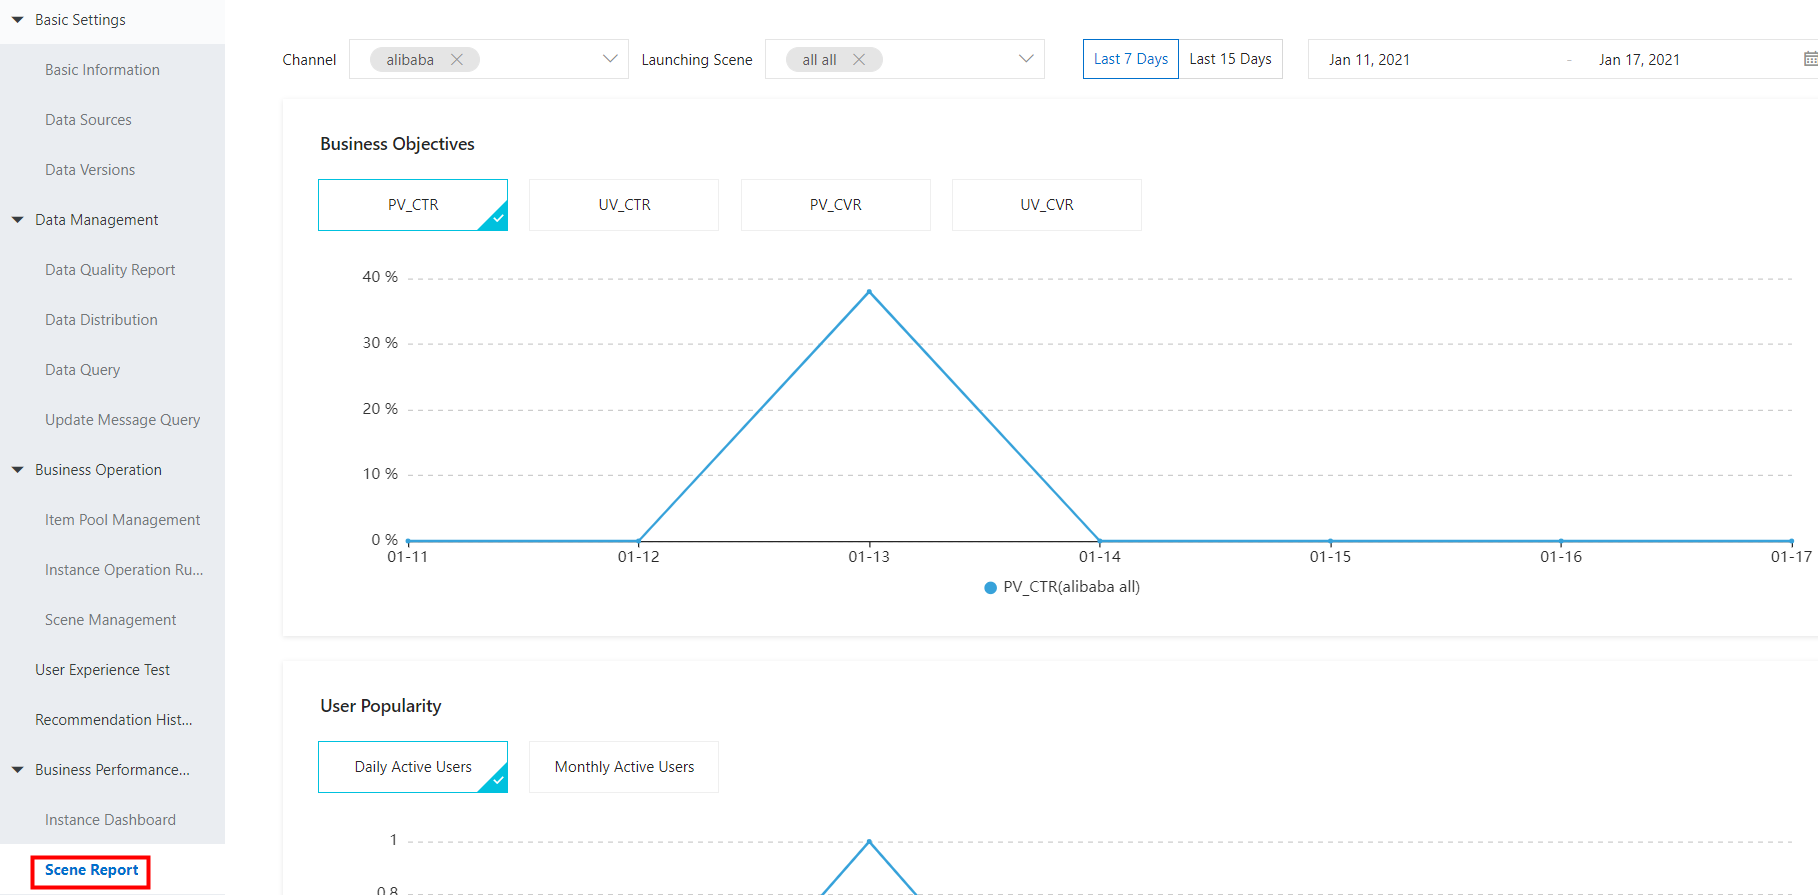
2. Scene reports
If you create a scene in the AIRec console, you can view the details about performance metrics for the scene. The Scene Report page in the AIRec console includes the following sections: Business Objectives, User Popularity, Overall Traffic Scale, Traffic CVR, and Traffic Consumed per Person. The Business Objectives section contains the following metrics: PV_CTR, UV_CTR, PV_CVR, and UV_CVR. You can set Channel to alibaba to obtain metric measurement results that are generated in AIRec, and set Channel to selfhold to obtain metric measurement results that are generated in a self-developed or self-operated recommendation system. Then, you can compare the metric measurement results.
Metrics
The Overall Traffic Scale section includes the following metrics:
Exposure+PV: the total number of exposures to an item in a specified query period in the behavioral data that you uploaded.
Click+PV: the total number of clicks on an item in a specified query period in the behavioral data that you uploaded.
Favorite+PV: the total number of favorites of an item in a specified query period in the behavioral data that you uploaded.
Share+PV: the total number of shares of an item in a specified query period in the behavioral data that you uploaded.
Comment+PV: the total number of comments on an item in a specified query period in the behavioral data that you uploaded.
Exposure+UV: the total number of users to which an item is exposed in a specified query period in the behavioral data that you uploaded.
Click+UV: the total number of users who click an item in a specified query period in the behavioral data that you uploaded.
Favorite+UV: the total number of users who add an item to favorites in a specified query period in the behavioral data that you uploaded.
Share+UV: the total number of users who share an item in a specified query period in the behavioral data that you uploaded.
Comment+UV: the total number of users who comment on an item in a specified query period in the behavioral data that you uploaded.