After you create a Message Service (MNS) queue, Cloud Monitor automatically starts to monitor the queue. Cloud Monitor provides multiple metrics, such as the number of active messages, delayed messages, and invisible messages. These metrics indicate the status of queues. Cloud Monitor also allows you to configure alert rules for these metrics so that you can receive alerts if exceptions occur.
Metrics
The following table lists the metrics that are used by Cloud Monitor.
| Metric | Unit | Metric | Dimensions | Statistics |
|---|---|---|---|---|
| Active Messages | Count | ActiveMessages | userId, region, and queue | Maximum, Minimum, and Average |
| Number of message batch deleting requests | Count | BatchDeleteMessageCount | userId, region, and queue | Maximum, Minimum, and Average |
| Number of message batch receiving requests | Count | BatchReceiveMessageCount | userId, region, and queue | Maximum, Minimum, and Average |
| Number of message batch sending requests | Count | BatchSendMessageCount | userId, region, and queue | Maximum, Minimum, and Average |
| Number of active period modifying requests | Count | ChangeMessageVisibilityCount | userId, region, and queue | Maximum, Minimum, and Average |
| Delayed Message | Count | DelayMessages | userId, region, and queue | Maximum, Minimum, and Average |
| Number of message deleting requests | Count | DeleteMessageCount | userId, region, and queue | Maximum, Minimum, and Average |
| Inactive Messages | Count | InactiveMessages | userId, region, and queue | Maximum, Minimum, and Average |
| Number of message receiving requests | Count | ReceiveMessageCount | userId, region, and queue | Maximum, Minimum, and Average |
| Number of message sending requests | Count | SendMessageCount | userId, region, and queue | Maximum, Minimum, and Average |
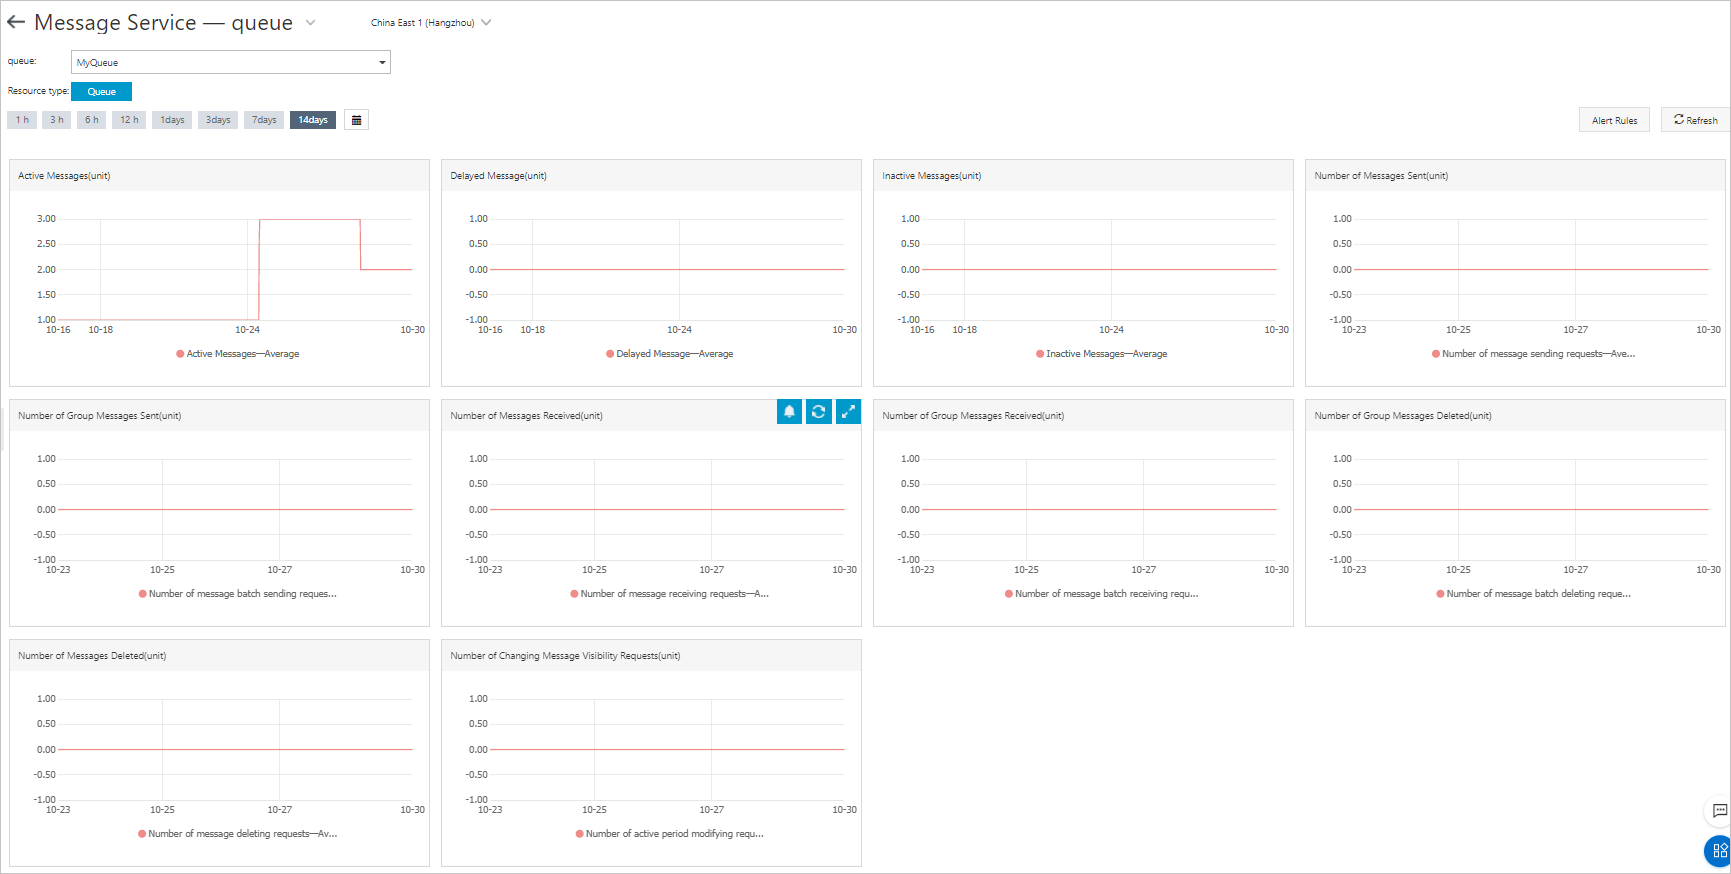
View the monitoring data
- Log on to the Cloud Monitor console.
- In the left-side navigation pane, choose .
- On the Cloud product charts page, select Message Service-queue from the drop-down list. On the page that appears, select a region. Find the queue
and click Monitoring Charts in the Actions column. On the page that appears, select
a resource type and a time range.
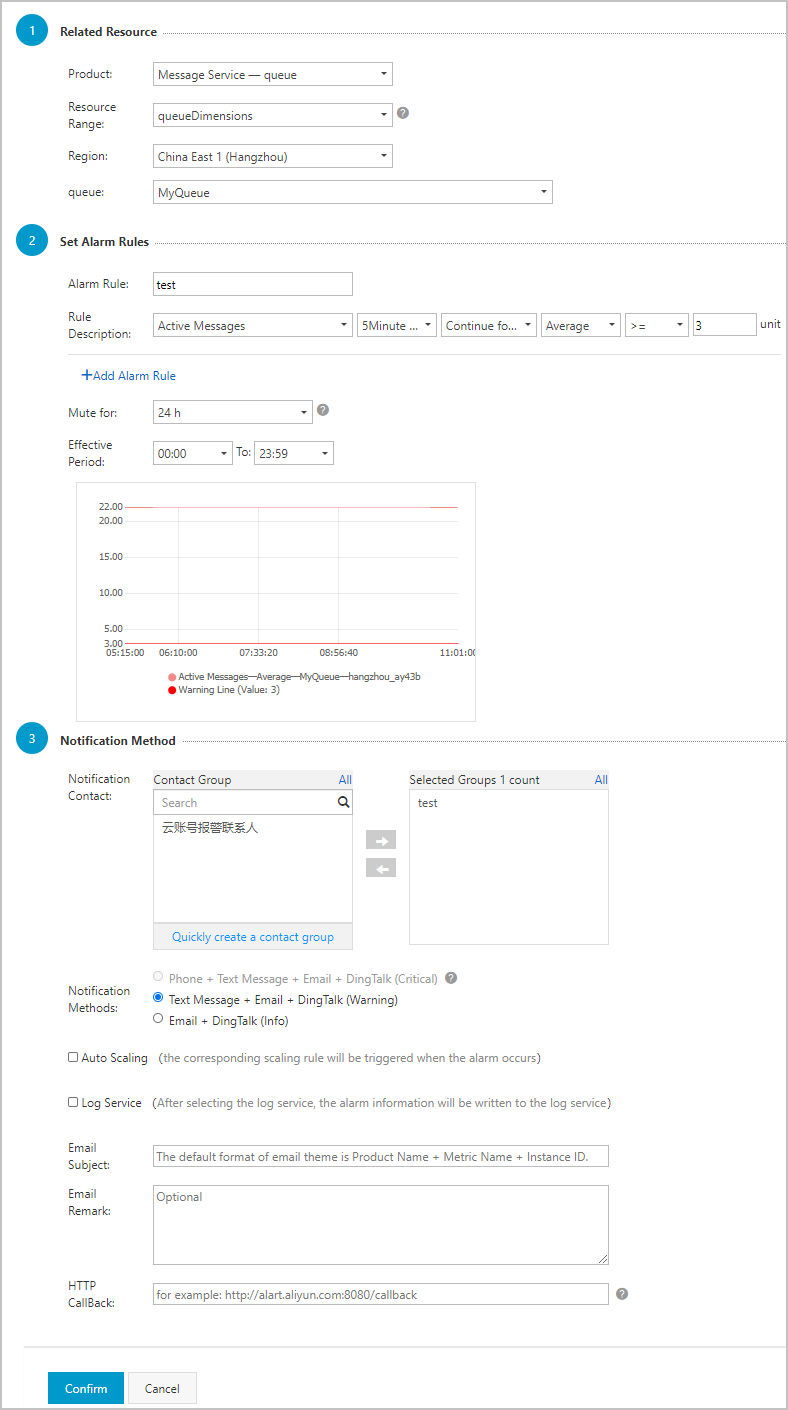
Set alert rules
- In the Related Resource section on the Create Alert Rule page, select Message Service-queue from the Product drop-down list, and select a resource range. Set alert rules in the Set Alert Rules section. Set a notification method in the Notification Method section. Then, click Confirm.