Enterprise Distributed Application Service (EDAS) supports the Prometheus monitoring feature. On the monitoring dashboard, you can view the basic information, CPU metrics, memory metrics, and network metrics of pods. You can also modify the properties of dashboard data, such as the time interval and refresh rate.
Go to the feature page
Log on to the EDAS console.
In the left-side navigation pane, choose Application Management > Applications. In the top navigation bar, select a region, select a microservices namespace from the Microservices Namespace drop-down list, select Kubernetes Cluster from the Cluster Type drop-down list, and then click the name of the desired application.
In the left-side navigation pane, choose .
You are navigated to the Kubernetes Container Replica page of Grafana.
View metrics
On the Kubernetes Container Replica page, you can switch pods to view the metrics of different pods.
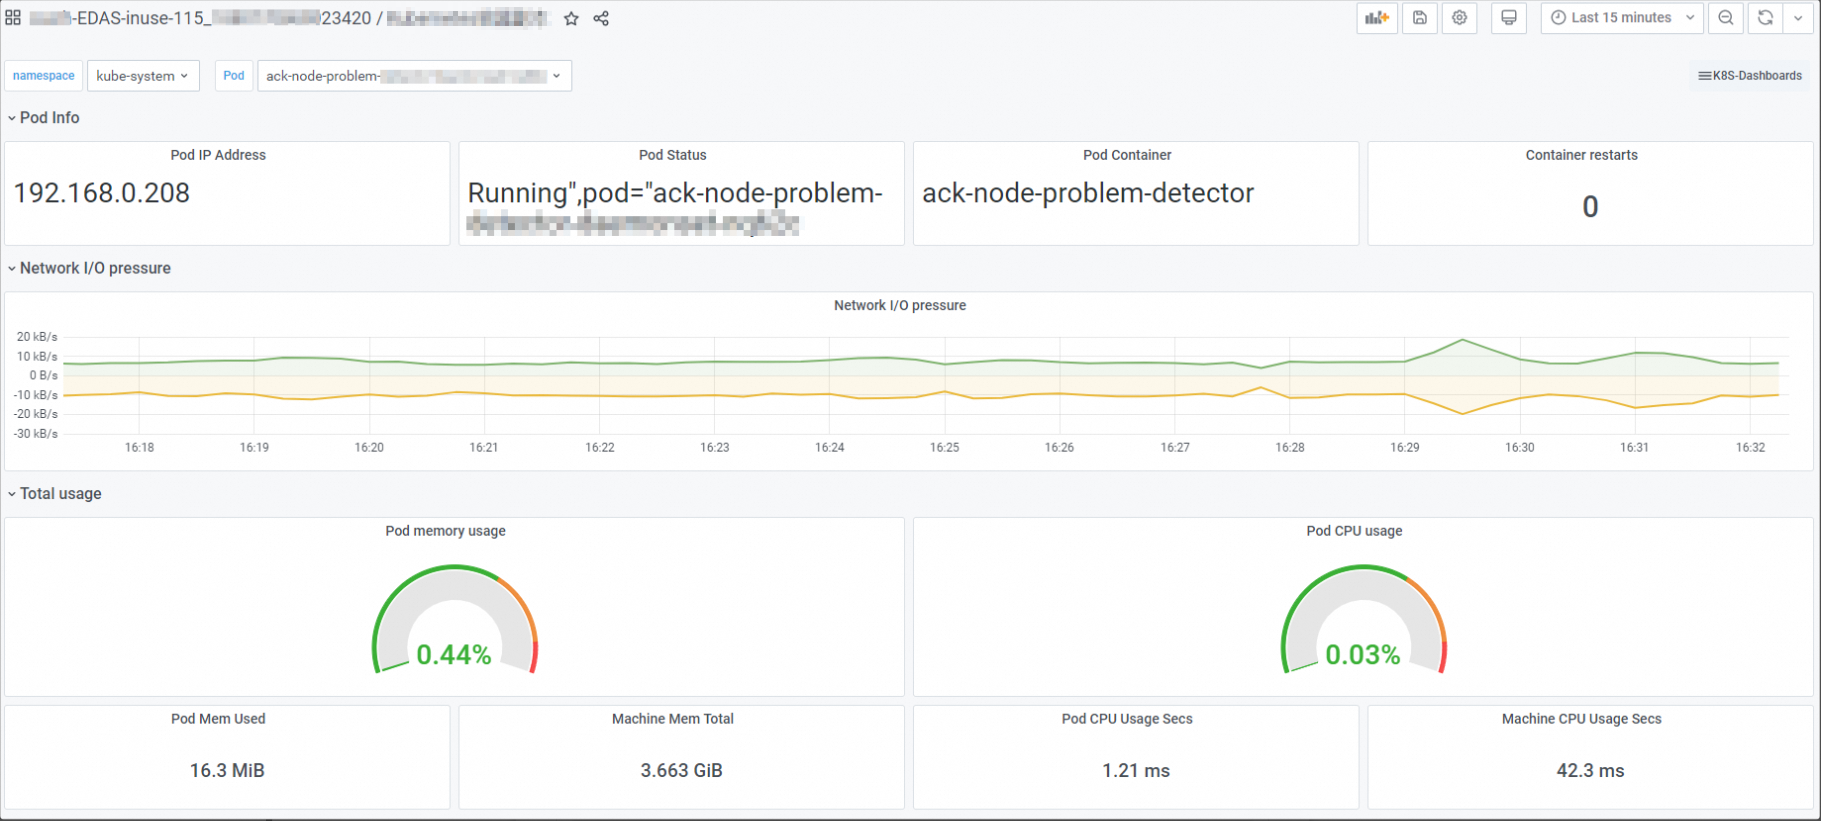
The dashboard displays the following metrics:
Pod information such as Pod IP Address, Pod Status, Pod Container, and Container restarts
Overall usage metrics such as Pod CPU usage and Pod memory usage
CPU metrics such as Pods CPU usage and All processes CPU usage
Memory metrics such as Pods memory usage and All processes memory usage
Network metrics such as Network I/O pressure, Pods network I/O, and All processes network I/O
Common operations
After you click a panel name, you can perform the following operations:
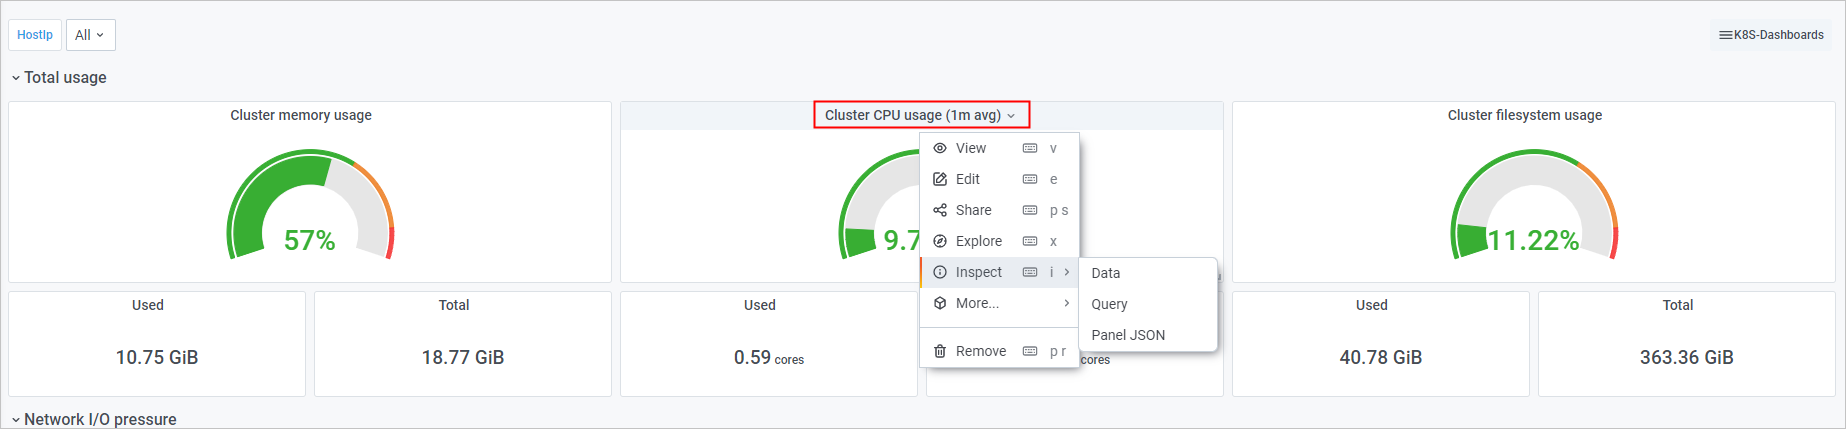
To view the panel in full screen mode, click View or press the V key. You can press the V key again or press the Esc key to exit the full screen mode.
To edit the panel, click Edit or press the E key. On the Edit Panel page, modify information about the panel and click Apply in the upper-right corner.
To share the panel, click Share or press the P and S keys in sequence. In the Share Panel dialog box, obtain the sharing link, embedded link, or snapshot link of the panel.
To explore the panel, click Explore or press the X key. On the Explore page, check metrics, troubleshoot issues, or explore data.
To export the data of the panel as a CSV file, choose . On the Data tab, click Download CSV to export data.
To view the query metrics of the panel, choose . On the Query tab, view the request and response.
To obtain the JSON code of the panel, choose . On the JSON tab, copy the JSON code.
To copy and paste the panel, choose , or press the P and D keys in sequence. The panel is copied and pasted into the current dashboard.
To copy the panel, choose . The panel is copied.