The API call statistics feature enables organization administrators to collect comprehensive data on API calls, including both OpenAPI and Data Service API usage.
Feature entry
You can access the API call statistics page by following the steps illustrated below.
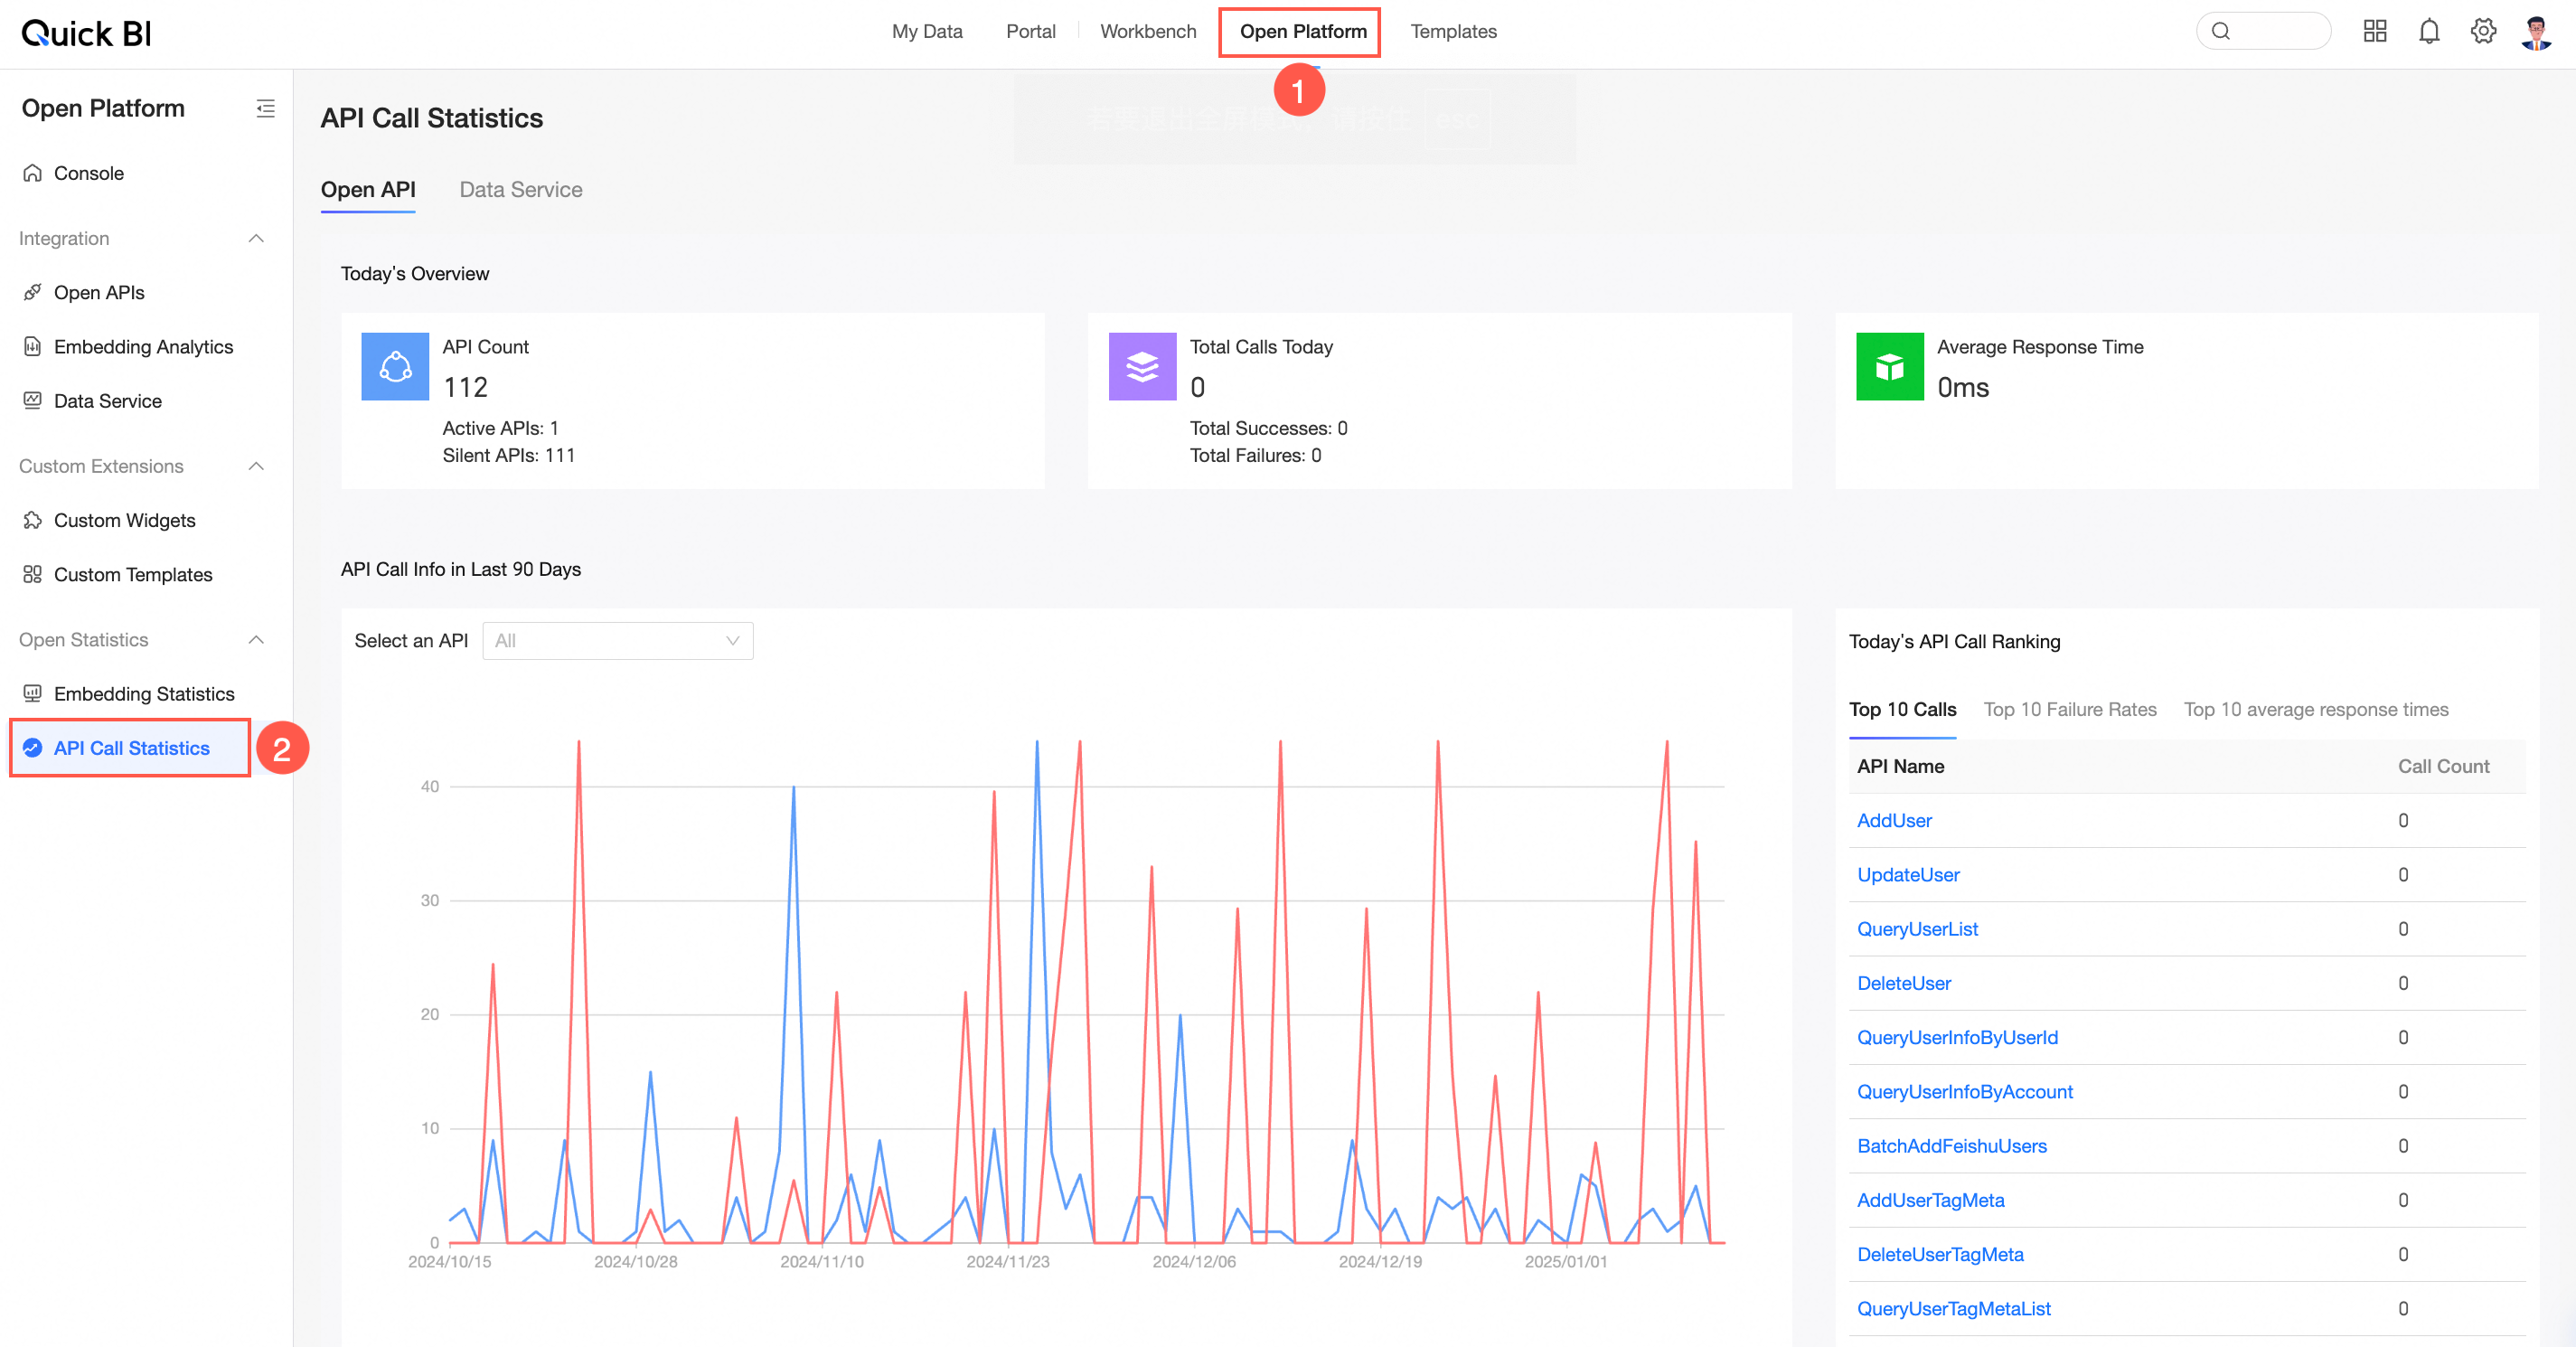
API call statistics
The API Call Statistics page provides an Overview of Today, API Call Statistics for the Last 90 Days, API Daily Call Ranking, and API Call Details for both OpenAPI and Data Service API.
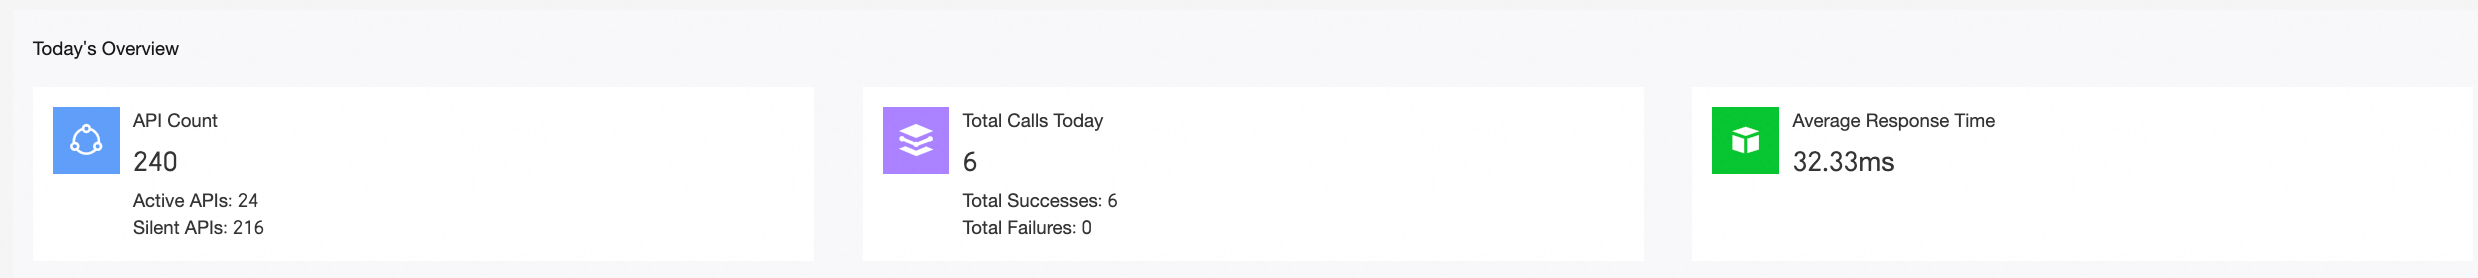
Overview of today
The overview includes three key metrics: API Count Statistics, Total Number of Calls Today, and Average Response Time.
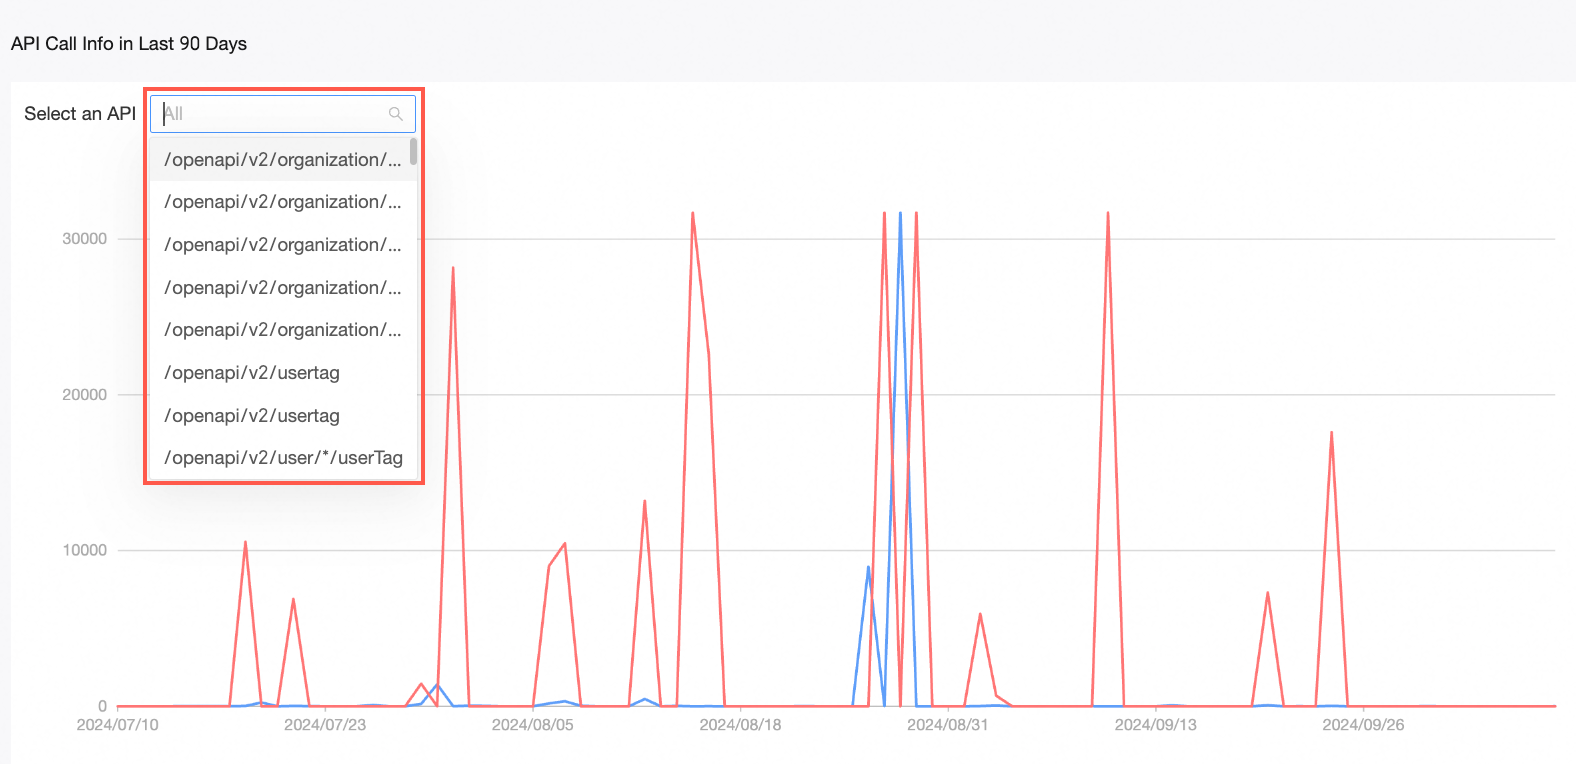
API call statistics for the last 90 days
This chart displays the call status of all APIs associated with the username over the past 90 days. It defaults to showing all APIs, but you can filter to view a single API's call status.
API daily call ranking
The list showcases the Top 10 by Call Volume, Top 10 by Failure Rate, and Average Response Time. Click on an API name to view its detailed information. 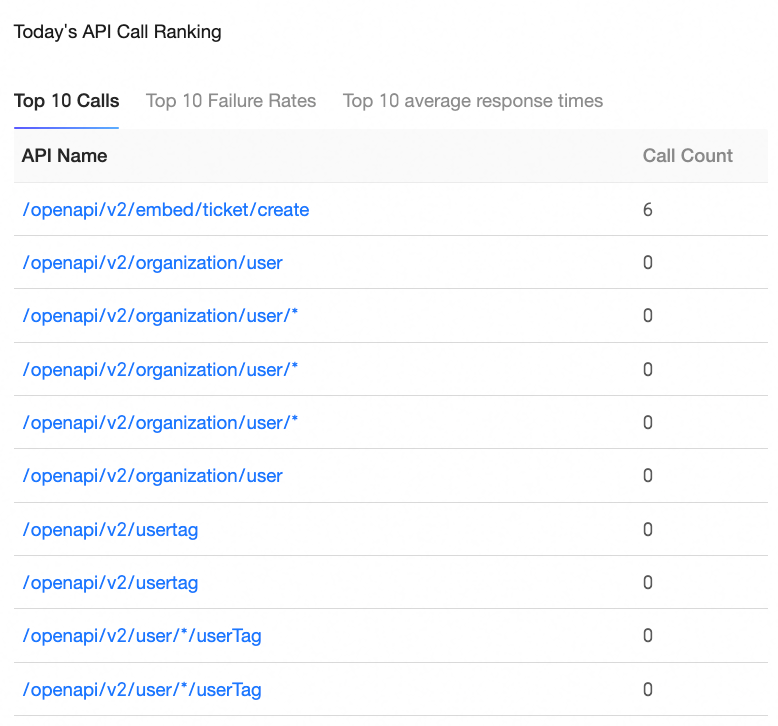
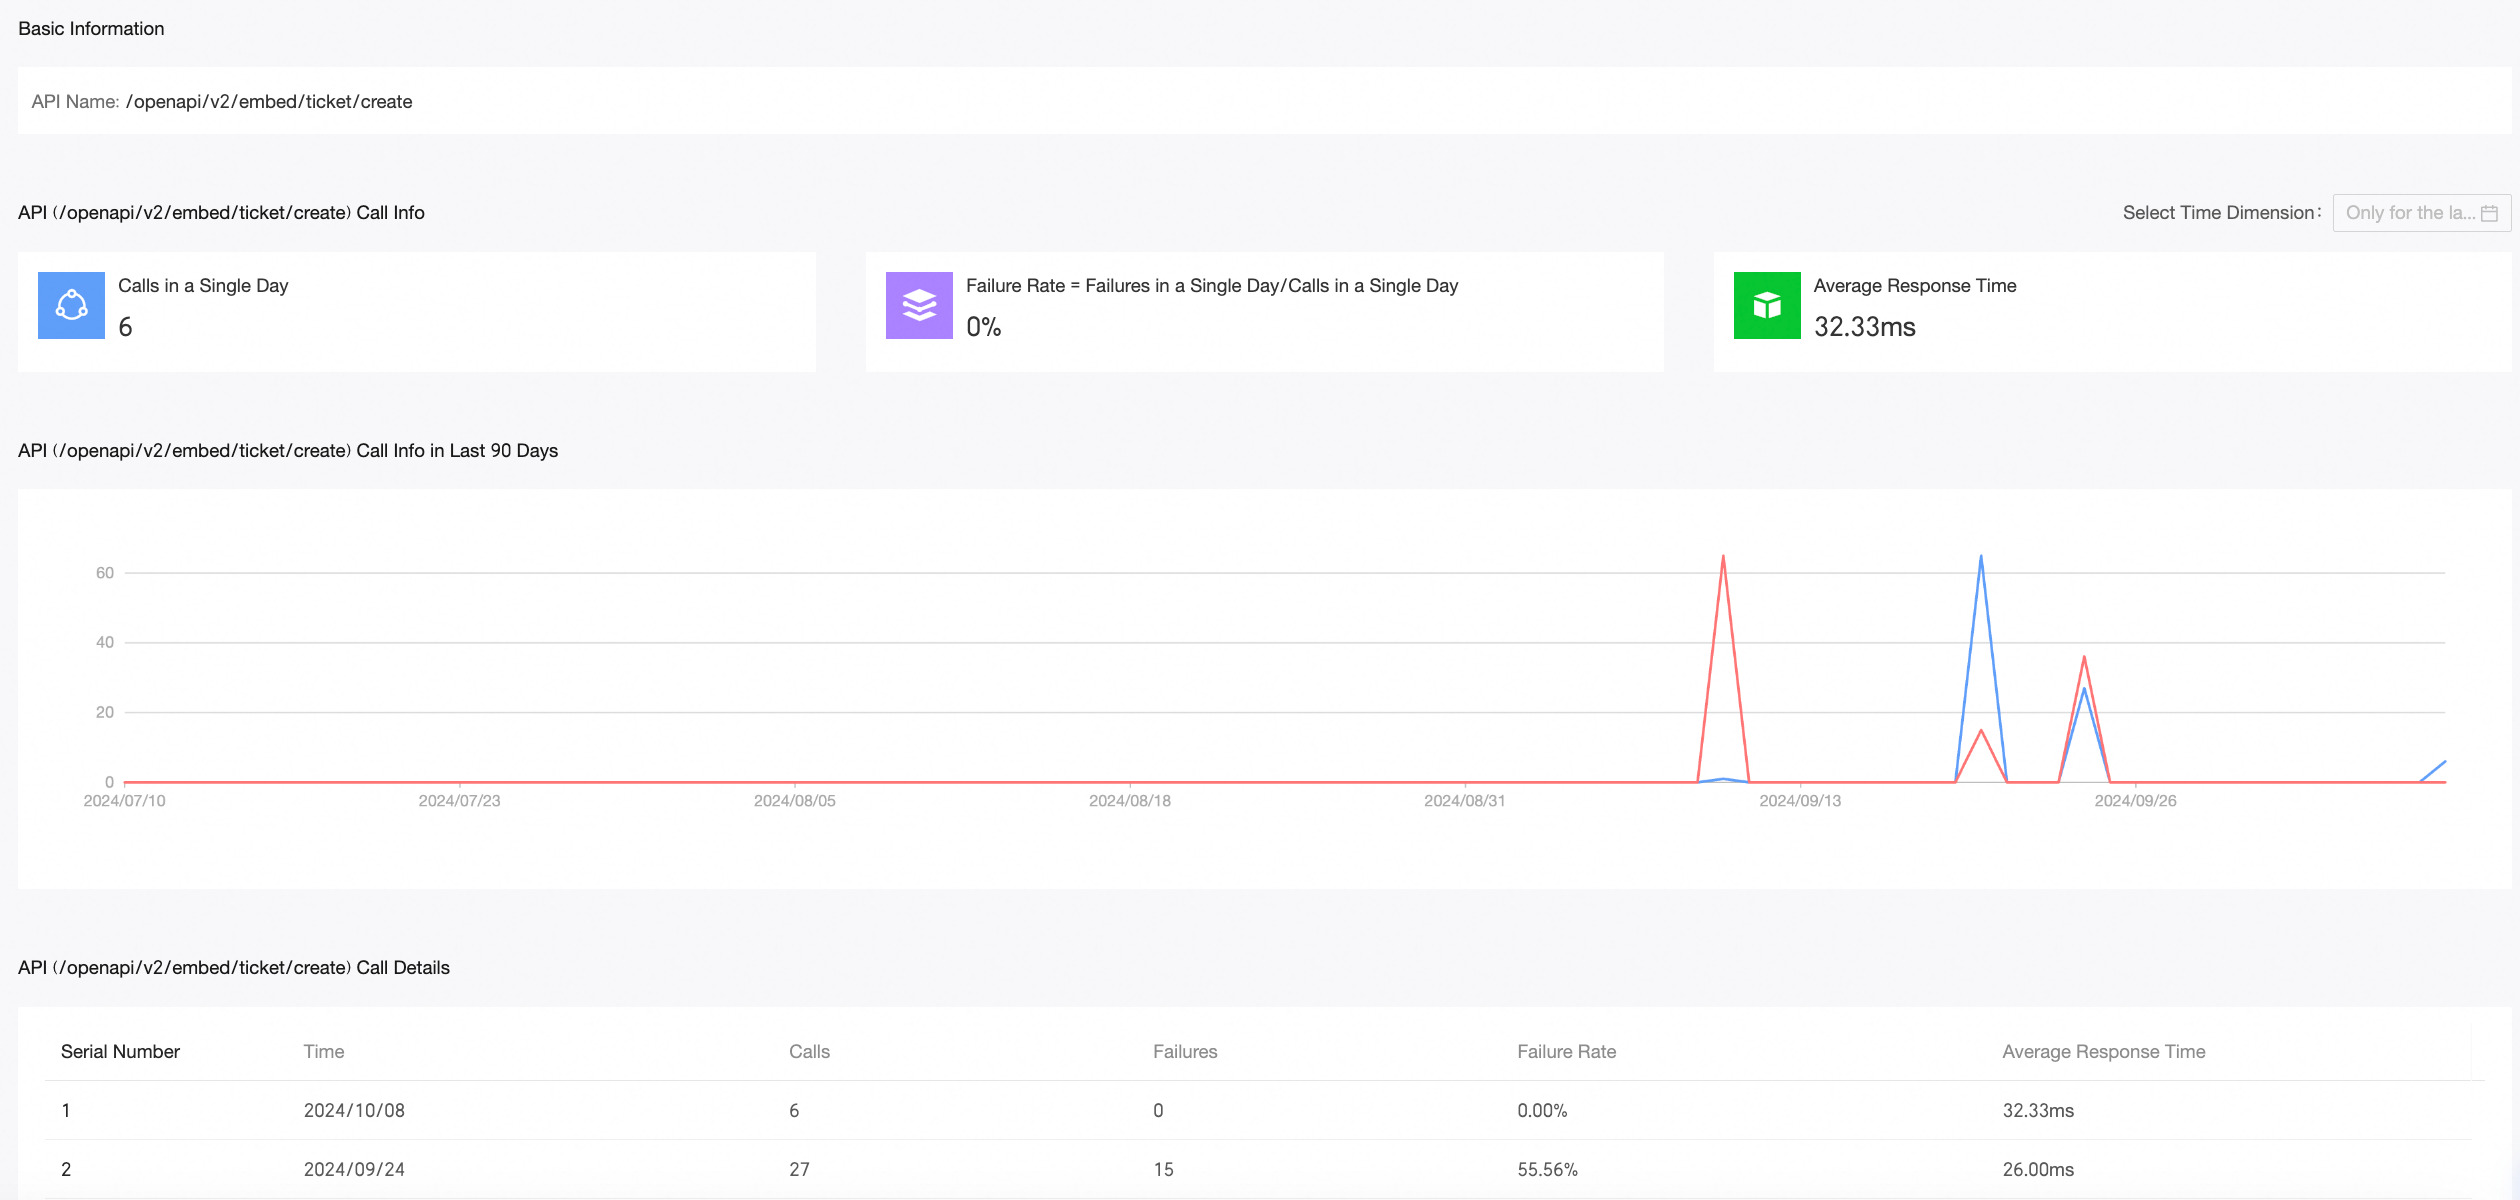
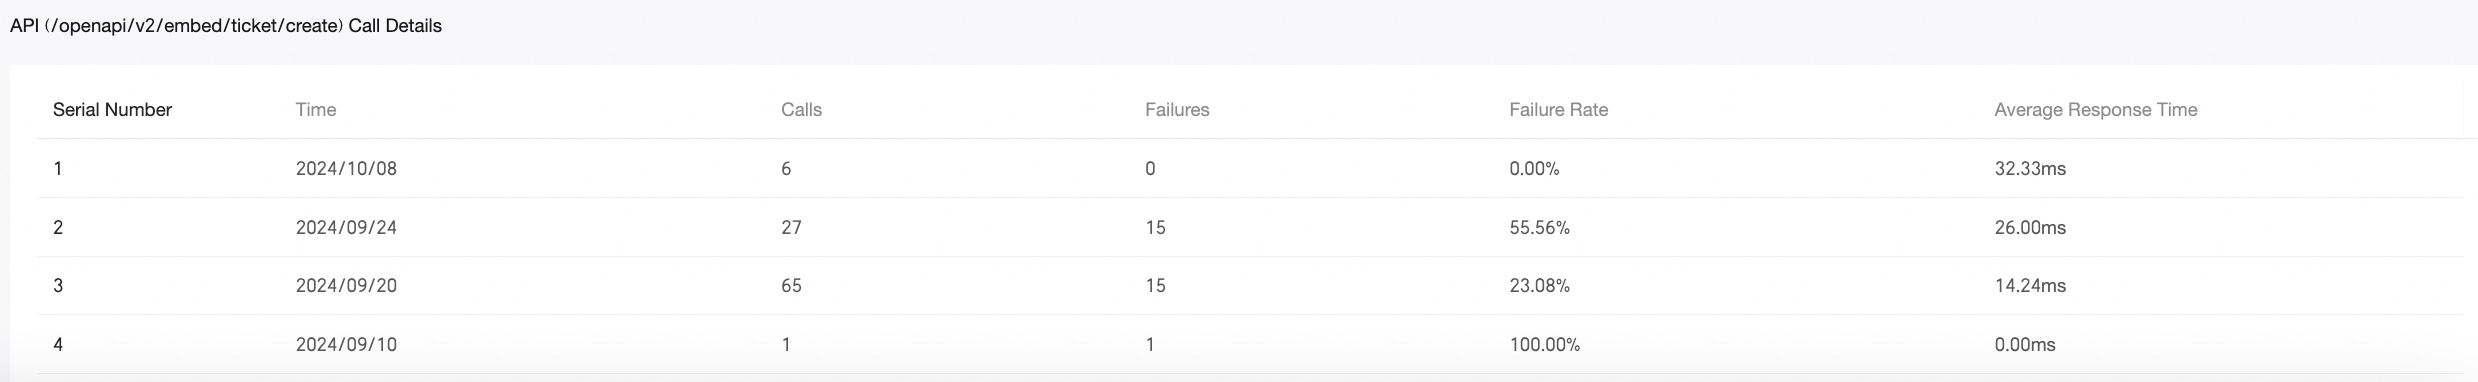
API call details
This section provides detailed call information for all APIs under the username. You can view specific API call data within a custom time frame and utilize fuzzy search to find API names.
To see more details, click Details within the API's information section.