You can use the host monitoring feature to collect metric data about CPUs, memory, disks, loads, network traffic, and network packets. This topic describes the host monitoring feature and shows you how to view host metrics.
Metrics
The host monitoring feature can be used to monitor the following metrics:
Item | Metric |
CPU |
|
Memory |
|
Disk |
|
Load | systemLoad |
Network traffic |
|
Network packet |
|
Procedure
Log on to the EDAS console.
In the left-side navigation pane, choose Application Management > Applications.
In the top navigation bar of the Applications page, select a region. From the Microservices Namespace drop-down list, select a microservices namespace. From the Cluster Type drop-down list, select ECS Clusters. Then, click the name of the application that you want to manage.
In the left-side navigation pane, choose .
On the Application Details page, select the node whose metrics you want to view and click the Host Monitoring tab.
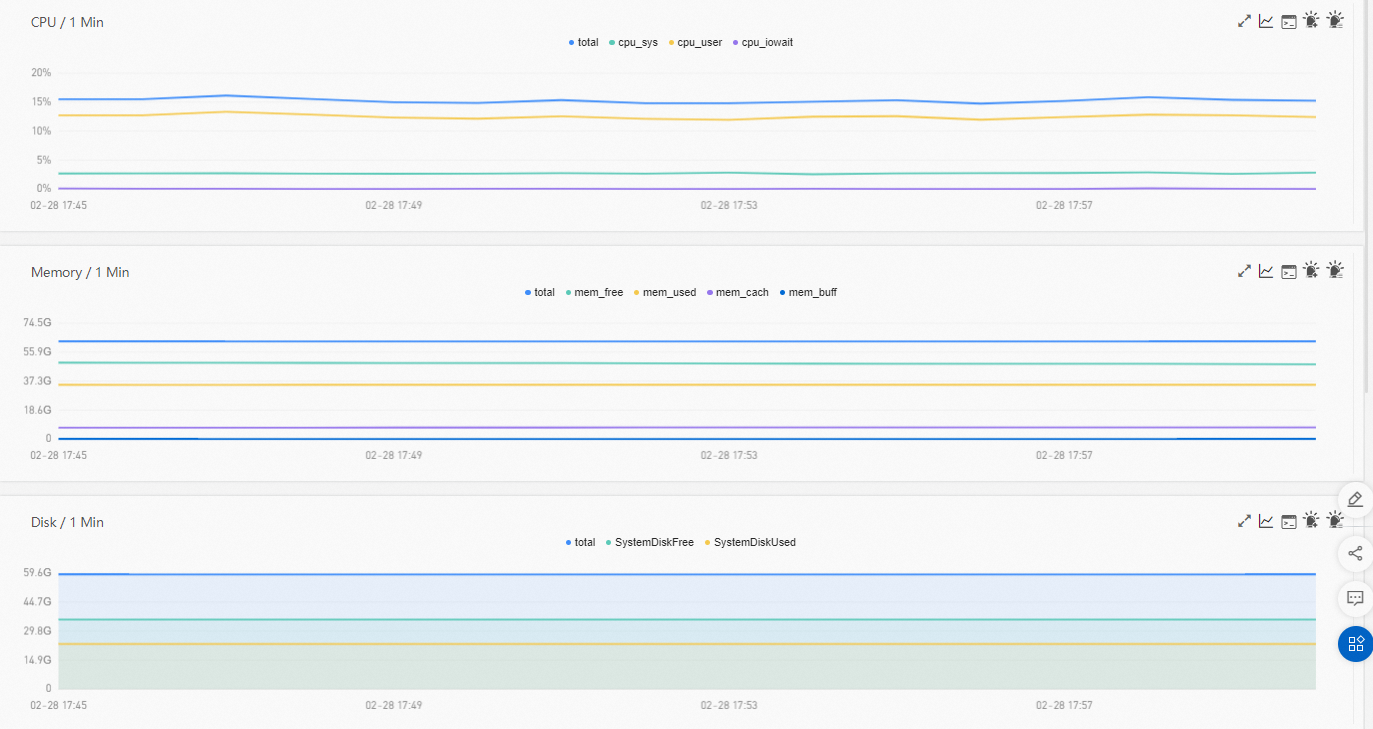
View host metrics
On the HOST Monitoring tab, you can view the time series curves in the CPU, Memory, Disk, Load, Network Traffic (Bytes), and Network Packets (Count) sections.
You can click the name of a metric such as cpu_sys on each monitoring panel to enable or disable the visibility of this metric.
NoteEach chart must contain at least one visible metric. If only one metric is displayed in a chart, you cannot hide the metric.
You can click the
 icon in the upper-right corner to view metrics by range or compare metrics.
 You can click the
 icon in the upper-right corner to view API details of a specific metric.