The host monitoring feature is used to monitor the host metrics, including the metrics related to the CPU, memory, disk, load, network traffic, and network packets. This topic describes the host monitoring feature and shows you how to view the host metrics.
Go to the HOST Monitoring tab
- Log on to the Enterprise Distributed Application Service (EDAS) console.
- In the left-side navigation pane, click Applications.
- On the Applications page, select a region in the top navigation bar and a microservice namespace from the Microservice Namespace drop-down list, and then click the name of the application that you want to manage.
- In the left-side navigation pane, choose .
- On the Application Details page,click the tab.
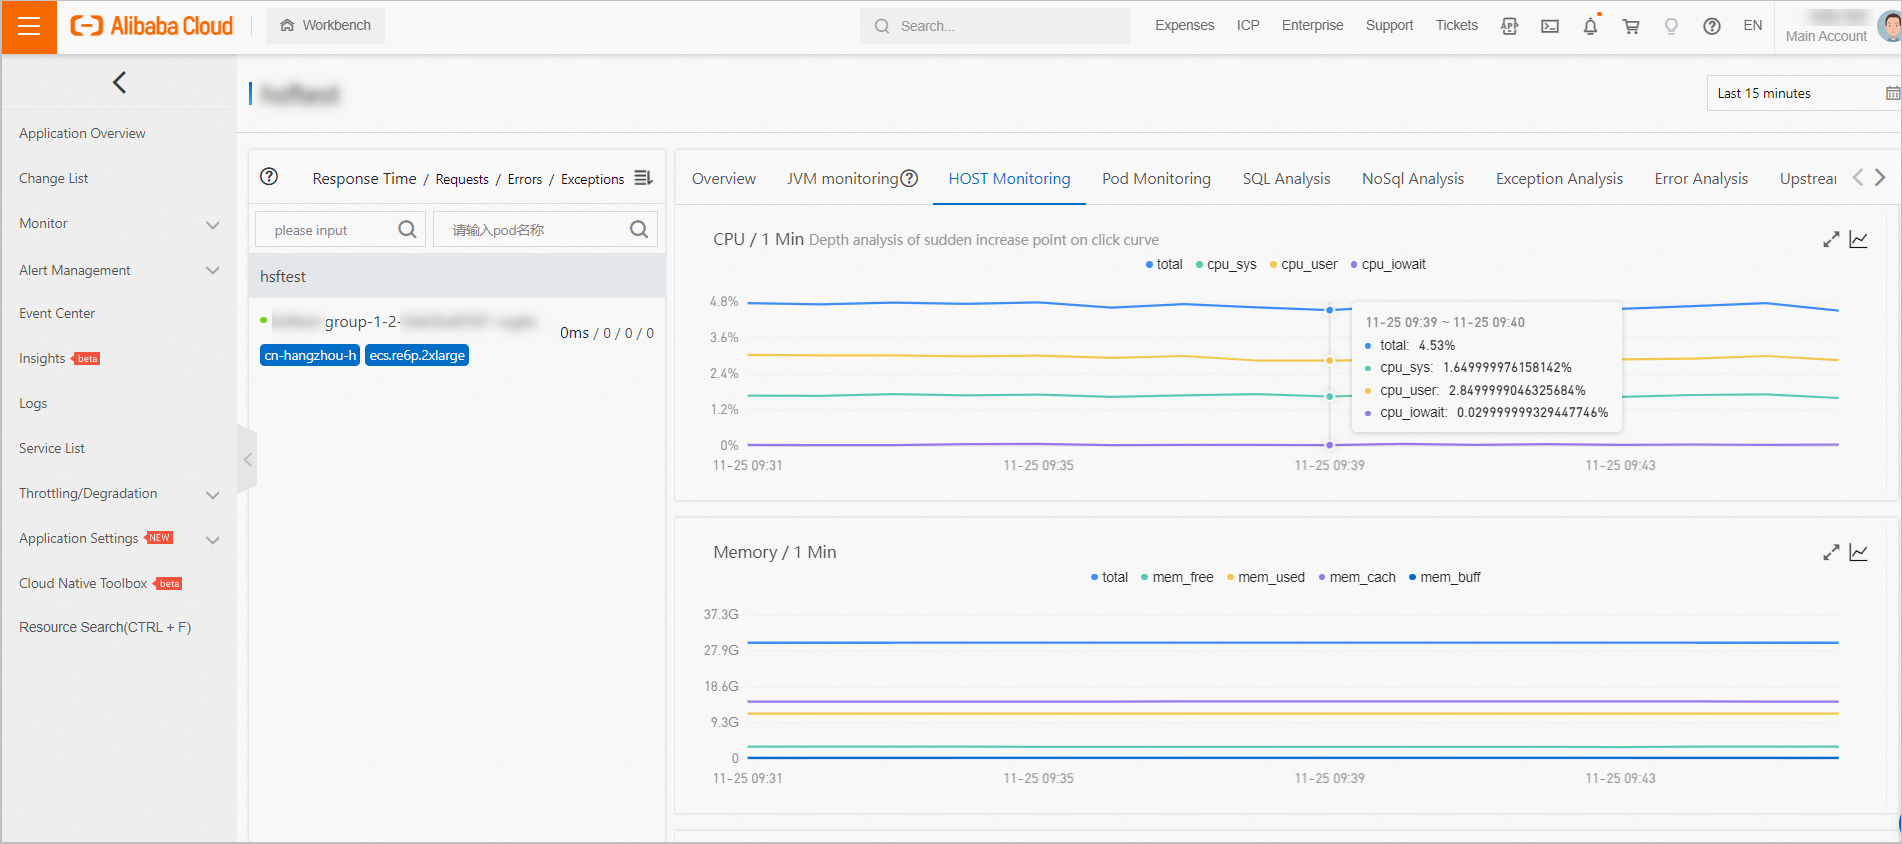
View the host metrics
On the HOST Monitoring tab, you can view the time series curves for metrics that are related to the CPU, memory, disk, load, network traffic, and network packets.
- You can click the name of a metric such as cpu_sys on a chart to show or hide the
metric.
Note Each chart must contain at least one visible metric. Therefore, if only one metric is displayed in a chart, you cannot hide this metric.
- You can click the line chart icon in the upper-right corner of a chart to view the metrics by time range or compare the metrics.
- You can click the View API icon in the upper-right corner of a chart to view the detailed information about the APIs that are related to the metrics.
- You can click the
 or
or  icon in the upper-right corner of a chart to view the existing alerts or create an
alert. For more information about how to create an alert, see Create an alert.
icon in the upper-right corner of a chart to view the existing alerts or create an
alert. For more information about how to create an alert, see Create an alert.
Metrics
The host monitoring feature can be used to monitor the following metrics:
- CPU
- Total CPU utilization
- System CPU utilization
- User CPU utilization
- CPU utilization for I/O wait
- Memory
- Total memory size
- Idle memory size
- Memory usage
- Memory size in the page cache
- Memory size in the buffer cache
- Disk
- Total system disk space (bytes)
- Idle system disk space (bytes)
- Used system disk space (bytes)
- Load
System load
- Network traffic
- Volume of received network traffic (bytes)
- Volume of sent network traffic (bytes)
- Network packets
- Number of received network packets per minute
- Number of sent network packets per minute
- Number of received network errors per minute
- Number of discarded network packets per minute