This topic describes how to set alert rules for an AnalyticDB for PostgreSQL instance in the CloudMonitor console.
Background information
Monitoring and alerting are implemented by using CloudMonitor. CloudMonitor enables you to set metrics and contacts. If the alert rules of a metric are triggered, CloudMonitor notifies all the contacts in the alert contact group. You can maintain alert contact groups so that relevant contacts can be promptly notified if an alert is triggered.
Procedure
- Log on to the CloudMonitor console.
- In the left-side navigation pane, click Event Monitoring. The Event Monitoring page appears.
- Click the Alarm Rules tab. In the upper-right corner of this tab, click Create Event Alert. In the Create/Modify Event Alert dialog box that appears, set parameters.
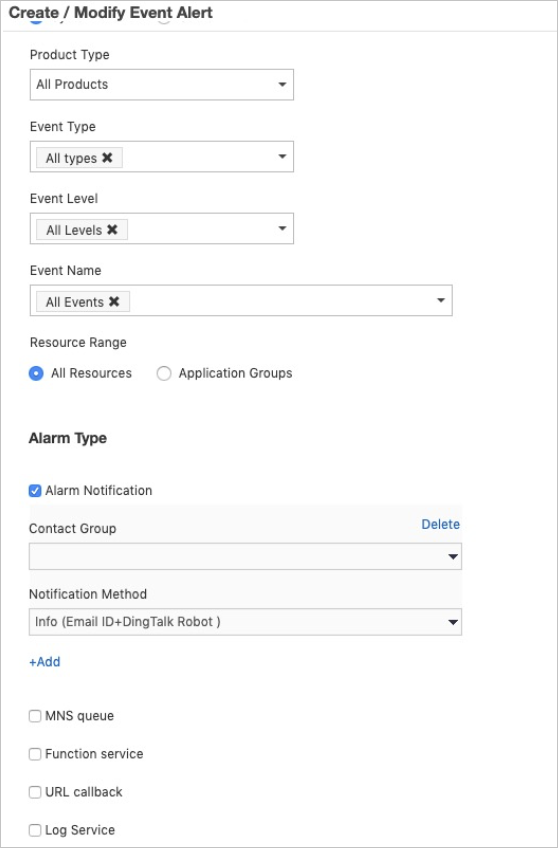
Table 1. Parameters for setting alert rules Parameter Description Alarm Rule Name The name of the alert rule you want to configure. The name can be up to 30 characters in length, and can contain letters, digits, and underscores (_). Event Type Select System Event. Product Type Select AnalyticDB for PostgreSQL. Event Type Select All types. Event Level Select All Levels. Event Name Select All Events or a specific event. Resource Range Select All Resources, which indicates that alert contacts are notified if any resource-related event occurs. N/A Select Alarm Notification. Contact Group The alert contact group. For more information, visit Create an alert contact and an alert contact group and Manage alarm contacts and alarm contact groups. Notification Method The notification method of alerts. Table 2. Events triggering alerts Event Description The CPU utilization of a compute group exceeds 90%. The memory usage of a compute group exceeds 85%. The disk usage of a compute group exceeds 80%. The instance is unavailable. The instance cannot be connected, or it processes all requests. No alerts are triggered when the instance is being restarted, created, or upgraded, or is deleted or locked. There are five or more long-running transactions. If a transaction is active for more than 2 hours but is not in the idle state and has a lock, it is defined as a long-running transaction. The CPU utilization of the coordinator node exceeds 90%. The memory usage of the coordinator node exceeds 85%. The proportion of connections with an instance exceeds 80%. - Click OK.
