This topic describes how to build a product recommendation model based on user and item features.
Prerequisites
A workspace is created. For more information, see Create and manage a workspace.
Background information
In this scenario, a pipeline trains a predictive model on e-commerce data from April and May. The pipeline then evaluates the model by using purchase data from June. Finally, you deploy the best-performing model as an Elastic Algorithm Service (EAS) online service.
The data used in this pipeline is anonymized e-commerce data and is for demonstration purposes only. Do not use it for commercial purposes.
The sample pipeline and related data are included in a preset template provided by Machine Learning Designer. You can drag the components in the template to create a recommendation model based on collaborative filtering. Then, you can deploy the model you train in Machine Learning Designer to EAS with a few clicks.
General workflow

Import the data into MaxCompute to generate structured, supervised data.
Perform Feature Engineering, including data preprocessing and feature derivation. Feature derivation enriches the dataset to better represent business patterns.
Split the data into two sets: one for training the binary classification model, and another for testing the model's performance with a prediction component.
Use an evaluation component to measure the model's performance.
Dataset
The sample pipeline uses a dataset from Tianchi Big Data Competition. The dataset contains the shopping data of an e-commerce platform from April to June. The following table describes the fields in the dataset.
Field | Short description | Type | Full description |
user_id | User ID | STRING | The ID of the user performing the action. |
item_id | Item ID | STRING | The ID of the item affected by the action. |
active_type | Shopping behavior | STRING |
|
active_date | Purchase date | STRING | The time when the action occurred. |
The following figure shows a sample of the raw data in the pipeline.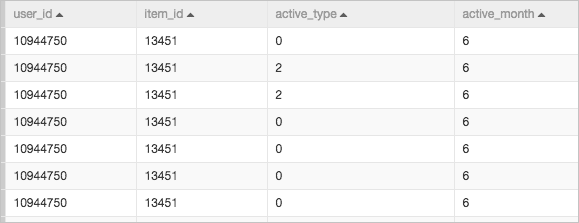
Procedure
Go to the Machine Learning Designer page.
Log on to the PAI console.
In the left-side navigation pane, click Workspaces. On the Workspaces page, click the name of the workspace that you want to manage.
In the left-side navigation pane, choose .
Create a pipeline.
On the Visualized Modeling (Designer) page, click the Preset Templates tab.
In the Preset Templates tab, find Recommendation Based on Object Characteristics and click Create.
In the Create Pipeline dialog box, configure the parameters. You can use their default values.
The value specified for the Data Storage parameter is the Object Storage Service (OSS) bucket path of the temporary data and models generated during the runtime of the pipeline.
Click OK.
It requires about 10 seconds to create the pipeline.
In the Pipelines tab, double-click Recommendation Based on Object Characteristics to open the pipeline.
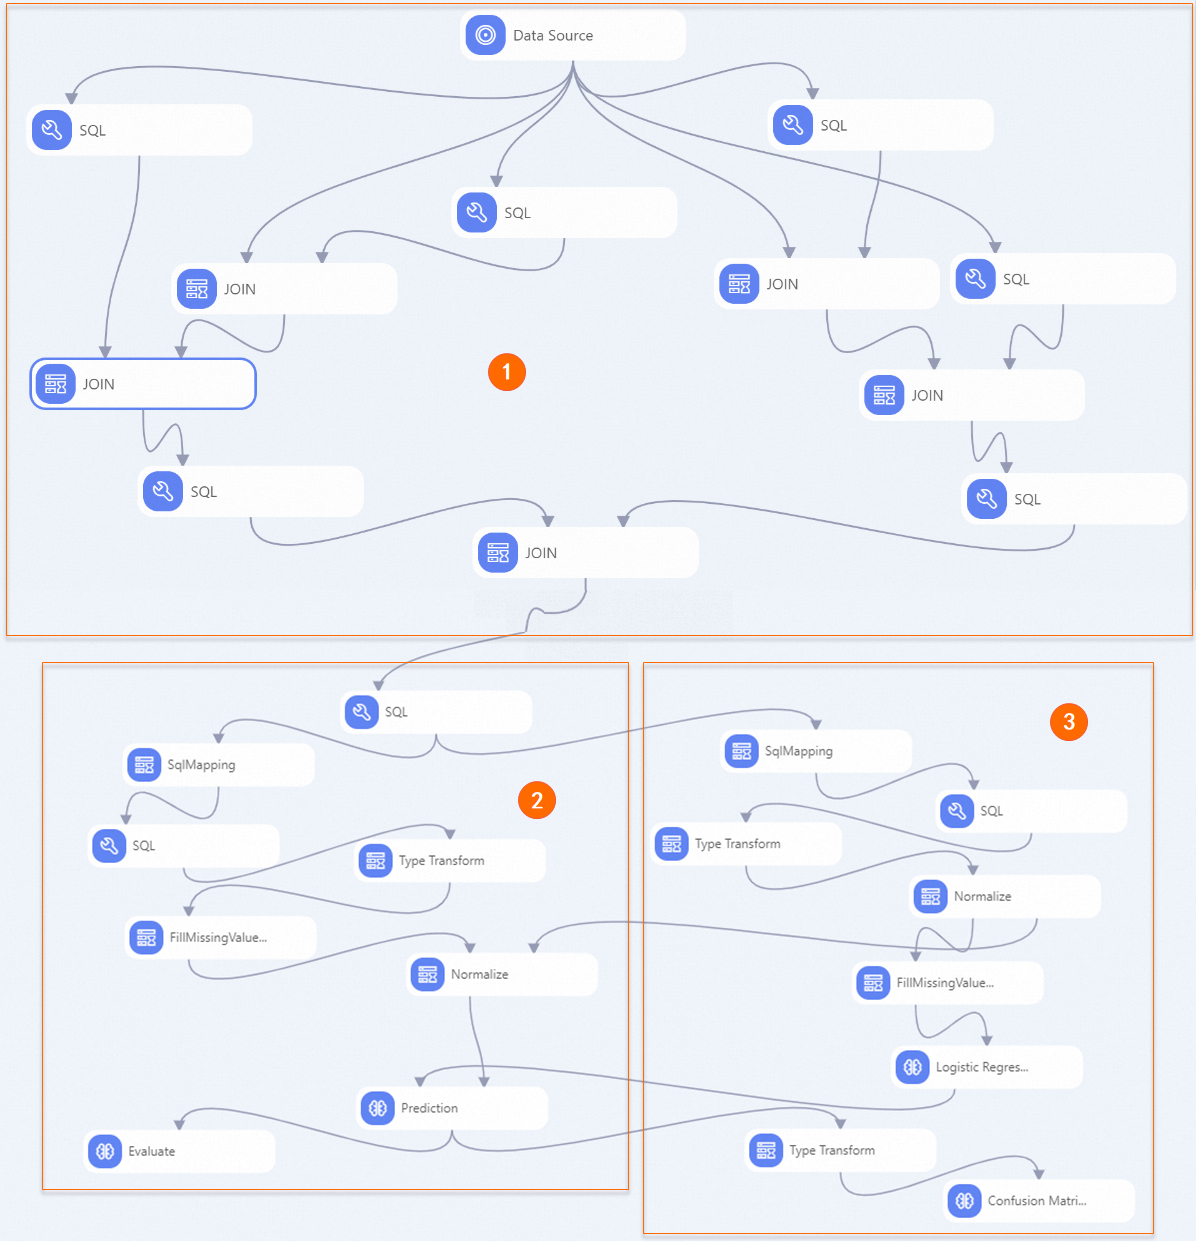
View the components of the pipeline on the canvas. The following figure shows the pipeline that is automatically created based on the preset template.
Section
Description
①
This section performs Feature Engineering. It expands the original four-field dataset by deriving new features for both users (the recommendation targets) and items (the recommended items):
For the user, the derived features include the total number of purchases, total clicks, and the click-to-purchase ratio (clicks divided by purchases), which indicates how decisive a user is.
For the item, the derived features include the total number of purchases, total clicks, and the purchase-to-click ratio (purchases divided by clicks).
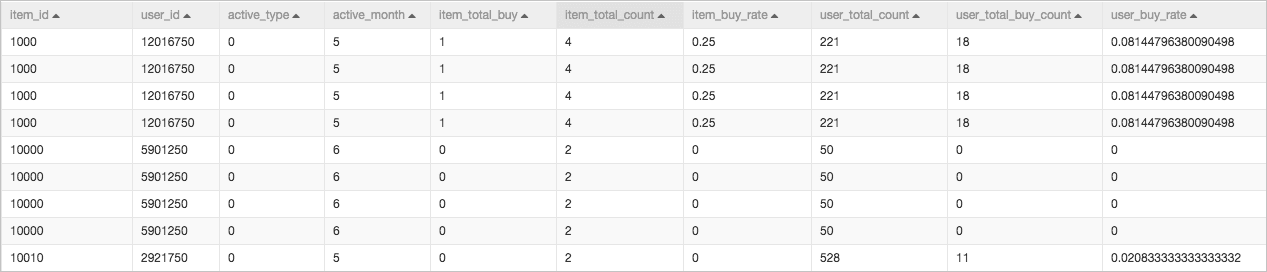
After feature engineering, the dataset expands from 4 to 10 fields, as shown in the following figure.
②
This experiment uses a logistic regression algorithm for model training.
You can click the Logistic Regression for Binary Classification component and, on the Fields Setting tab on the right, select the Whether To Generate PMML checkbox to generate a PMML model.
③
This section is for model evaluation. It assesses the model's quality using data that was not part of the training set. Recommendation scenarios are typically binary classification problems. You can use the Confusion Matrix and binary classification evaluation components to evaluate the prediction results.
Run the pipeline and view the prediction results.
In the upper-left corner of the canvas, click the Run icon.
After the pipeline completes running, right-click the Logistic Regression for Binary Classification component on the canvas and choose to export the trained model.
Right-click the Prediction component on the canvas and choose to view the prediction results of the model.
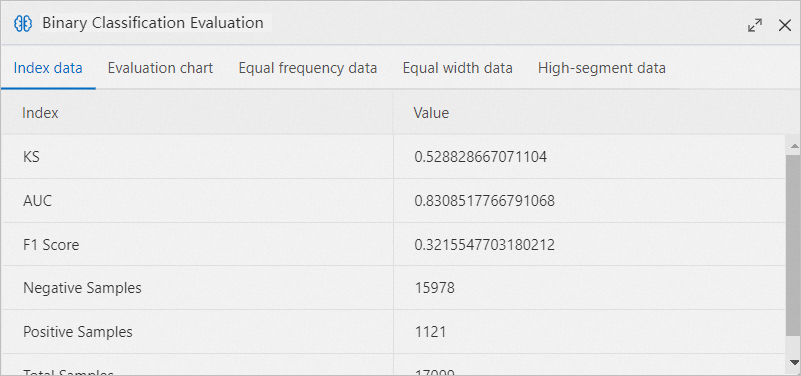
View the evaluation results of the model.
Right-click the Binary Classification Evaluation component on the canvas and select Visual Analysis.
In the Binary Classification Evaluation section, click the Evaluation chart tab to view the receiver operating characteristic (ROC) curve.
 The blue area represents the area under curve (AUC) value. A larger blue area indicates higher model quality.
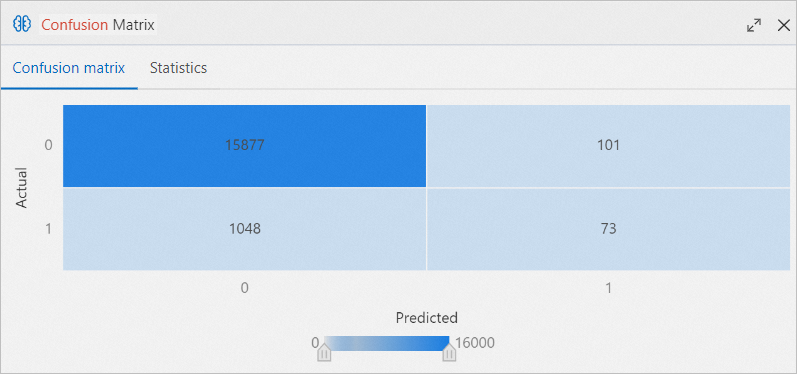
 Right-click the Confusion Matrix component on the canvas and select Visual Analysis.
In the Confusion Matrix section, click the Confusion matrix tab to view the evaluation results.
Deploy the model.
If the model performance meets your expectations, you can deploy it as an online service. To deploy the model, click Models at the top of the canvas. For more information, see Deploy a model as an online service.