You can monitor a Go application by adding instrumentation to expose its data. Then, you can use Managed Service for Prometheus to scrape the data, display it on a Grafana dashboard, and create alerts. This topic uses a Container Service for Kubernetes (ACK) cluster and Container Registry as examples to demonstrate this process.
Prerequisites
An ACK cluster is connected to Managed Service for Prometheus. For more information, see Create a Prometheus instance to monitor an ACK cluster.
An image repository is created in Container Registry. For more information, see Step 2: Create an image repository.
Demo
To quickly try out monitoring a Go application with Managed Service for Prometheus, you can use the instrumented demo project.
Procedure
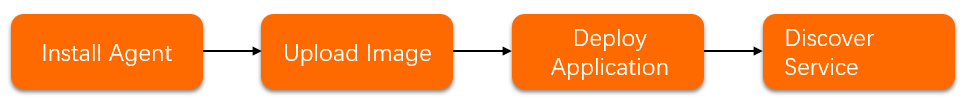
The following figure shows the workflow for monitoring a Go application using Managed Service for Prometheus.
Step 1: Add instrumentation to the application
You can add instrumentation to your application to expose its data.
Import the monitoring package into the Go application.
import (
    "fmt"
    "github.com/prometheus/client_golang/prometheus/promhttp"
    "net/http"
    "strconv"
)
Bind the monitoring endpoint to promhttp.Handler().
http.Handle(path, promhttp.Handler()) // Initialize an HTTP handler.
Step 2: Upload the application
Build an image for the instrumented application and upload it to a Container Registry repository.
Run the following command to recompile the module.
go buildRun the following command to build the image.
docker build -t <local_temp_docker_image_name>:<local_temp_docker_image_version> . --no-cacheExample command:
docker build -t prometheus-go-demo:v0 . --no-cacheRun the following command to tag the image.
sudo docker tag <local_temp_docker_image_name>:<local_temp_docker_image_version> <registry_domain_name>/<namespace>/<image_name>:<image_version>Example command:
sudo docker tag prometheus-go-demo:v0 registry.cn-hangzhou.aliyuncs.com/testnamespace/prometheus-go-demo:v0Run the following command to push the image to the image repository.
sudo docker push <registry_domain_name>/<namespace>/<image_name>:<image_version>Example command:
sudo docker push registry.cn-hangzhou.aliyuncs.com/testnamespace/prometheus-go-demo:v0The uploaded application image is displayed on the Image Version page in the Container Registry console.

Step 3: Deploy the application
Deploy the application to the Container Service for Kubernetes cluster.
Log on to the ACK console. In the left navigation pane, click Clusters.
On the Clusters page, find the cluster you want to manage and click its name. In the left navigation pane, choose .
Create a container group.
On the Deployments page, click Create from YAML.
On the Create from YAML page, enter the following content in the Templates code editor and click Create.
apiVersion: apps/v1 # for versions before 1.8.0 use apps/v1beta1
kind: Deployment
metadata:
  name: prometheus-go-demo
  labels:
    app: go-exporter
spec:
  replicas: 2
  selector:
    matchLabels:
      app: go-exporter
  template:
    metadata:
      labels:
        app: go-exporter
    spec:
      containers:
      - name: prometheus-go-demo
        imagePullPolicy: Always
        image: <registry_domain_name>/<namespace>/<image_name>:<image_version>
        ports:
        - containerPort: 8077
          name: arms-go-demo
Sample code:
apiVersion: apps/v1 # for versions before 1.8.0 use apps/v1beta1
kind: Deployment
metadata:
  name: prometheus-go-demo
  labels:
    app: go-exporter
spec:
  replicas: 2
  selector:
    matchLabels:
      app: go-exporter
  template:
    metadata:
      labels:
        app: go-exporter
    spec:
      containers:
      - name: prometheus-go-demo
        imagePullPolicy: Always
        image: registry.cn-hangzhou.aliyuncs.com/fuling/prometheus-go-demo:v0
        ports:
        - containerPort: 8077
          name: arms-go-demo
The deployment appears on the Deployments page.

Create a service.
In the left navigation pane, choose .
On the Services page, click Create from YAML.
On the Create page, enter the following content in the Templates code editor and click Create.
apiVersion: v1
kind: Service
metadata:
  labels:
    app: prometheus-go-demo
  name: prometheus-go-demo
spec:
  ports:
  - name: arms-go-demo
    port: 8077
    protocol: TCP
    targetPort: 8077
  type: NodePort
  selector:
    app: prometheus-go-demo
The created service is added to the Services page.

Step 4: Configure service discovery
You can configure service discovery for Managed Service for Prometheus to scrape data from the Go application.
Log on to the Managed Service for Prometheus console. In the left-side navigation pane, click Integration Management.
On the Integrated Environments tab, view the environment list on the Container Service tab. Find the ACK instance and click Metric Scraping in the Actions column.
On the Metric Scraping tab, click Service Monitor and then click Create.
In the Add ServiceMonitor Configuration panel, click YAML, enter the following configuration, and click Create.
apiVersion: monitoring.coreos.com/v1
kind: ServiceMonitor
metadata:
  # Enter a unique name.
  name: prometheus-go-demo
  # Enter the target namespace.
  namespace: default
spec:
  endpoints:
  - interval: 30s
    # Enter the value of the Name field for the port that corresponds to the Prometheus exporter.
    port: arms-go-demo
    # Enter the value of the Path that corresponds to the Prometheus exporter.
    path: /metrics
  namespaceSelector:
    any: true
    # Namespace of the demo.
  selector:
    matchLabels:
      app: prometheus-go-demo
Step 5: Configure the dashboard
This section uses Grafana 9.0.x as an example.
Log on to the Managed Service for Grafana console. In the left-side navigation pane, click Workspace Management.
On the Workspace Management page, find the workspace that you want to manage and click the URL in the URL column to go to Grafana.
NoteYou can log on to Grafana with the administrator account of Grafana and the password that you configured when you created the workspace. You can also click Sign in with Alibaba Cloud to log on to Grafana with the current Alibaba Cloud account.
In the left navigation pane, choose
 > + Import.
On the Import page, enter the Prometheus Go application dashboard template ID 6671 into the Import via grafana.com text box and click Load.
On the Import page, enter the following information and click Import.
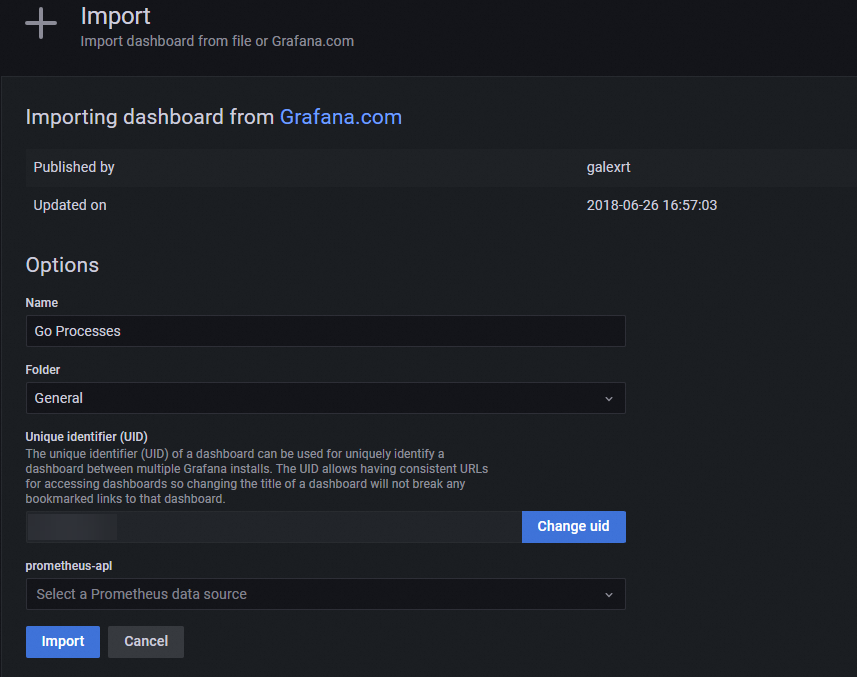
Enter a custom name for the dashboard in the Name text box.
From the Folder list, select your Container Service for Kubernetes cluster.
From the prometheus-apl drop-down list, select your Container Service for Kubernetes cluster.
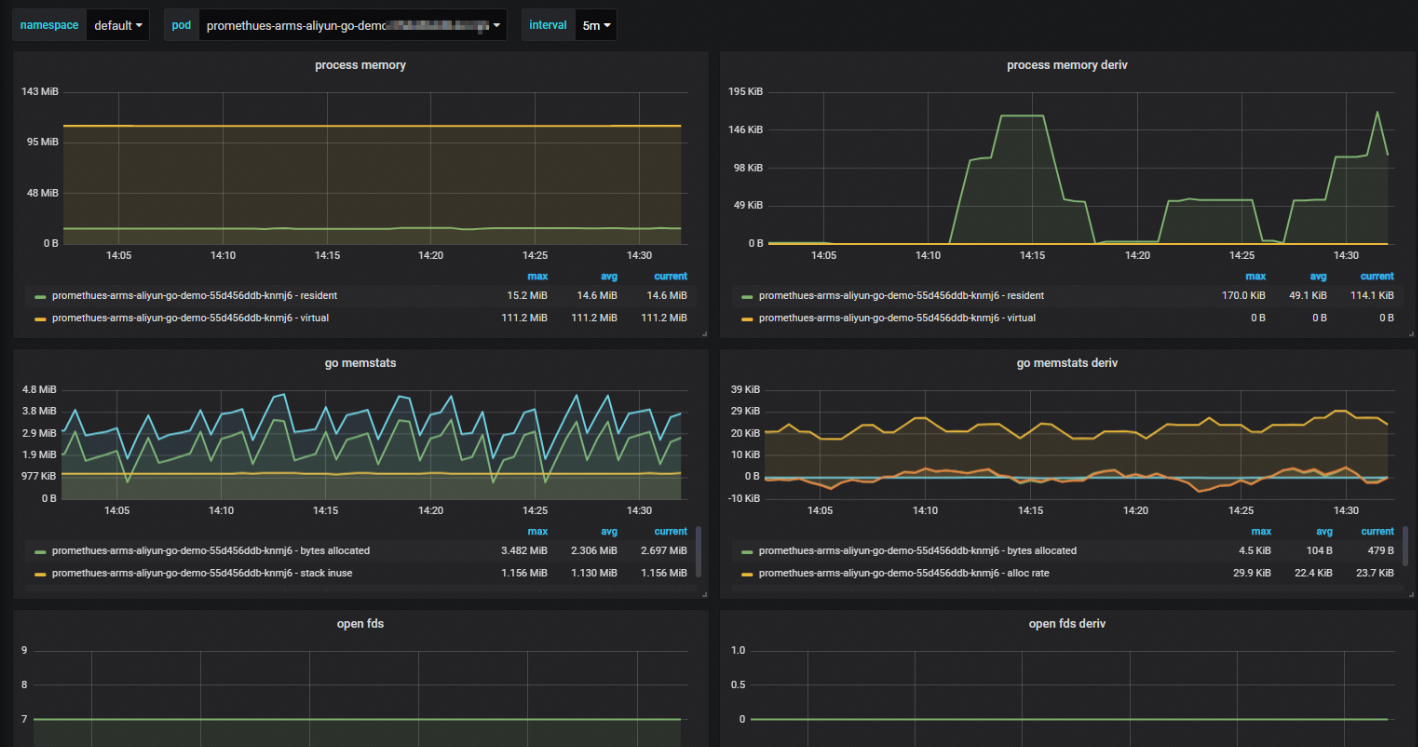
The following figure shows the configured Grafana dashboard.
Step 6: Create an alert
For more information, see Create a Prometheus alert rule.