In this example, the column chart component is used to control the data update of the carousel list component.
Procedure
- Log on to the DataV console.
Select a visualization application and click Edit to go to the Canvas Editor page.
Add the Column Chart widget and the List carousel widget to the canvas.
Click the carousel list widget. In the left-side pane, click the configuration tab. On the page that appears, set Global> Table Rows to 2. Turn on Hide Rows with Empty Values to change the Column Field Name and Column Display Name of the custom column label.
NoteColumn field name-Column display name: name-Name.
Column field name-Column display name: value-Metric.
Column field name-Column display name: city-city.
Click the column chart widget and select Data Panel to modify the static data.
[
  {
    "x": "Shanghai",
    "y": 100,
    "colorField": 100
  },
  {
    "x": "Shenzhen",
    "y": 75,
    "colorField": 200
  },
  {
    "x": "Hefei",
    "y": 30,
    "colorField": 300
  },
  {
    "x": "Chengdu",
    "y": 65,
    "colorField": 400
  },
  {
    "x": "Anhui",
    "y": 50,
    "colorField": 500
  },
  {
    "x": "Beijing",
    "y": 70,
    "colorField": 600
  }
]
Select all components and right-click them to export them to Blueprint Editor.
In the Logical Nodes section, select Global Node and add it to the canvas. Change the processing method to Set carousel data.
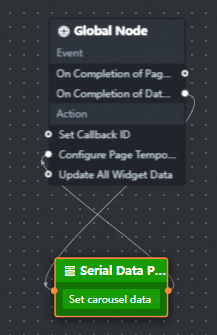
Configure the processing method of the Serial Data Processing node.
return {
  data: [{
    name: "carouselData",
    value: [
      {
        "name": "Shanghai project 1",
        "value": 111,
        "type": "Shanghai"
      },
      {
        "name": "Shanghai project 2",
        "value": 222,
        "type": "Shanghai"
      },
      {
        "name": "Shenzhen project 1",
        "value": 111,
        "type": "Shenzhen"
      },
      {
        "name": "Shenzhen project 2",
        "value": 222,
        "type": "Shenzhen"
      },
      {
        "name": "Hefei project 1",
        "value": 111,
        "type": "Hefei"
      },
      {
        "name": "Hefei project 2",
        "value": 222,
        "type": "Hefei"
      },
      {
        "name": "Chengdu project 1",
        "value": 111,
        "type": "Chengdu"
      },
      {
        "name": "Chengdu project 2",
        "value": 222,
        "type": "Chengdu"
      },
      {
        "name": "Anhui project 1",
        "value": 111,
        "type": "Anhui"
      },
      {
        "name": "Anhui project 2",
        "value": 222,
        "type": "Anhui"
      },
      {
        "name": "Beijing project 1",
        "value": 111,
        "type": "Beijing"
      },
      {
        "name": "Beijing project 2",
        "value": 222,
        "type": "Beijing"
      }
    ]
  }]
}
Add a column chart widget and a carousel widget to the blueprint canvas. Change the processing method to data filtering.

Configure the processing method of the Serial Data Processing node.
const allData = getLocalValue("carouselData");
return allData ? allData.filter(d => {
  return d.type == data.x;
}) : [];
Click the
 icon in the upper-right corner to preview the results.