This topic describes how to use a compound query control. It uses nested OR and AND relationships to implement compound query of charts in the same dataset.
Prerequisites
The dashboard edit page is displayed.
Scenarios
It is used to query multiple nested conditions, such as the sales volume of a product type in a region.
Procedure
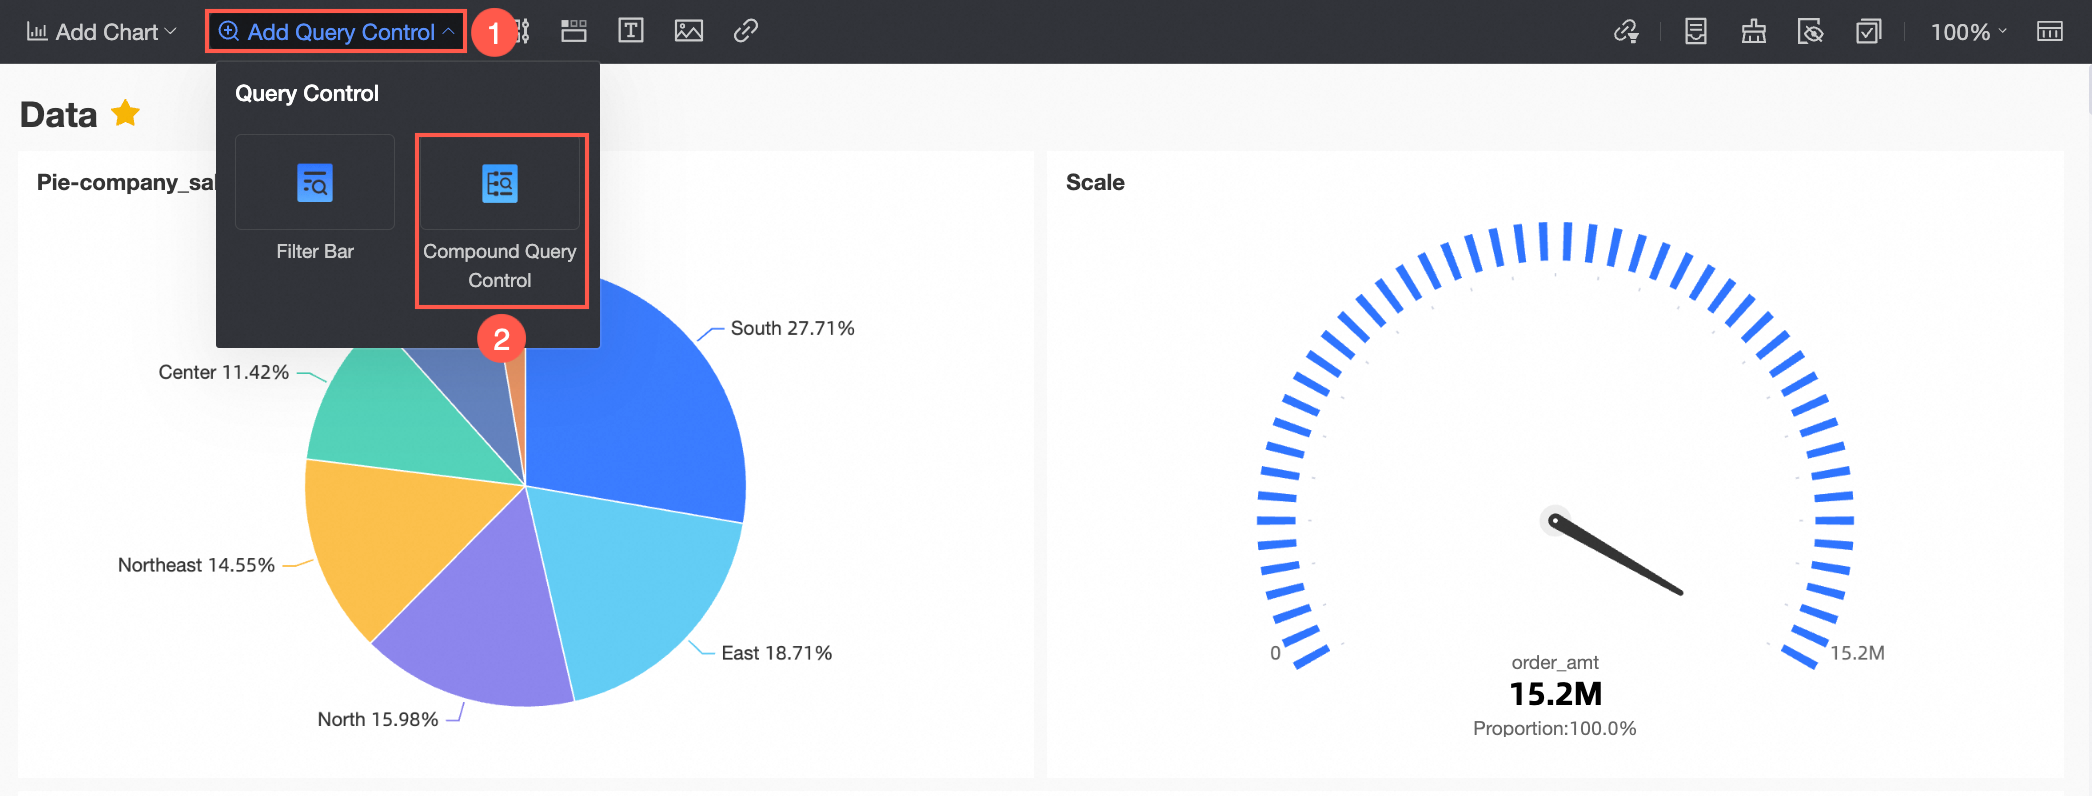
In the left-side navigation pane, click Add Query Control and select Composite Query Control.
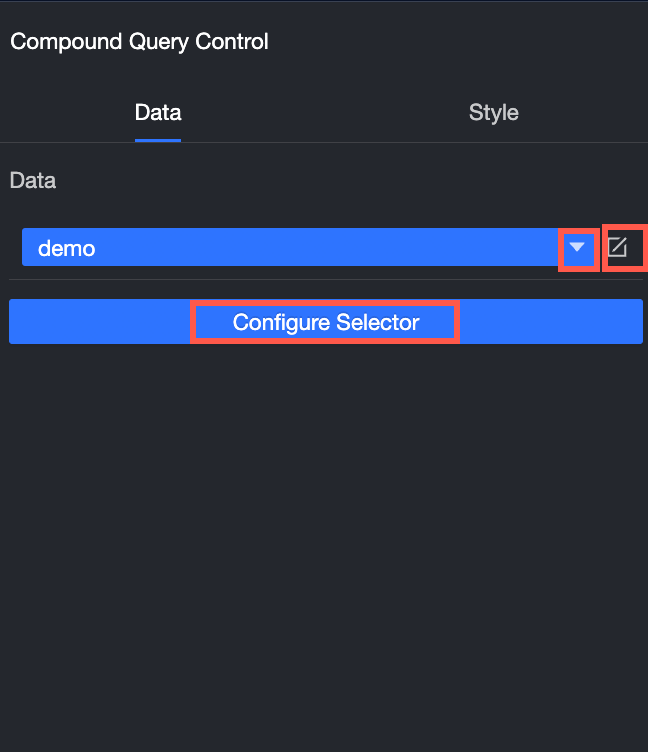
On the Data tab of the Compound Query Control page, click the following tab:
Select a dataset from the Data drop-down list.
Click the
 icon to go to the dataset editing page, where you can edit dimensions and measures.
Click Configure Selector and add fields for query.
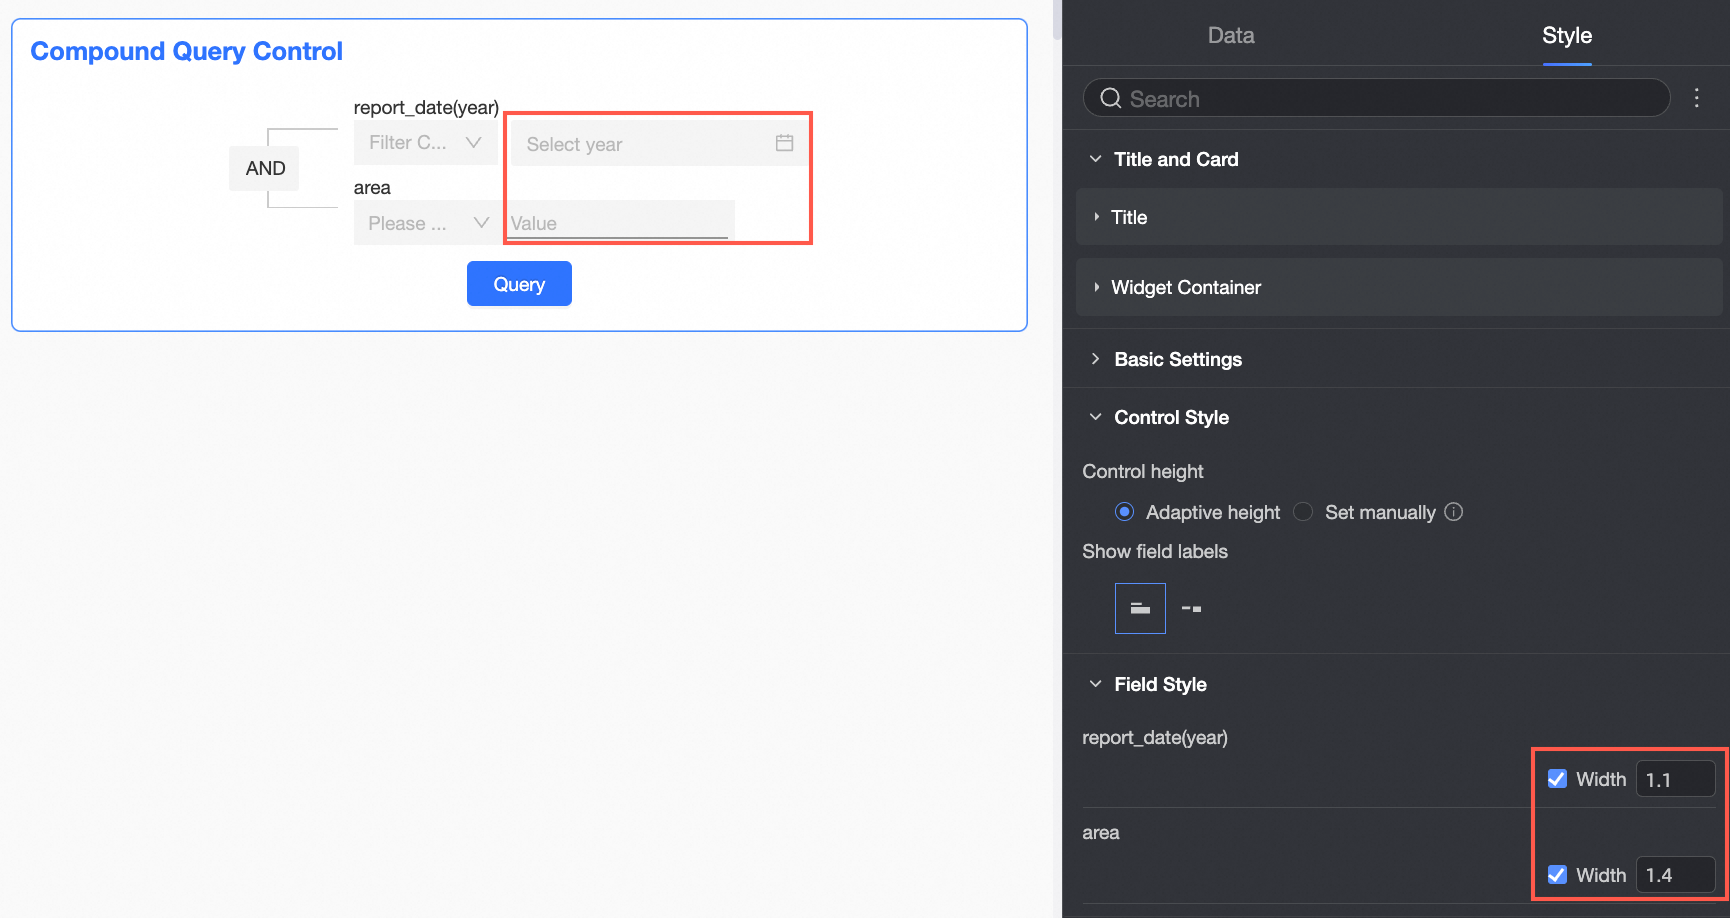
On the Style tab, you can perform the following configuration:
Option
Description
Title and Card
You can set the Title and Content of the widget.
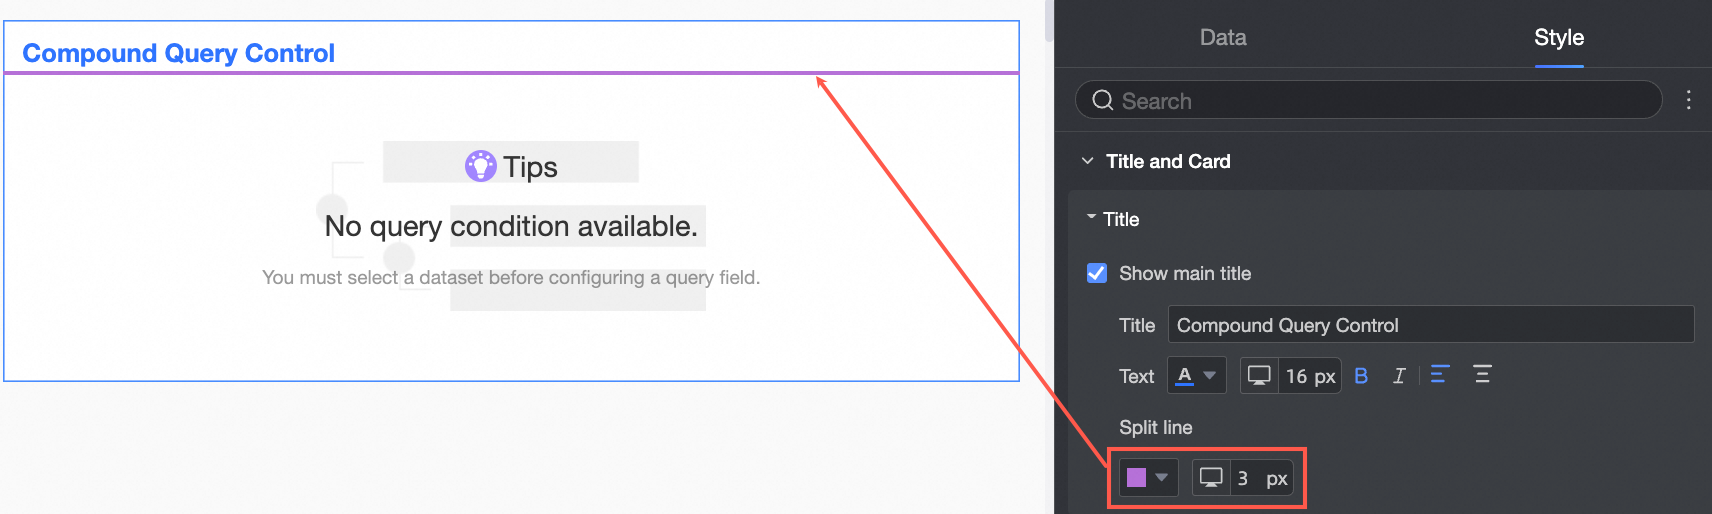
Title
In the title, set whether the control shows the title and title style.
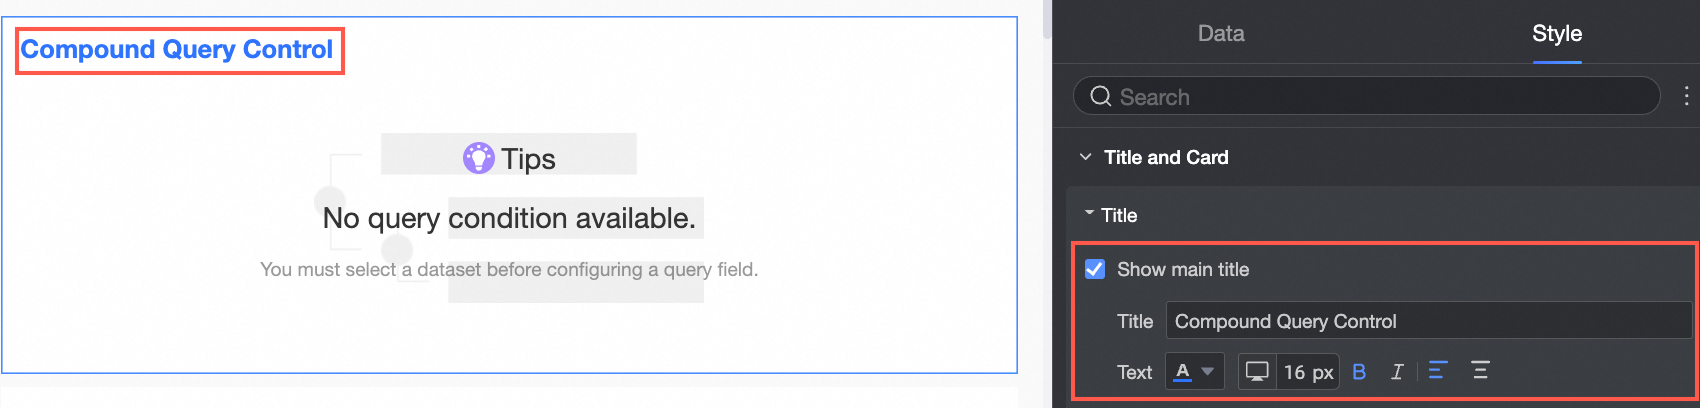
Support setting line separator.
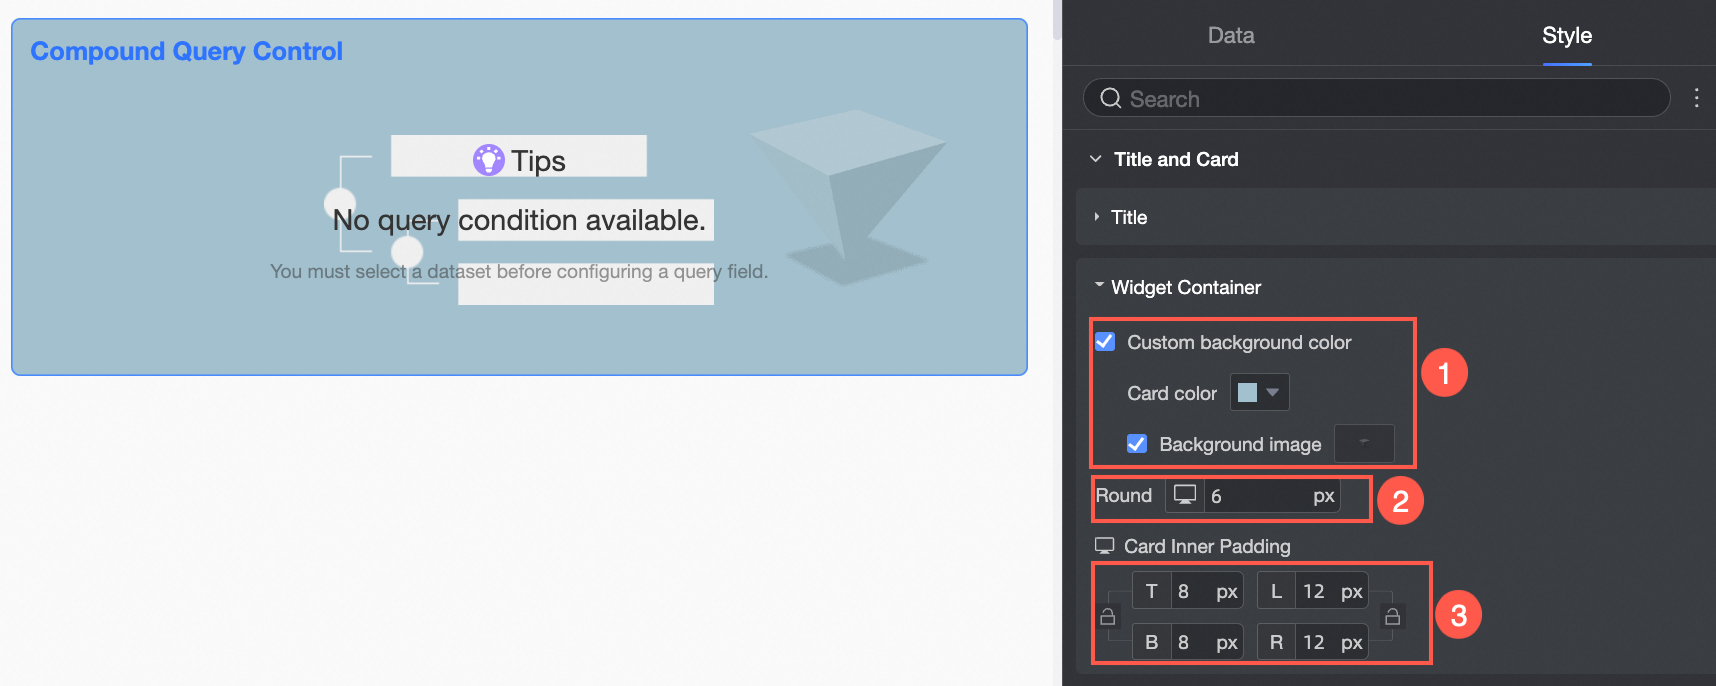
Component container
You can set Custom Background Fill (①), Fillet (②), and Inner Spacing (③).
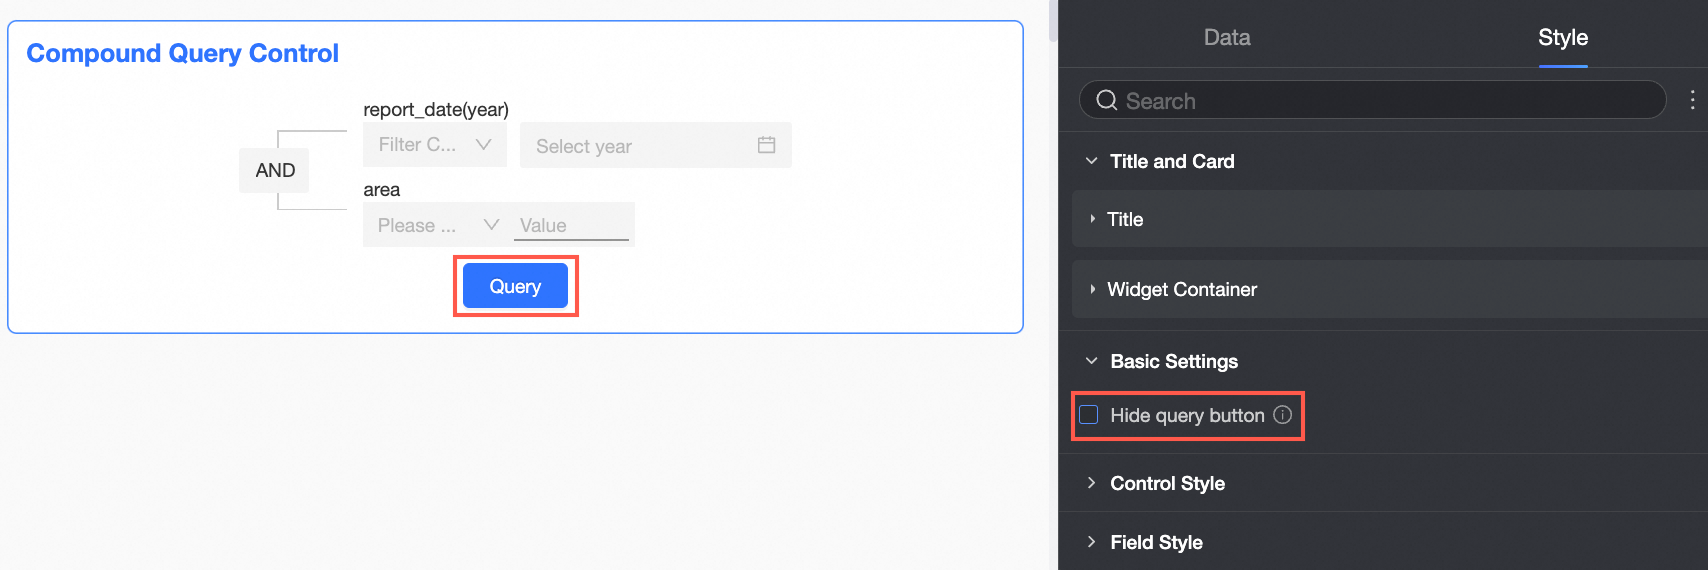
Basic Settings
You can specify whether to hide the Search button. After you enable this feature, filtering is performed every time you perform an operation.
Control Style
You can set the height of the control and the display mode of the field label.
Field Style
You can set the display width of the field.
Click Configure Selector. In the Configure Selector dialog box that appears, select charts for filter interaction.
NoteCompound Query Control supports only filter interaction of charts from the same dataset. The widget does not support cascade filtering.
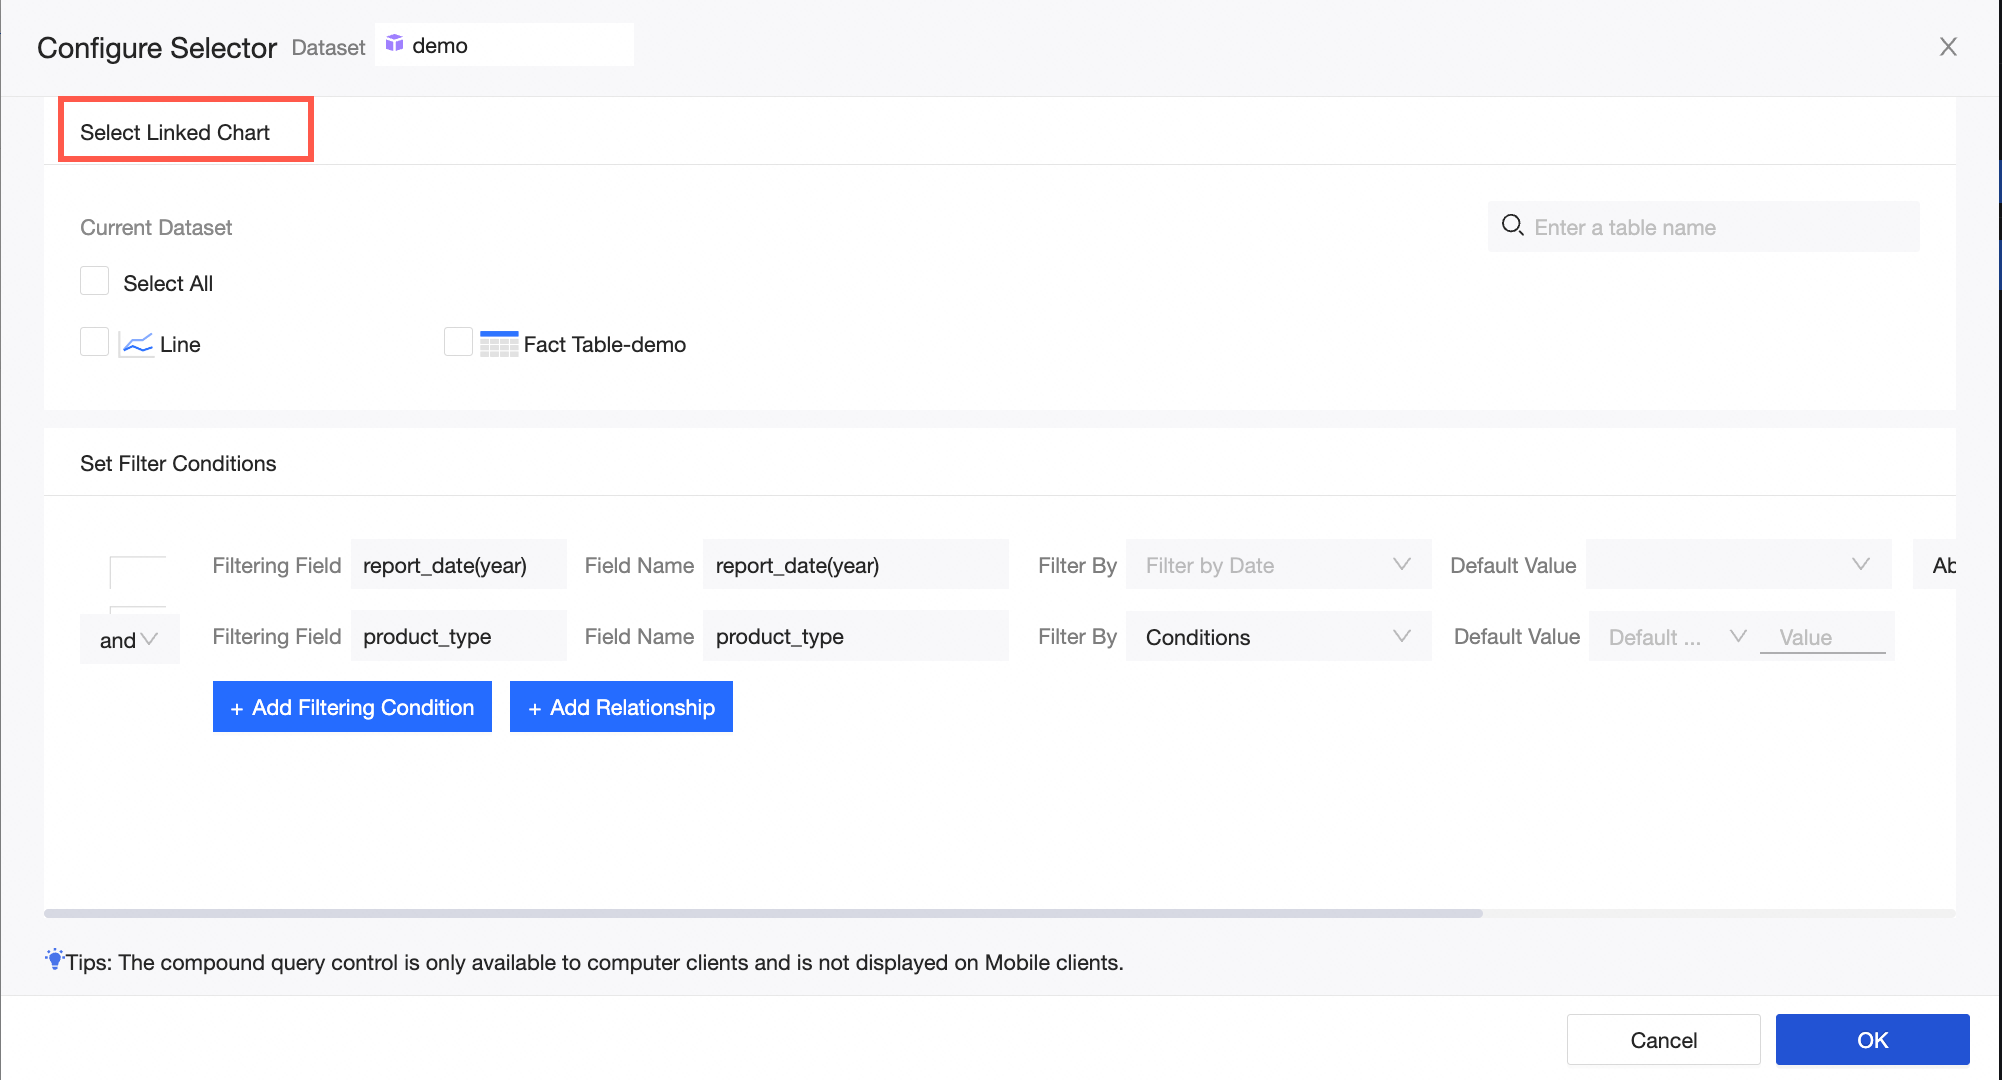
In the Configure Selector dialog box, select filter fields.
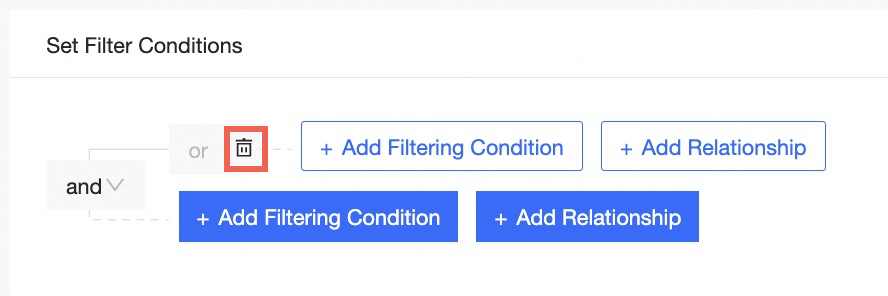
Click Add Filtering Condition to add a filter condition under the current layer.
Search for or select a field from the Filtering Field drop-down list, change Field Name, specify Filter By, and set Default Value.
If you want to delete a filter condition, click the Delete icon next to the filter condition.
Click Add Relationship to add a relationship node in the current layer.
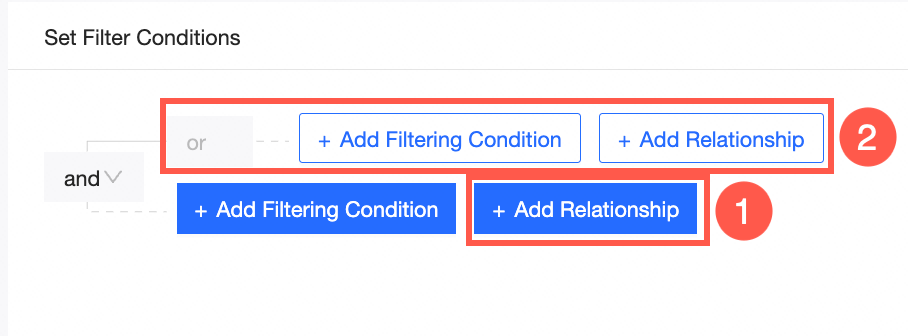
Click the outer-layer relationship node and select a relationship type as required.
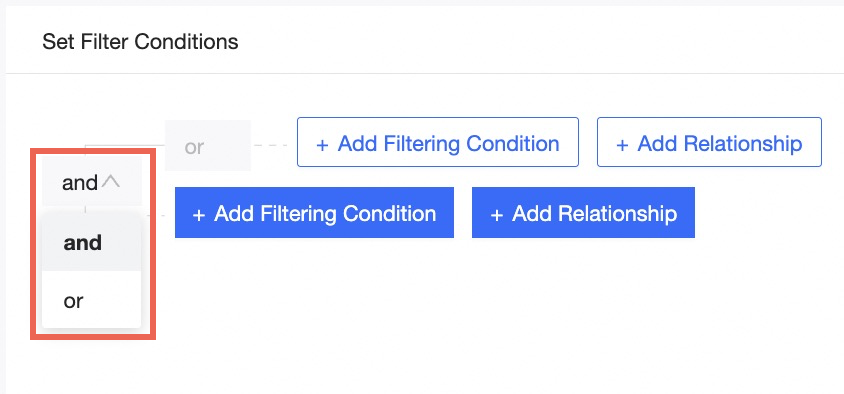
If the outer-layer relationship is And, the default inner-layer relationship is Or. If the outer-layer relationship is Or, the default inner-layer relationship is And. The relationship types of adjacent layers are opposite. They can be And-Or, Or-And, And-Or-And, or Or-And-Or.
Click the Delete icon next to a node to delete all filter fields and relationships under the node.
 Note
NoteYou can add a maximum of three relationships for each node.
Click OK to complete the configuration of the Compound Query Control widget.
Example
Text query
Text data can be filtered in three methods: Enum - Single Choice, Enum - Multiple Choice, and Conditions.
Click the Compound Query Control icon. On the Data tab, select a dataset.
Click Configure Selector. In the Configure Selector dialog box that appears, select charts for filter interaction.
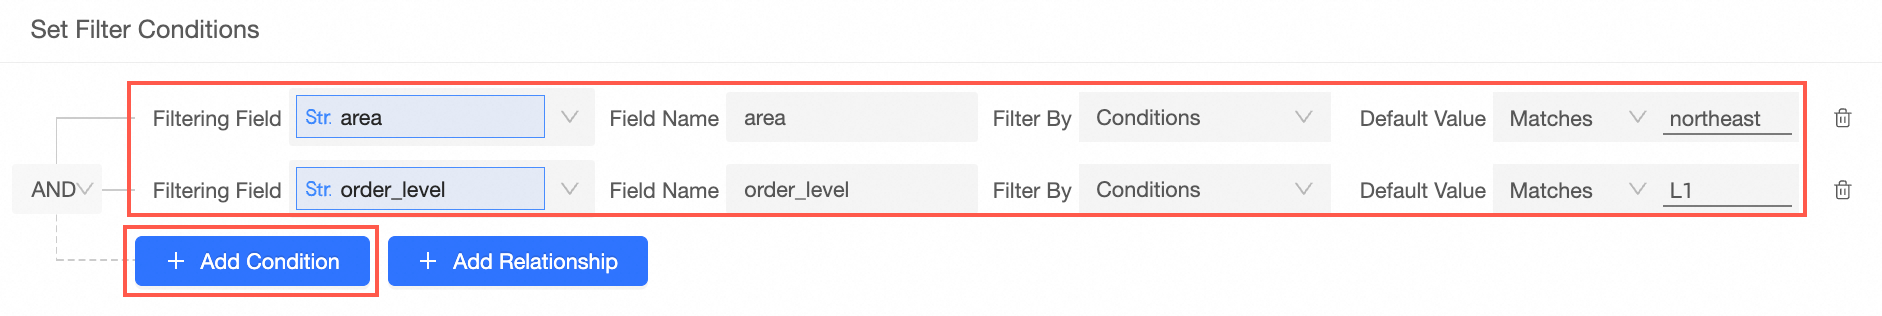
In the Set Filter Conditions section, set filter conditions.
Click Add Condition. Select Region as the filter field, Region as the field name, Enumeration-Single Choice as the filter method, and Northeast as the default value.
Click Add Condition. Set Filter Field to Order Level, Field Name to Order Level by default, Filter by Condition by default, and Exact Match, Advanced by default.
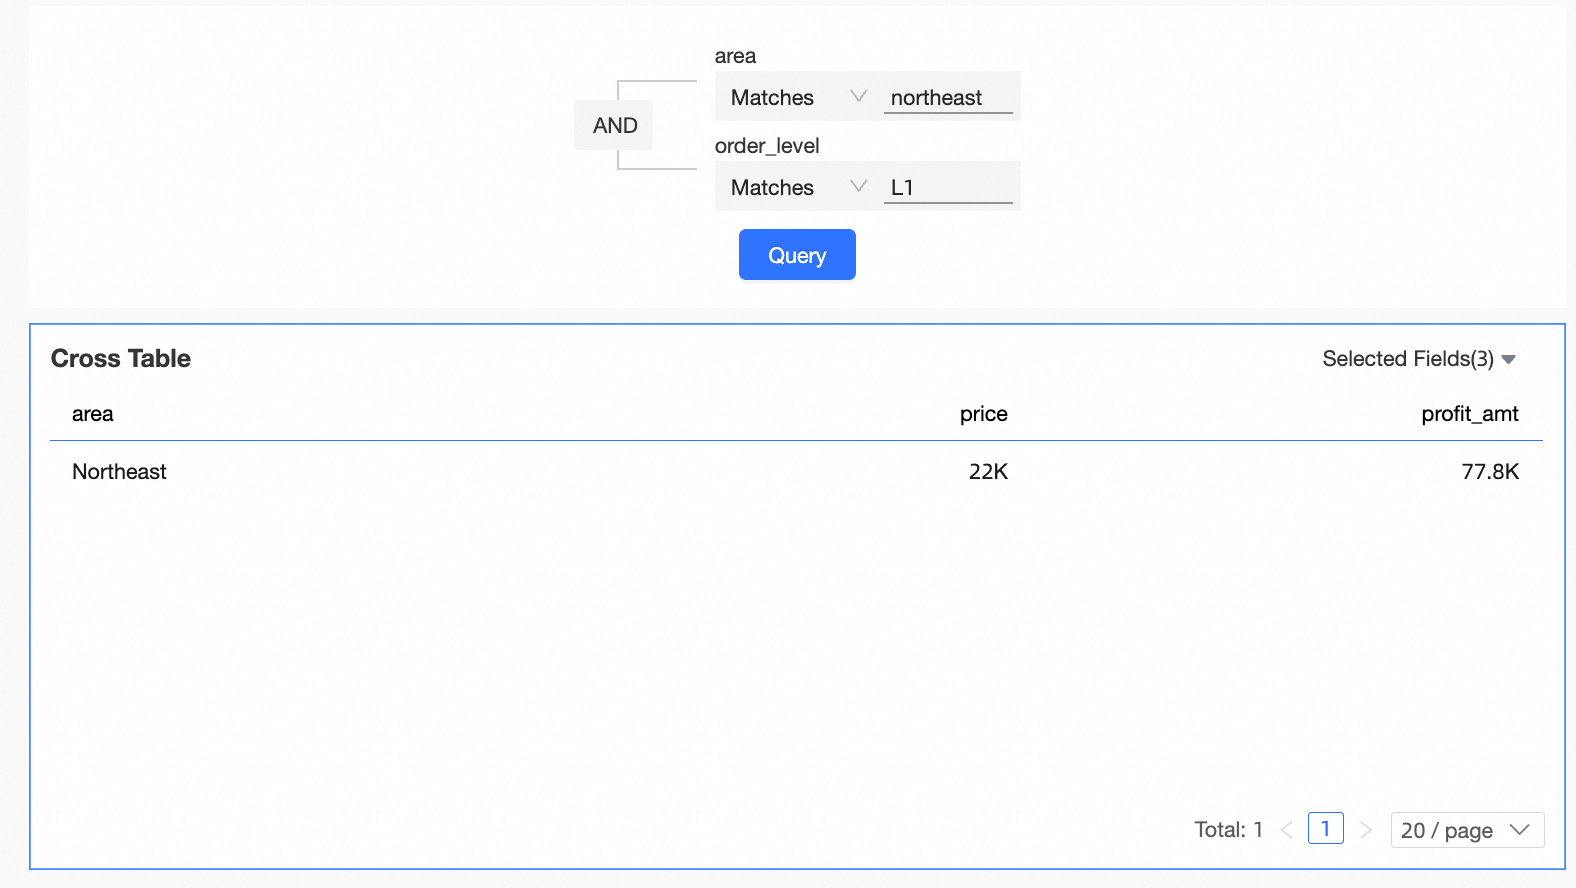
Click OK.
Click Query in the display area of the Compound Query Control widget. All the charts filtered by the widget are updated.
Value query
Click the Compound Query Control icon. On the Data tab, select a dataset.
Click Configure Selector. In the Configure Selector dialog box that appears, select charts for filter interaction.
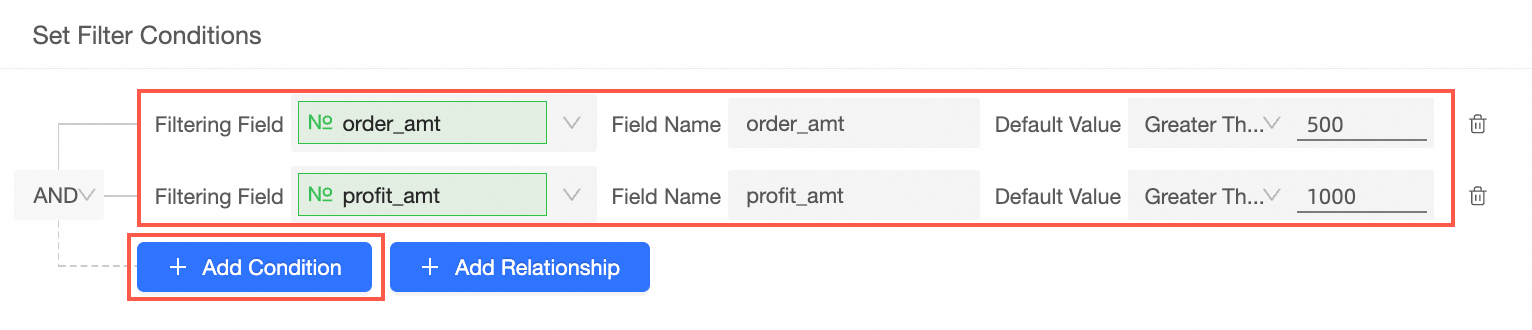
In the Set Filter Conditions section, set filter conditions.
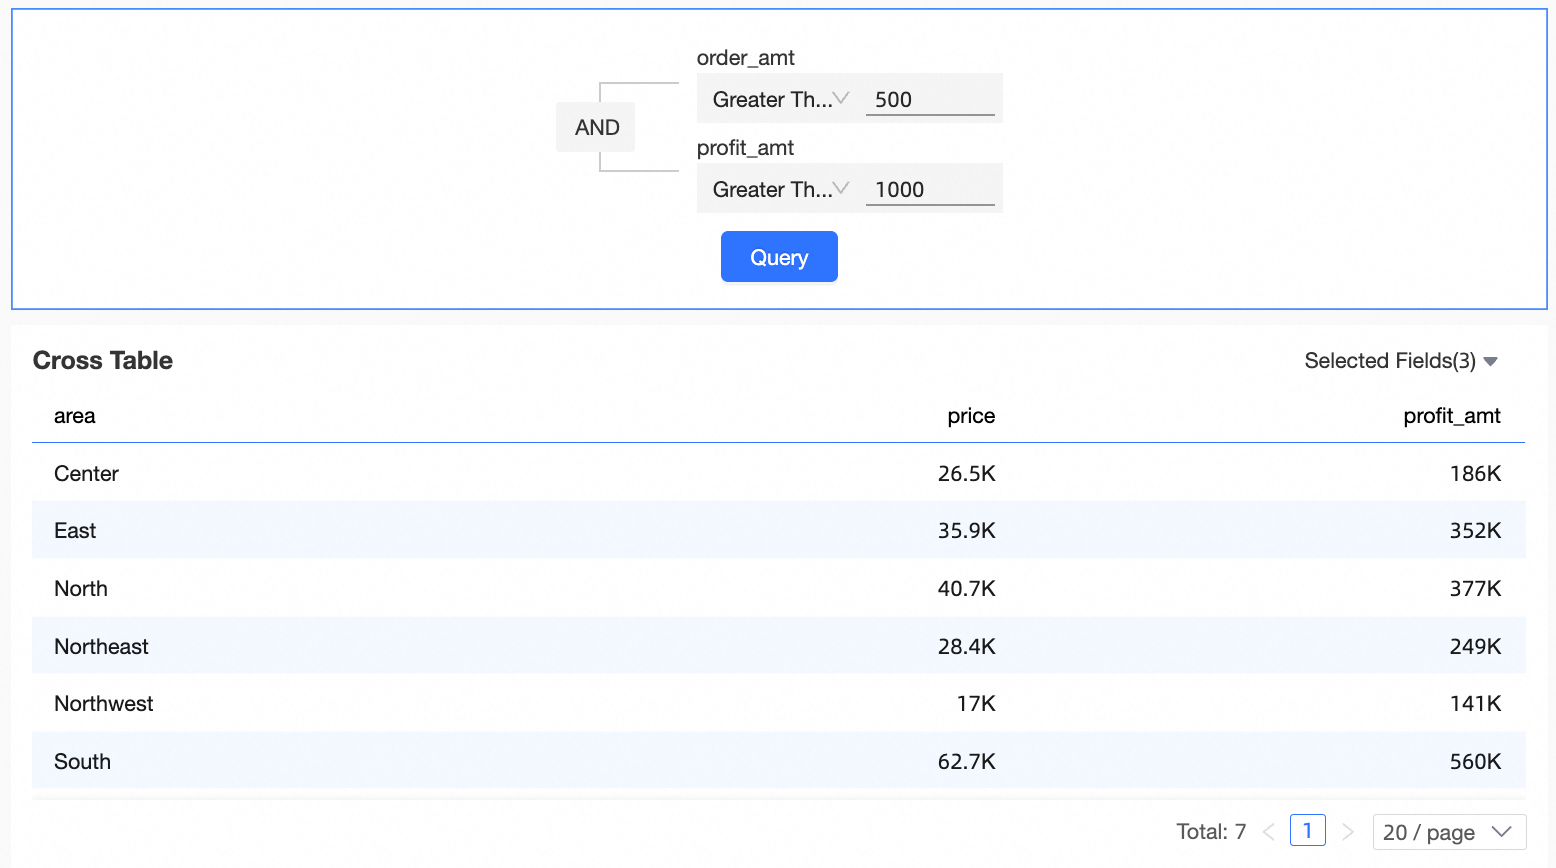
Click Add Condition. Set the filter field to Order Amt. The default field name is Order Amt. The default field name is Greater Than, 500.
Click Add Condition. Select Profit Amt as the filter field. The default field name is Profit Amt. The default field name is Greater than, 1000.
Click OK.
Click Query in the display area of the Compound Query Control widget. All the charts filtered by the widget are updated.
NoteOnly numeric values can be filtered. The data is displayed based on the aggregation method selected for measures in a chart. Assume that the aggregation method of the order_number field in a cross table is SUM. If you use the Compound Query Control widget to filter data records with order quantities greater than 30, the cross table displays all data records whose order quantity is greater than 30 and aggregation method is SUM.
Date Query
Data of a specific time range can be filtered by using Shortcut or Filter By Date.
Click the Compound Query Control icon. On the Data tab, select a dataset.
Click Configure Selector. In the Configure Selector dialog box that appears, select charts for filter interaction.
Click Add Filtering Condition to set filter conditions.
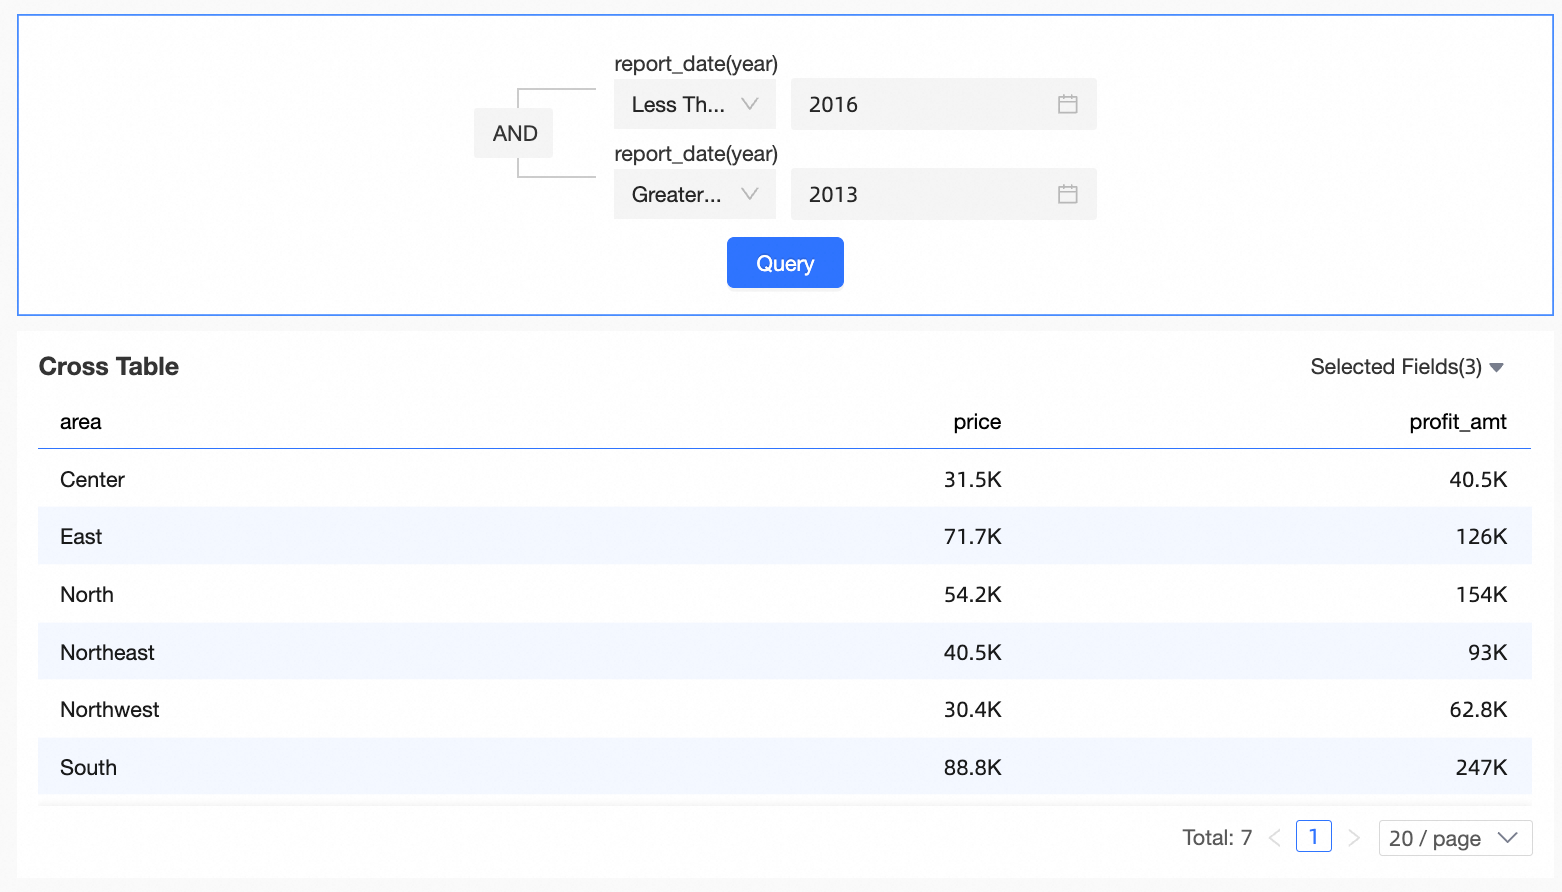
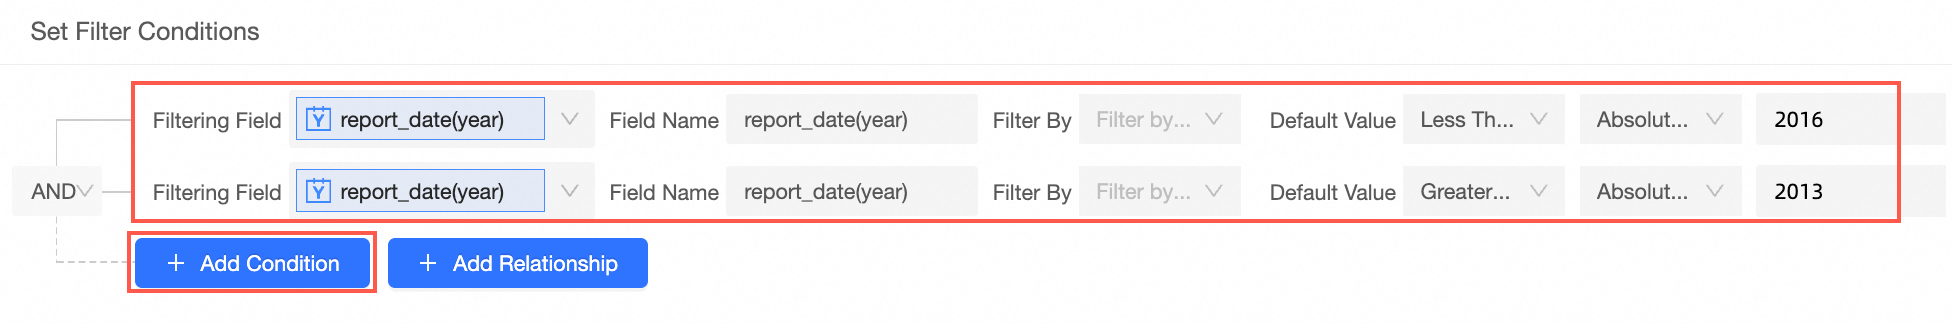
NoteTo filter a time range, you must first set the Default Value parameter to Greater Than or Greater Than or Equal Than or Equal To, and then set the Default Value parameter to Less Than or Equal To.
Click Add Condition. Select order_date (year) as the filter field, order_date (year) as the default field name, and greater than, 2011 as the default field name.
Click Add Condition, select report_date(year) as the filter field, modify the label name to Date, and select Less Than or Equal To, 2016 by default.
Click OK.
Click Query in the display area of the Compound Query Control widget. All the charts filtered by the widget are updated.