The browser monitoring module of Application Real-Time Monitoring Service (ARMS) provides the JavaScript (JS) error diagnostics feature. You can view the basic information and distribution of JS errors and backtrack user behaviors. This feature helps you identify and fix errors.
Portal
Log on to the ARMS console. In the left-side navigation pane, choose .
On the Browser Monitoring page, select a region in the top navigation bar and click the name of the application that you want to manage.
On the page that appears, choose in the left-side navigation pane.
On the JS error diagnosis page, you can set the required period in the upper-right corner.
View the error overview of the application
The Error Overview section shows the statistics and trends of JS errors within the selected period, including the following metrics:
Errors: the total number of JS errors that occurred within the selected period.
JS Error Rate: the number of page views (PVs) with JS errors to the total PVs within the selected period.
Affected Users: the quantity and percentage of users that are affected by JS errors.
Figure 1. Error overview of the application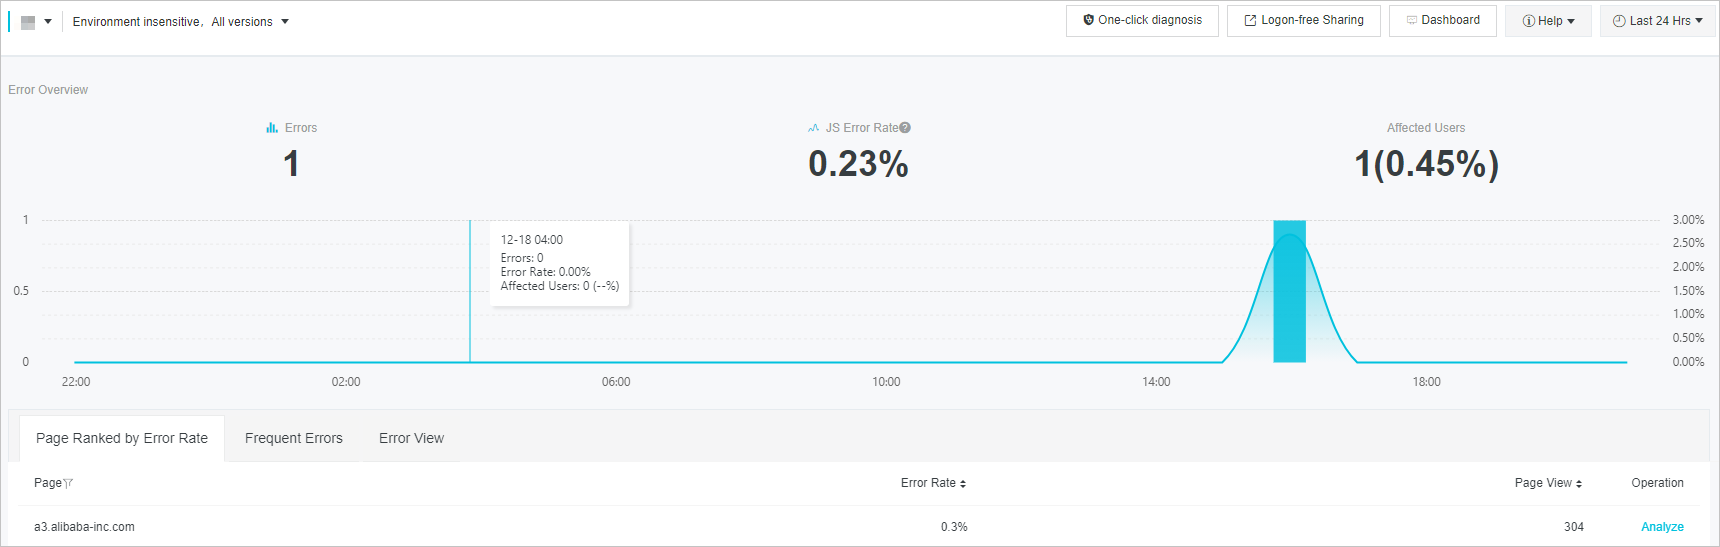
In the Error Overview section, perform the following operations:
Place the pointer over the curve. The number of errors, error rate, and number of affected users at the time point that correspond to a turning point of the curve appear in a floating manner.
Place the pointer over a turning point of the curve. When the pointer changes to a hand shape, click the turning point. The Exception Insight dialog box appears. For more information, see View exception insight.
In the curve section, hold down the left mouse button, drag the mouse to select an area, and then zoom in and view the selected part of the curve. Click Reset Zoom in the upper-right corner to restore the view.
On the JS error diagnosis page, the application-specific error overview is displayed by default in the Error Overview section. On the Page Ranked by Error Rate tab or the Page Error Rate Top 5 tab in the Exception Insight dialog box, click Analyze. The overview information of the corresponding tab appears.
View exception insight
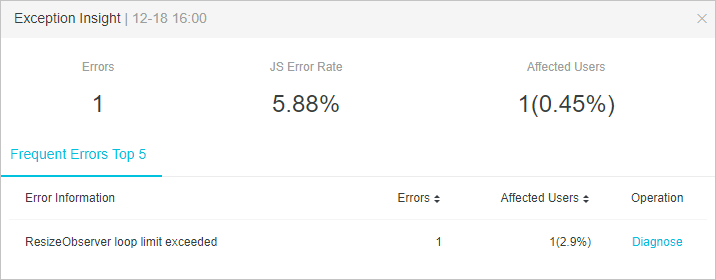
In the Exception Insight dialog box, information about the JS errors at a specific time point appears, including the following metrics:
Errors: the total number of JS errors at the specific time point.
JS Error Rate: the number of PVs with JS errors to the total PVs at the specific time point.
Affected Users: the quantity and percentage of users that are affected by JS errors.
Frequent Errors Top 5: the top 5 JS errors that occur the most frequently at the specific time point, including the information about the JS errors, the number of errors, and the number of affected users that are captured by ARMS.
Page Error Rate Top 5: the top 5 pages that have the five highest JS error rates at the specific time point, including the names of pages with JS errors, the JS error rates of the pages, and the number of PVs.
In the Exception Insight dialog box, you can perform the following operations:
Click the Frequent Errors Top 5 tab, and then click Diagnose in the Operation column. The JS error details page appears. For more information, see View error details.
Click the Page Error Rate Top 5 tab. On the tab that appears, click Analyze in the Operation column that corresponds to the page you want to view. The error overview of the page appears.
View pages ranked by error rate
On the Page Ranked by Error Rate tab, pages are ranked by JS error rate within the selected period in descending order, including the following metrics:
Page: the page on which JS errors occur.
Error Rate: the number of PVs with JS errors on the page to the total PVs within the selected period.
Page View: the number of views of the page.
Click Analyze in the Operation column. The error overview of the page appears.
Figure 2. Error overview of the page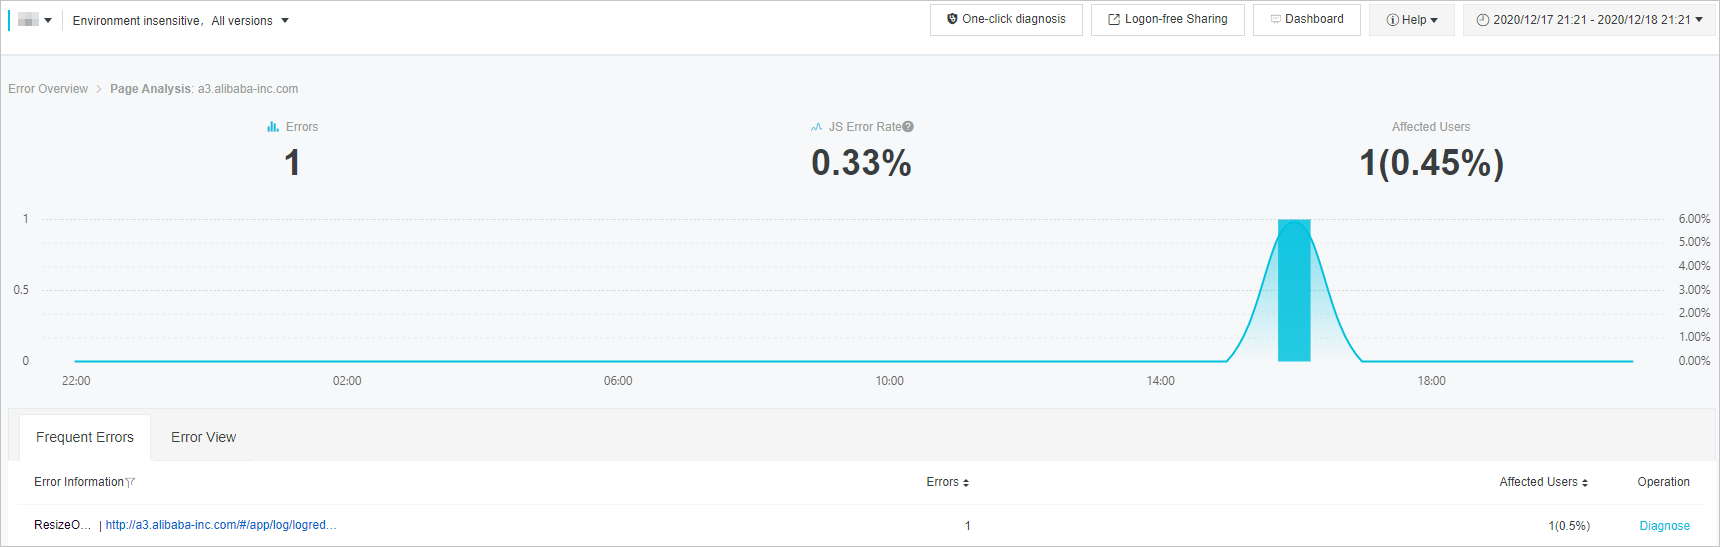
View frequent errors
On the Frequent Errors tab, JS errors are ranked by the number of occurrences within the selected period in descending order, including the following metrics:
Error Information: the JS error information captured by ARMS.
Page: the page on which the JS error occurs.
Errors: the number of occurrences of the JS error.
Affected Users: the quantity and percentage of users that are affected by the JS error.
Click Diagnose in the Operation column to go to the Error Detail tab. For more information, see View error details.
On the JS error diagnosis page, the application-specific JS errors are displayed by default on the Frequent Errors tab. On the Page Ranked by Error Rate tab or the Page Error Rate Top 5 tab in the Exception Insight dialog box, click Analyze. The information about the JS errors on the corresponding pages appears.
View error details
The following information is displayed on the Error Detail tab:
Summary
Name
Type
Date: the time when the JS error is detected.
Device
OS
Browser
IP
Connection Type
Region
Line
Column
URL
File: the path of the file where the JS error occurs.
App Version
Stack Info: the information related to the location of the JS error.
User Behavior Trace: the user behavior trace, which is used to backtrack the error.
Figure 3. JS error details page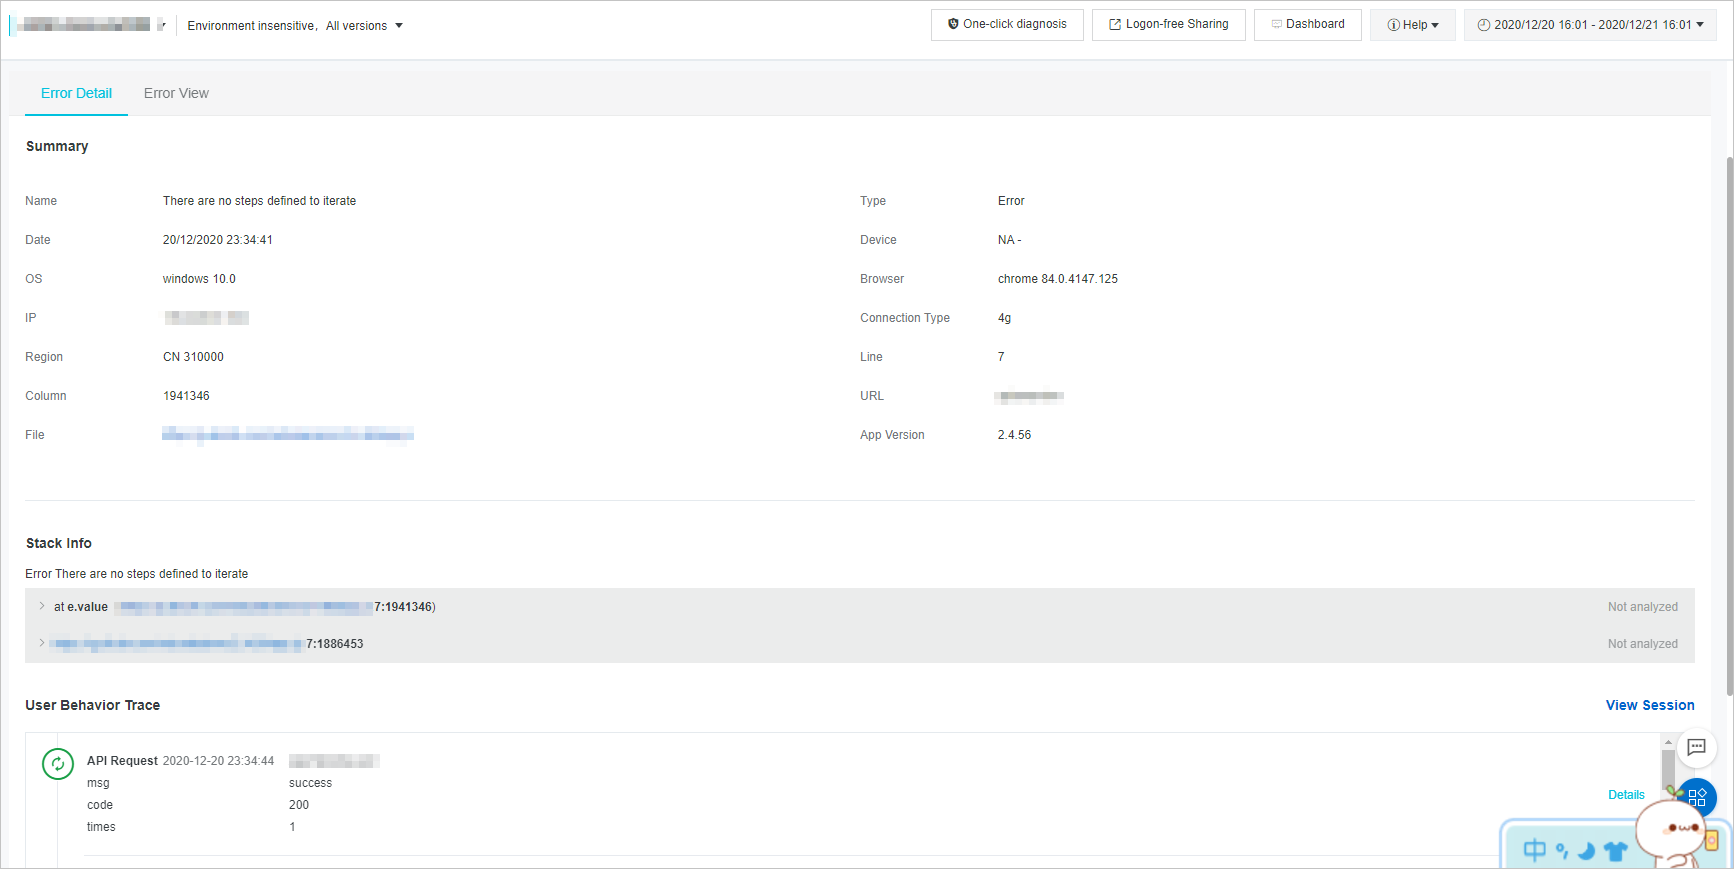
On the Error Detail tab, you can perform the following operations:
To specify the exact location of the JS error, click the triangle icon on the left side of a stack in the Stack Info section to show the line. Click Choose Sourcemap. In the Sourcemap File dialog box, select an existing source map file or upload a new source map file, and then click OK.
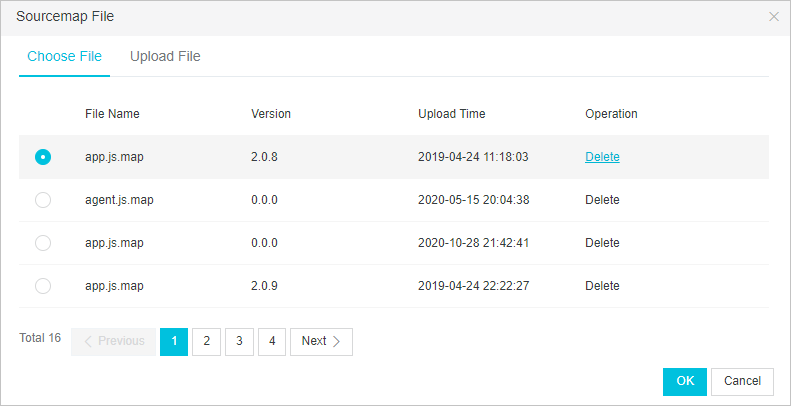
ARMS uses the source map file to retrieve the exact location of the JS error.
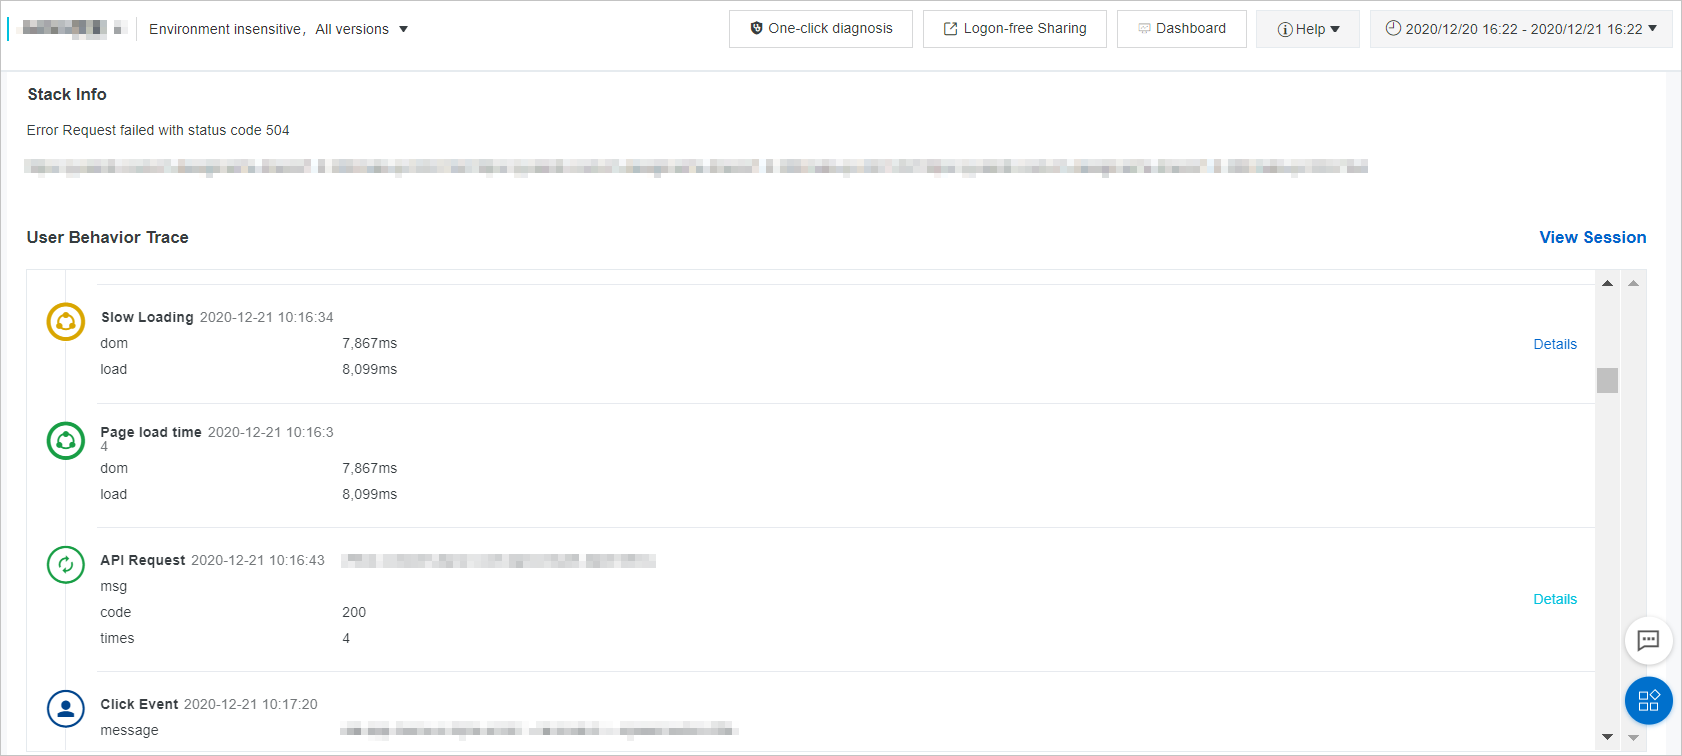
To view the user behavior trace, go to the Backtrack user behaviors section.
To view the distribution of the JS error, click the Error View tab.
Backtrack user behaviors
On the Error Detail tab, the User Behavior Trace section displays the user behavior trace to help backtrack the error.
View error distribution
The Error View tab of the JS error diagnosis page displays the distribution of a specific JS error, including the following metrics:
Time View: Only page-specific error distribution is shown in this section.
Browser View
OS View
Device View
Version View
Geographical View: Statistics are collected by province, municipality, or autonomous region on the China View tab, and are collected by country or region on the World View tab.
Figure 4. JS error view page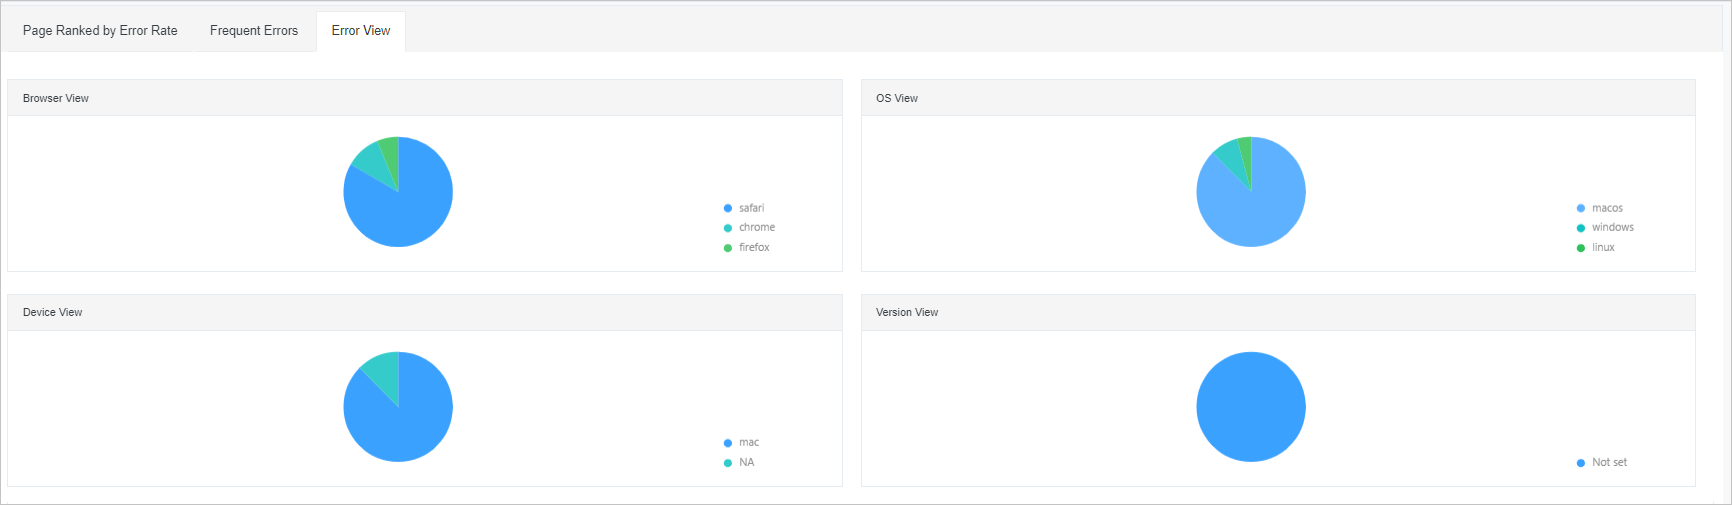
On the Error View tab, you can perform the following operations:
In the Time View section, move the pointer over the distribution map to view the number of errors.
In the Browser View, OS View, Device View, and Version View sections, move the pointer over the distribution map to view the number and percentage of errors.
On the China View or World View tab in the Geographical View section, click the arrows next to the Errors column name in the table on the right side to switch between ascending and descending orders.
FAQ
How do I enable or disable user behavior backtracking?
By default, this feature is enabled. To disable the feature, add the behavior: false SDK configuration item to config. For more information about SDK configuration items, see SDK reference.
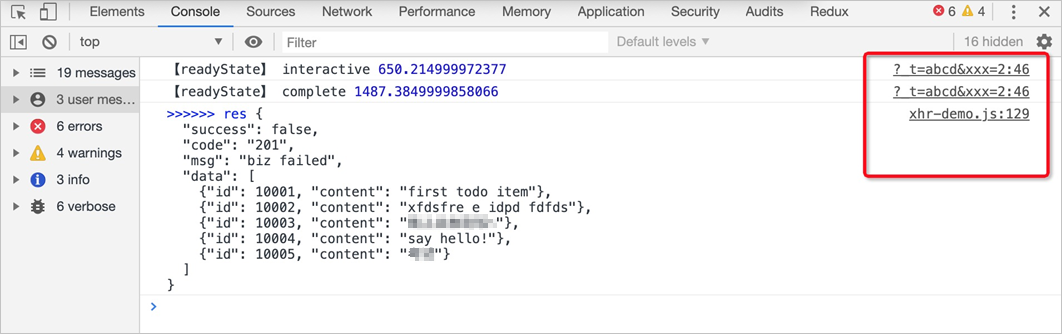
After user behavior backtracking is enabled, the error in the ARMS SDK code bl.js instead of the source code is located based on the printed information in console.log. How do I solve this problem?
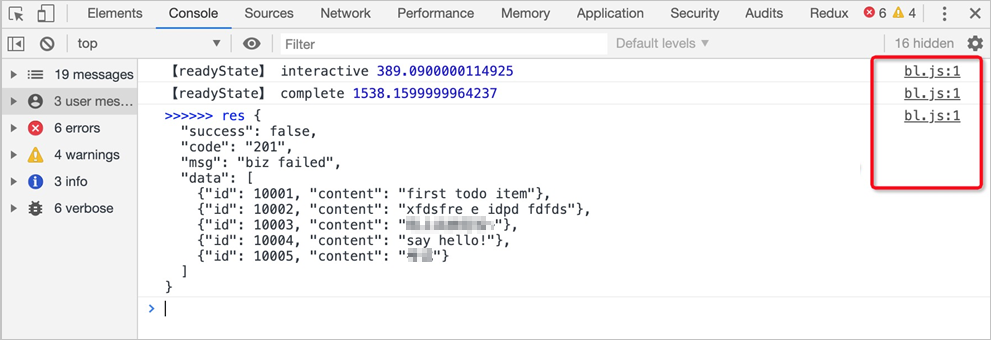
The reason is that ARMS rewrites log of the console object to monitor the content printed by the browser console. Solutions:
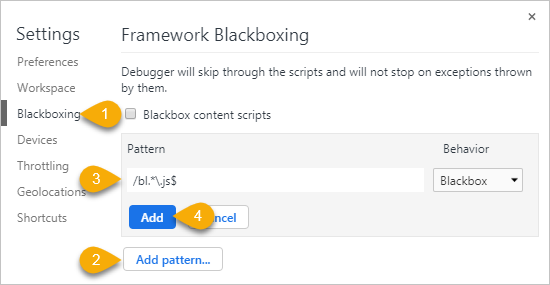
Method 1 (recommended): Set blackboxing for the Chrome browser.
Open the Chrome browser, press Ctrl+Shift+I to access the developer tools panel, and then click the Settings icon.
In the left-side navigation pane of the Settings panel, click Blackboxing. On the page that appears, click Add pattern. In the Pattern field, enter /bl. *\.js$. Then, click Add.
Method 2: Use the behavior: false SDK configuration item to disable user behavior backtracking.
<script>
    ! (function ( c , b, d, a ) {
        c [a] || ( c[a] = {});
        c [a].config = {
            pid: "xxxxx",
            imgUrl: "https://arms-retcode.aliyuncs.com/r.png?",
            sendResource: true,
            enableLinkTrace: true,
            behavior: false
        };
        with(b) with(body) with(insertBefore(createElement("script"), firstChild)) setAttribute("crossorigin", "", src = d)
    })(window, document, "https://retcode.alicdn.com/retcode/bl.js", "__bl");
</script>
After the preceding handling, the error in the source code can be located based on the printed information in console.log.