This article is from Alibaba DevOps Practice Guide written by Alibaba Cloud Yunxiao Team
With the development and evolution of cloud-native technologies, microservices, and containerization are inevitable options for large distributed IT architectures. The new technologies make IT systems more agile, robust, and high-performance. They also increase the complexity of the technical architecture and pose unprecedented challenges to application monitoring.
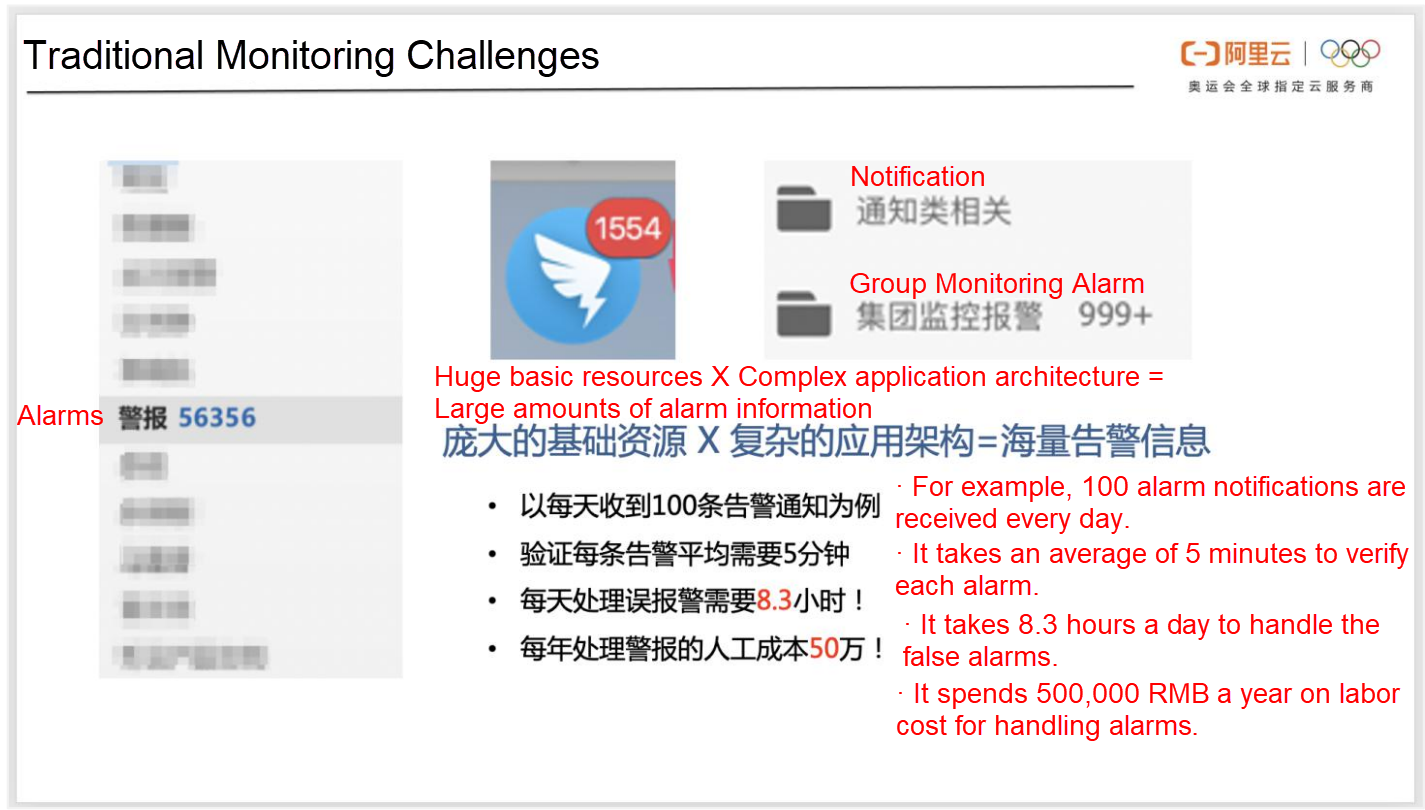
Traditional monitoring focuses on system-level monitoring of applications, hosts, and networks. With the extensive adoption of new technologies, such as microservices and cloud-native, the system architectures are becoming more complex, and the number of applications is increasing explosively. When a fault occurs, a large number of system alarms lead to alarm storms, making it difficult for technicians to locate the fault quickly. Besides, a large number of system-level monitoring produces a large number of false positives. So, technicians are forced to spend a lot of energy to deal with these false positives and eventually become numb to the alarms.
Traditional monitoring lacks monitoring from the business perspective and the relationship between businesses and IT systems. As a result, users, business personnel, and technicians cannot have a unified perspective. Many faults have already been reported by users, but technical engineers use system monitoring metrics to prove the system is normal. Sometimes, even though the business has been damaged, the technical engineers still cannot determine the faulted system, increasing the recovery time significantly.
Previously, Alibaba used multiple monitoring tools to monitor different objects, such as networks, physical machines, applications, and clients. However, data could not be shared among different tools, resulting in a lack of unified analysis of monitoring data. It is more difficult to integrate monitoring data with business scenarios. As a result, a large number of faults can only be solved based on the experience of technical personnel. They are constantly switching between multiple tools and gradually troubleshooting, which increases the fault recovery time significantly.
Traditional monitoring requires a large amount of configuration work, and the whole process is laborious. The lack of automated and intelligent monitoring measures is an important reason for the uneven monitoring capabilities of different systems. For some new businesses, monitoring capabilities are insufficient because they cannot invest a large amount of energy in configuring monitoring. However, as the business develops, technical personnel must constantly adjust alarm rules, and untimely adjustments often result in false positives and false negatives.
Alibaba has developed a top-down business-driven panoramic monitoring system To adapt to the DevOps R&D mode and solve problems of traditional monitoring, which mainly includes business monitoring, application monitoring, and cloud resource monitoring.
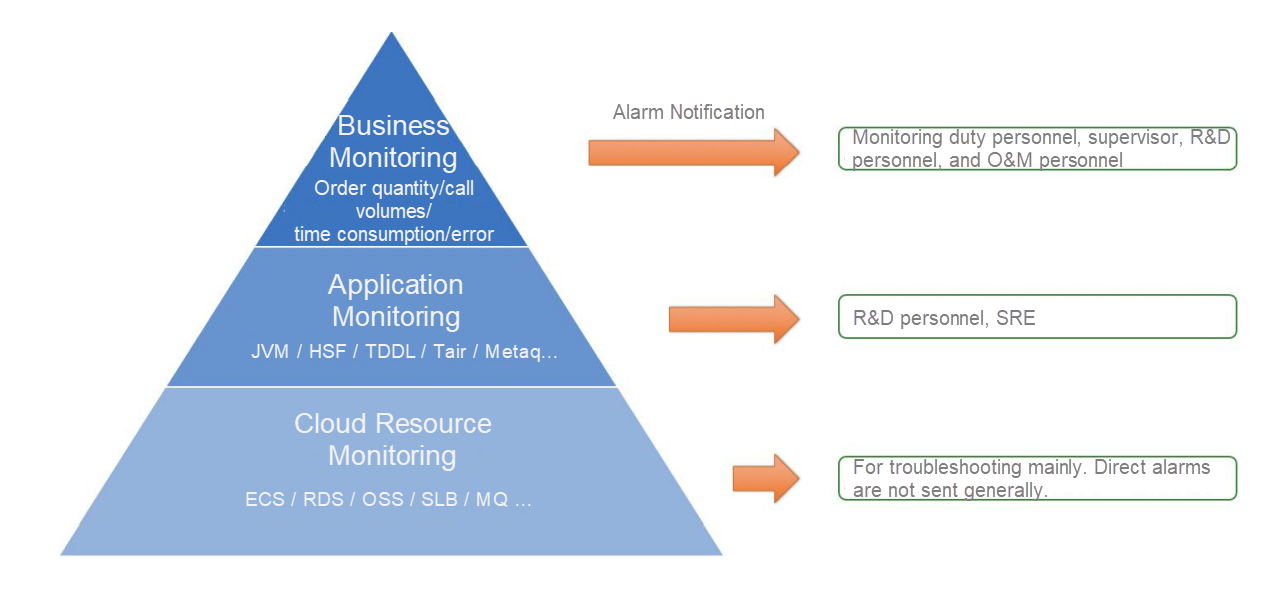
After the monitoring is layered, the monitoring metrics and alarm rules at each layer are divided into multiple levels, including serious, warning, and normal, based on their importance degree. Different levels of monitoring alarms are assigned to different roles. For example, the Production Security Team only focuses on the core business metrics of the whole group, and the stability leader of the business department monitors the core business within the department. R&D personnel of each team receives alerts for the businesses and applications for which they are responsible. In general, monitoring of cloud resource instances does not send alert notifications but is mainly used for troubleshooting and location. As such, the advantages of DevOps can be fully utilized, and the small number of O&M personnel will not become the bottleneck of troubleshooting, which is a problem in the traditional mode. In addition, the number of alarms that need to be handled by each member is reduced substantially. This solves the problem of alarm storms that flood important business monitoring alarms when a fault occurs.
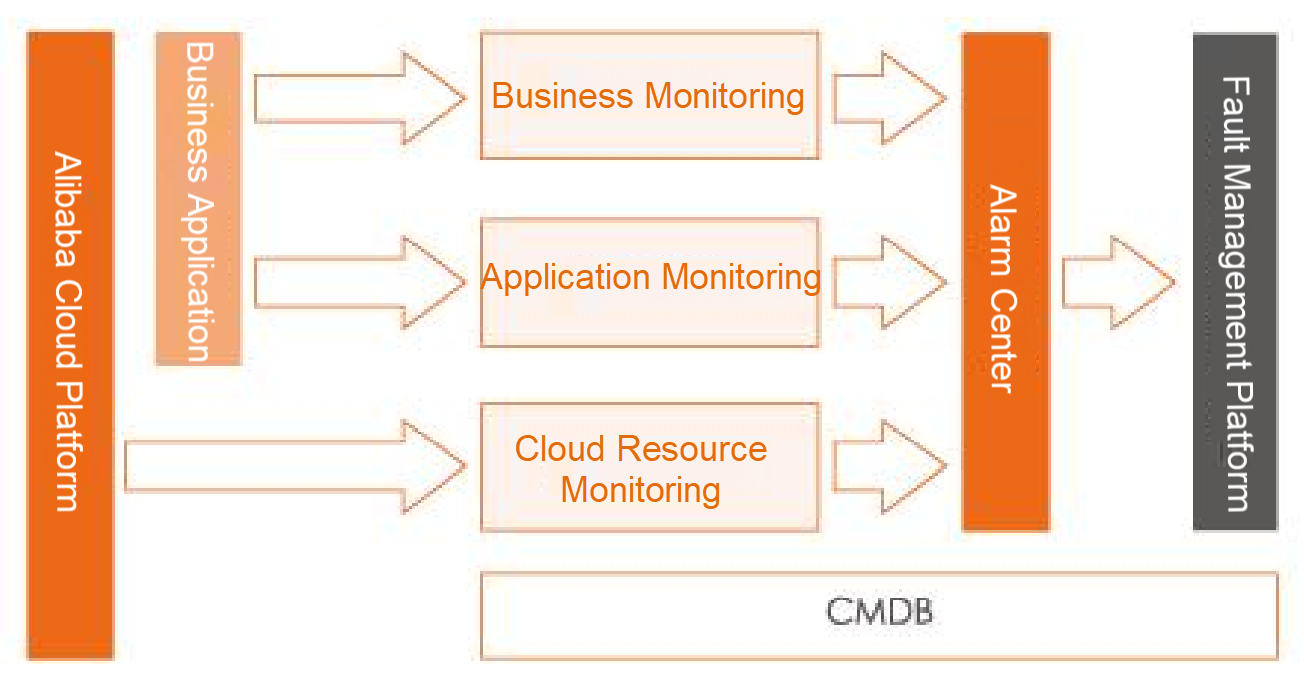
Based on the concept of panoramic monitoring, Alibaba has explored a unified monitoring architecture. This architecture does not pursue a unified monitoring platform mode but uses hierarchical construction to abstract cloud resources, applications, and businesses. Each of the three monitoring systems focuses on discovering faults in related fields. The unified CMDB solves the problem of inconsistent monitoring metadata. The alarm center and fault platform manage events and faults in a centralized manner to improve the accuracy through the intelligent algorithm platform.
Alibaba uses an exclusive log collection and computing framework developed for business monitoring. It extracts monitoring metrics from logs in real-time through page configuration. It is easy to use and features high customization, fast response, and no intrusion on the business. Moreover, it provides a complete domain model of business monitoring to guide users to achieve monitoring coverage.
The domain model of business monitoring includes:
Traditional O&M personnel prefers to use an enumeration method in the selection of business metrics, with all observable metrics and various alarms to give them a sense of security. When a fault occurs, abnormal metrics fill the screen, and alarm messages are constantly increasing. Such monitoring seems to be powerful, but the effect is just the opposite.
Common failures (non-logical problems of the business) of the core business in Alibaba Group can be reflected through three types of metrics (traffic, latency, and error) by sorting out the previous failures of Alibaba over the years. We call them the golden metrics:
The business monitoring platform provides a golden metric plug-in, which can generate a set of golden metrics at a single configuration. It is the most widely used metric model for business monitoring.
Business monitoring alarms are directly associated with faults and have high requirements on the quality of monitoring data. Besides, it requires good flexibility. Specifically, it needs to meet the monitoring requirements of different technology implementations and cannot affect the performance of the monitored business system. Alibaba's business monitoring maximizes the flexibility of business monitoring using logs as a data source and applies to almost all technology stacks. Log collection adopts technologies, including uncompressed incremental collection and zero-copy, reducing the impact of monitoring collection on the performance of the business system. It adopts the pull mode architecture, retry mechanism, and data completeness model to ensure the reliability and integrity of data collection. The configuration capability of the complete white screen and the comprehensive debugging function minimize the configuration difficulty and cost for users.
Alibaba application monitoring, built in a standardized and component-based manner, is integrated with the Alibaba technology stack to provide common system and middleware monitoring components. The O&M personnel does not need to modify the program code. The monitoring process is automated. Application monitoring is automatically enabled after applications are launched or scaled out, eliminating the need for manual operations. This reduces the monitoring maintenance cost significantly.
When the O&M system launches or scales out an application, the changes are written to CMDB, and CMDB pushes the changes to MQ. The application monitoring platform subscribes to MQ for real-time application configuration changes and generates new monitoring tasks. The monitoring tasks are sent to the Agent of the specified target server (container), and the Agent sends a collection request based on the configuration information of the task. The Agent obtains monitoring data from endpoints, such as Exporter provided by the business application, and uploads the data to the monitoring cluster for computing and storage. The exception detection module also generates alarm detection tasks based on application configuration changes. The module pulls monitoring data from the time series database to detect exceptions and send exception events to the alarm center.
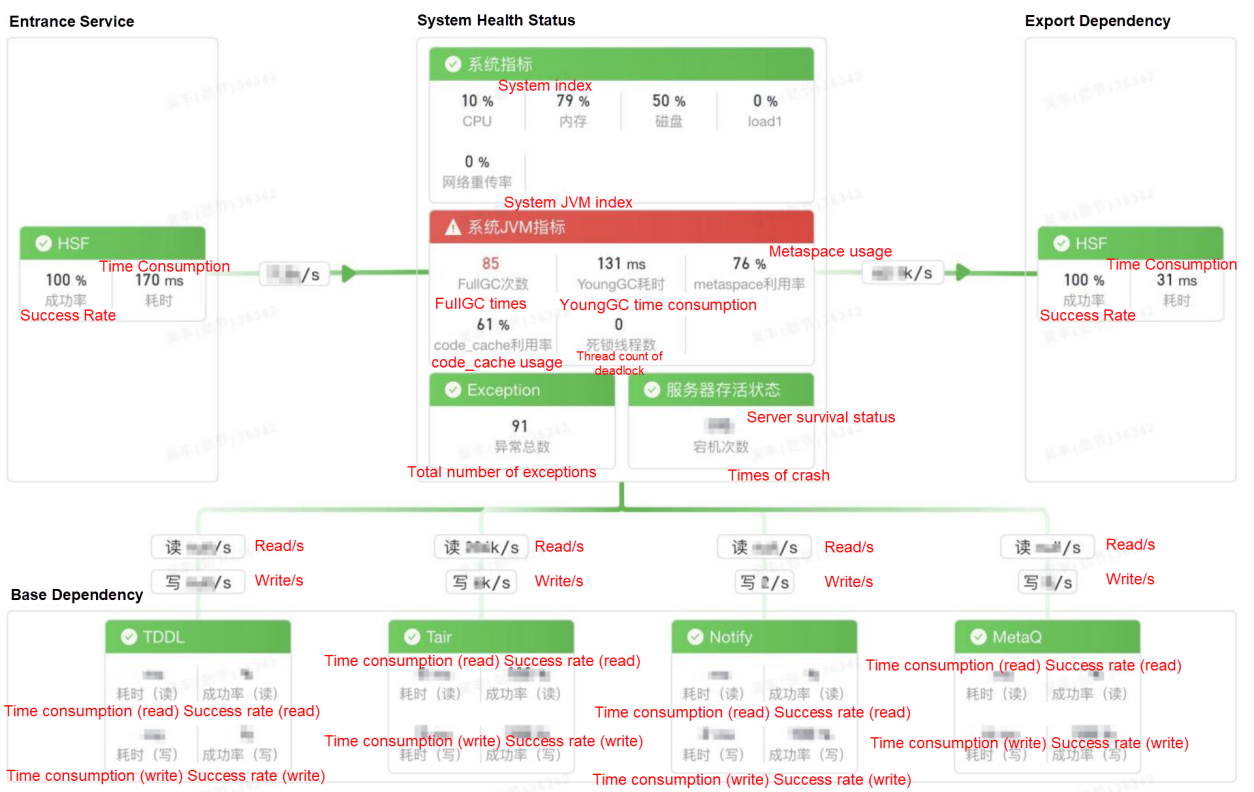
Alibaba Cloud resource monitoring works with the Alibaba Cloud cloud monitoring API to obtain the metric data and alarm events of cloud resources. Then, the data connects with the relationship information between applications and cloud resources in CMDB. Ultimately, the health status view of cloud resources is formed from the application perspective, which solves the problem when cloud infrastructure monitoring and upper-layer application monitoring are isolated from each other. Relying on the monitoring capability of the cloud platform and the data accumulation of CMDB, the entire cloud resource monitoring is completed automatically without manual operations.
Alibaba has built a smart detection platform to solve the problem of low alarm accuracy and high configuration maintenance costs that uses AI algorithms to detect the exceptions of online businesses and applications. No manual configuration of alarm thresholds is required during this process. According to the different characteristics of business and application monitoring data, different exception detection policies are adopted:
1. Intelligent Baseline
Business monitoring has high requirements for the accuracy of alarms. Moreover, data fluctuates with the business cycle, so the amount difference between peak data and trough data may be dozens of times or even hundreds of times. Traditional threshold alarms or period-over-period alarms often require experienced O&M experts to constantly adjust rules, which can easily lead to false positives. To this end, Alibaba uses the intelligent baseline algorithm to automatically learn the periodic pattern of data curves based on historical trends. When the business metrics exceed the baseline tolerance range, the business alarm is triggered immediately. The intelligent baseline algorithm uses the online prediction function to optimize the compatibility of algorithms with data. That means the algorithm makes point-by-point predictions for the data in the next period. This function achieves a good compromise between long-term and recent historical rules. Based on the training of a large number of diversified business metrics and the labeling of expert experience within Alibaba, the platform can gracefully reflect different types of business fluctuations in the algorithm. The algorithm can be adapted to the fluctuations in the data curve and the ups and downs that arise with the business. It can access various business monitoring data with one click. After long-term experience in various external attacks and internal crawler stress testing, the algorithm has good resistance to interference attacks. The algorithms can support second-level and minute-level computing without any manual monitoring configuration. In addition, there is no need to adjust parameters for the algorithm as the business changes because the algorithm can adapt to business changes by learning the rules.
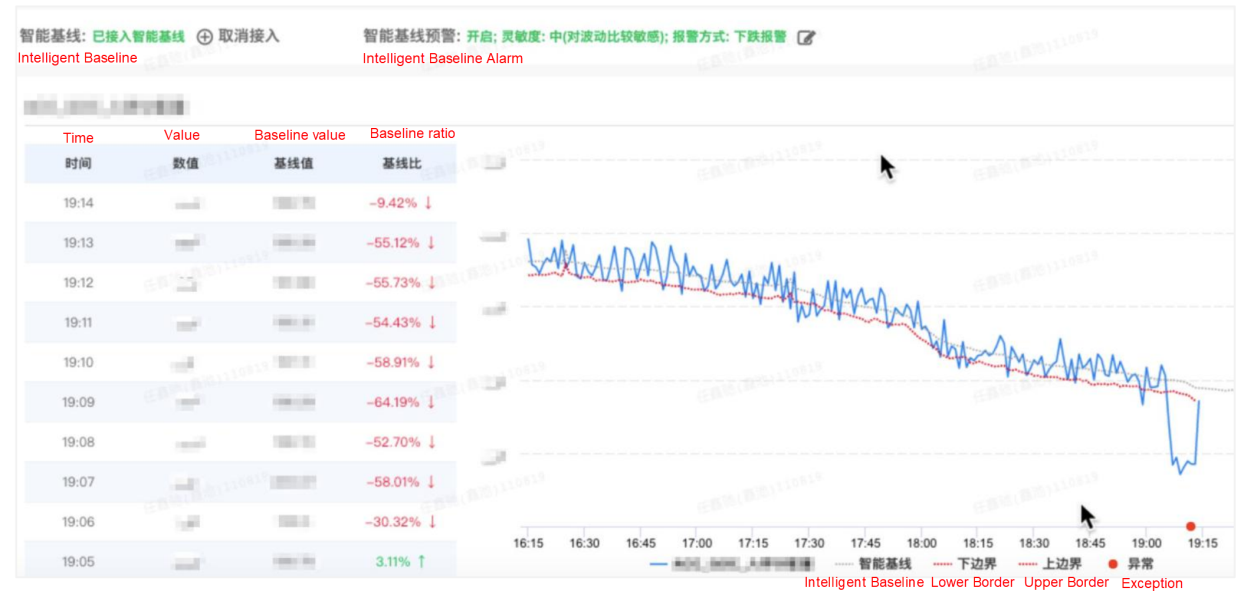
2. Exception Detection of Application Metrics
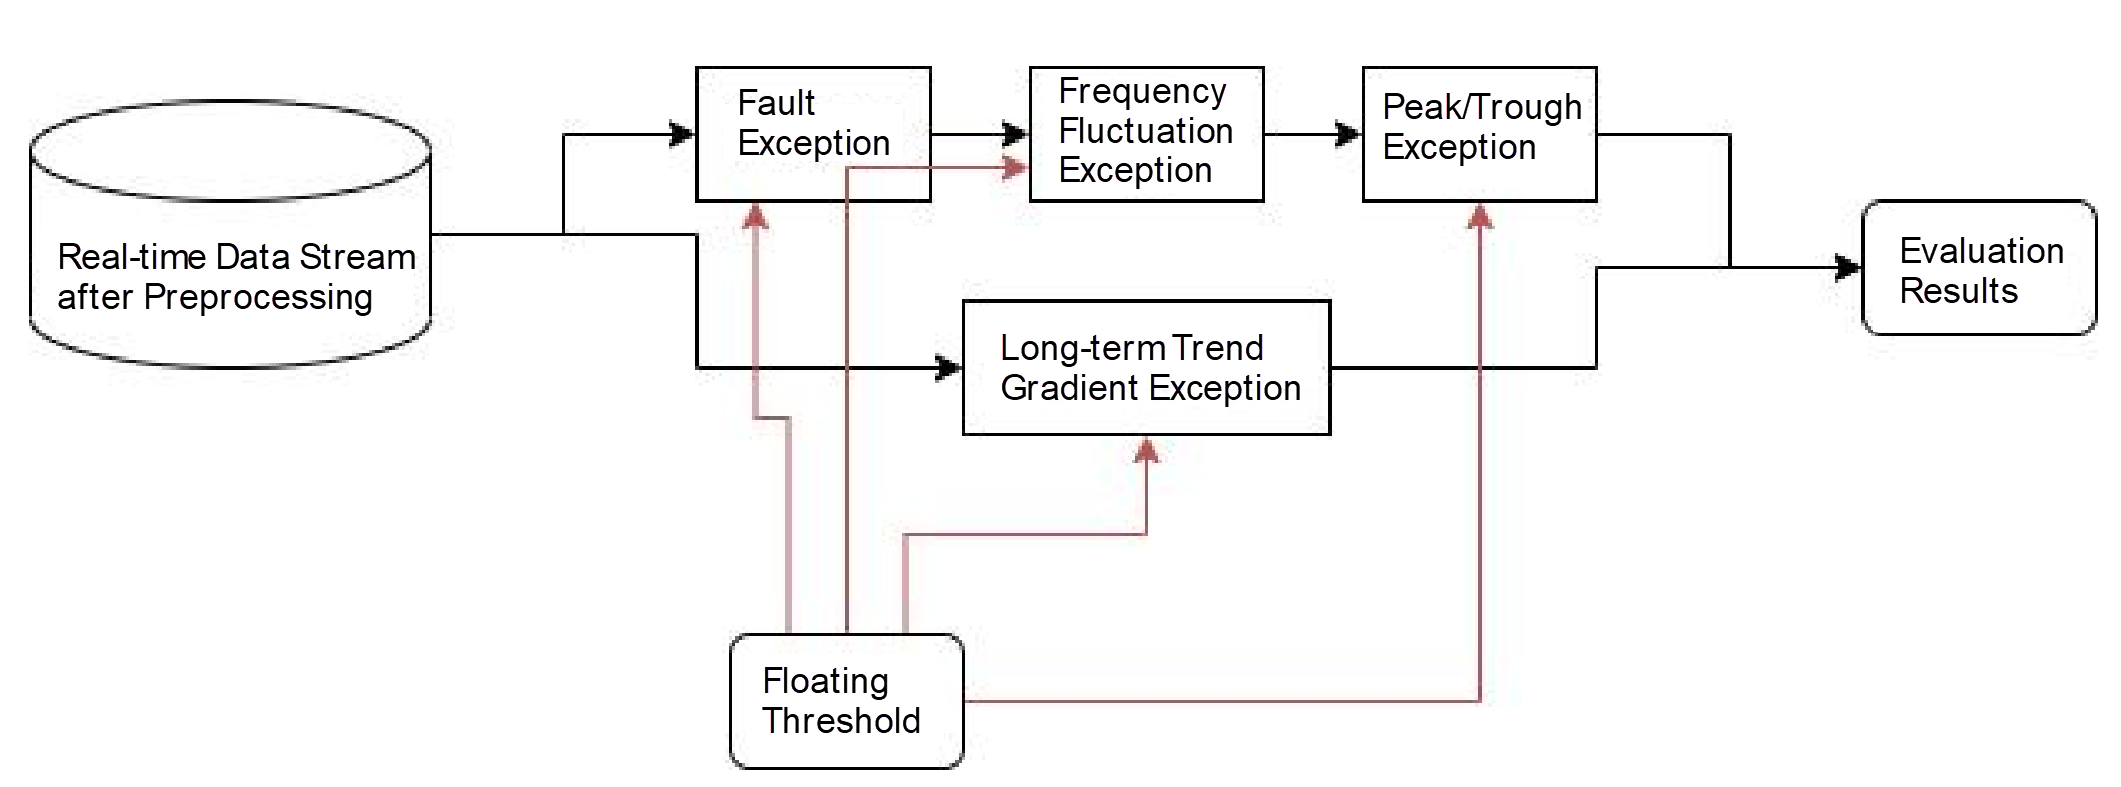
There are many application monitoring metrics, and the traditional manual threshold configuration method is extremely costly. Enterprises often use alarm templates to configure the same alarm threshold for a large number of applications. However, due to the differences between different application systems, it is difficult to define an accurate threshold. Thus, it easily leads to false negatives of minor problems and false positives of major problems. The scenario of system metrics is different from business metrics. The periodicity of system metrics is more uncertain, and each metric has a relatively large, not periodic fluctuation. Based on the characteristics of application metrics, Alibaba has developed an exception detection algorithm for application metrics. This algorithm performs detection by combining with multiple algorithms, including fault detection, frequency fluctuation exception detection, peak and trough exception detection, long-term gradient trend detection, and floating threshold. Due to the large number of application monitoring metrics, all detection methods adopt lightweight algorithms for a wide range of usage and largely reduce resource consumption for exception detection services.
Alarm Center: It connects with alarm events from various monitoring platforms to record and process alarm events in a unified manner, such as merging, noise reduction, and suppression. Finally, it sends the events to relevant handlers.
Fault Management Platform: It defines fault levels and manages the entire fault lifecycle. Alarms that match the fault levels are upgraded to faults. Then, the fault management process begins.
CMDB: Unified O&M CMDB is the metadata center for the entire Alibaba application O&M system. It maintains products, applications, instances (container, VM, cloud resource), data centers, units, environments, and other O&M objects of the whole Alibaba Group. It also maintains the relationships between objects. The monitoring system at each layer is associated with objects in the CMDB model.
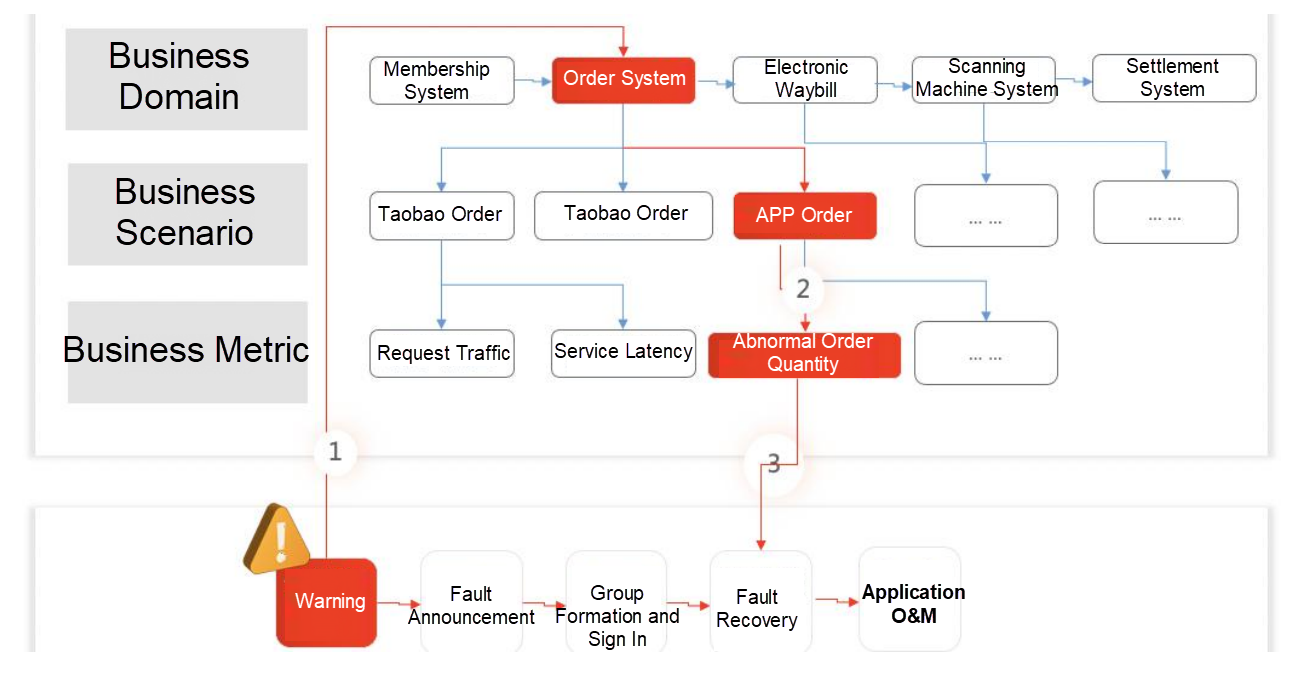
Such systematic construction enables quick and accurate alarming when a fault occurs. Developers and O&M personnel can deeply analyze key applications, resources status, and infrastructure on the faulty procedure from the business entrance. Therefore, developers and O&M personnel are allowed to gradually exclude suspicious nodes when a fault occurs and quickly identify the causes of the fault on the monitoring page.
Let’s take the sudden fault about call latency of an order system as an example. The troubleshooting process of panoramic monitoring is listed below:
In addition to providing excellent monitoring features, a good monitoring system requires a matching management system. Alibaba has adopted a monitoring management system driven by fault management with strict quantitative definitions of fault levels for each department and team. Fault levels are defined directly based on business monitoring metrics to specify metric trigger rules corresponding to different fault levels. The production security team works out core business scenarios, business indicators, and fault levels with each business department. The completed business monitoring configuration and the fault level definition need to be consistent through review, so the Business Team (operation, product, customer) and R&D Team form a unified monitoring standard. Specifically, the responsibilities of all parties are clarified to reduce communication costs and achieve a strong correlation between monitoring results and business objectives.
The entire fault definition process is online and structured. When business metrics exceed the range of fault definition, the fault management platform triggers a fault notification automatically and sends it to the technical personnel of the relevant team in a timely manner. Technicians can quickly view business monitoring data through fault notification. They use the vertical topology linkage capability of panoramic monitoring to perform in-depth analysis from business metrics to the status of the associated application and then from application status to cloud resource status. This way, they locate faults quickly. Then, the technical personnel determine a fault recovery solution based on the troubleshooting information and perform a rollback, downgrade, switchover, and other operations on the O&M platform to quickly recover from the fault. The entire process is completed online. The troubleshooting progress is automatically pushed to the relevant personnel, and all operations are recorded. Finally, the Production Security Team organizes fault reviews, formulates improvement measures, improves monitoring coverage, and achieves positive feedback on business production security.
Panoramic monitoring is not just the simple integration of layered monitoring capabilities, including business, applications, and resources. More importantly, panoramic monitoring supports the in-depth analysis from business metrics to application status and has the vertical topology linkage capability from the application status to the resource status through in-depth analysis. It is also integrated monitoring for the intelligent health check of metrics at all layers. Panoramic monitoring resolves the core issues of the traditional monitoring platform, such as the lack of business monitoring capabilities, the dispersion of monitoring data and alarms at all layers, and the relatively high configuration cost. It provides an integrated and one-stop monitoring solution for the Alibaba economy based on Alibaba's powerful monitoring technology accumulation and best practices of emergency troubleshooting. It is the best practice of Alibaba's production security management.
Security Engineering in Business Systems - Alibaba DevOps Practice Part 20

1,397 posts | 492 followers
FollowAlibaba Cloud Community - February 22, 2022
Alibaba Cloud Community - February 18, 2022
Alibaba Cloud Native - October 27, 2021
Alibaba Cloud Native Community - November 24, 2025
Alibaba Cloud Community - March 2, 2022
AliCloud-Data Middle Office - August 25, 2021

1,397 posts | 492 followers
Follow Bastionhost
A unified, efficient, and secure platform that provides cloud-based O&M, access control, and operation audit.
Learn More Managed Service for Grafana
Managed Service for Grafana displays a large amount of data in real time to provide an overview of business and O&M monitoring.
Learn More DevOps Solution
Accelerate software development and delivery by integrating DevOps with the cloud
Learn More Alibaba Cloud Flow
An enterprise-level continuous delivery tool.
Learn MoreMore Posts by Alibaba Cloud Community