In August 2022, the cloud-native data warehouse AnalyticDB for PostgreSQL released manual start-pause and per-second billing functions. Computing resources are free of charge during instance pause, which helps users save costs. In September 2022, the plan management function was publicly previewed to enable automatic work. It provides abundant resource flexibility, supports the start and pause of plans and the scale-out and scale-in of computing nodes, and facilitates users to plan resource usage of instances based on the time dimension, saving costs.
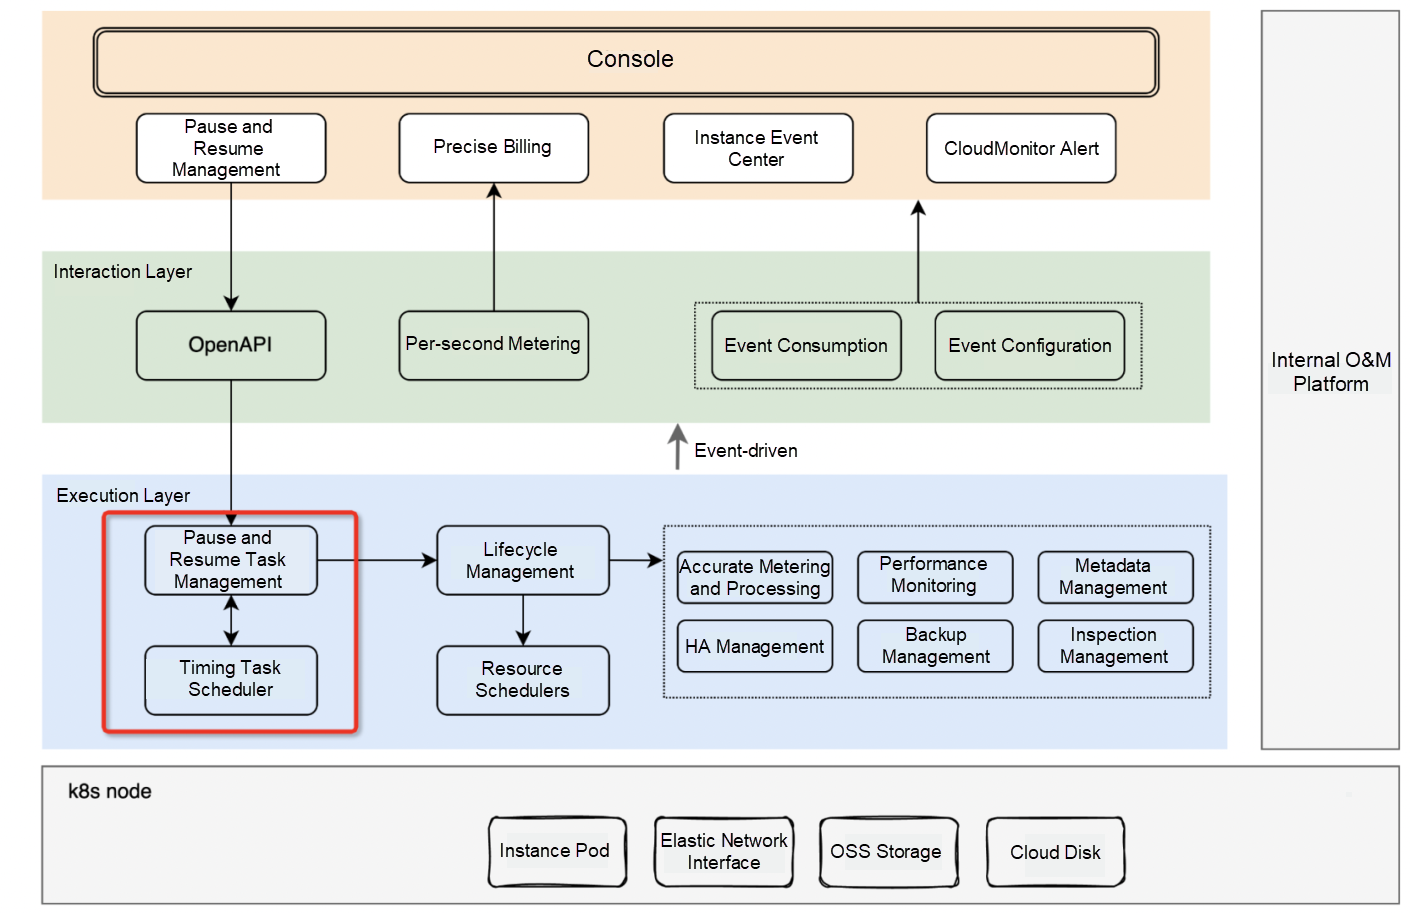
Based on the technical framework of manual start and pause, a planned task management module is added to the execution layer of planned tasks. At the same time, a timing task scheduler is introduced to execute timing tasks at regular intervals.
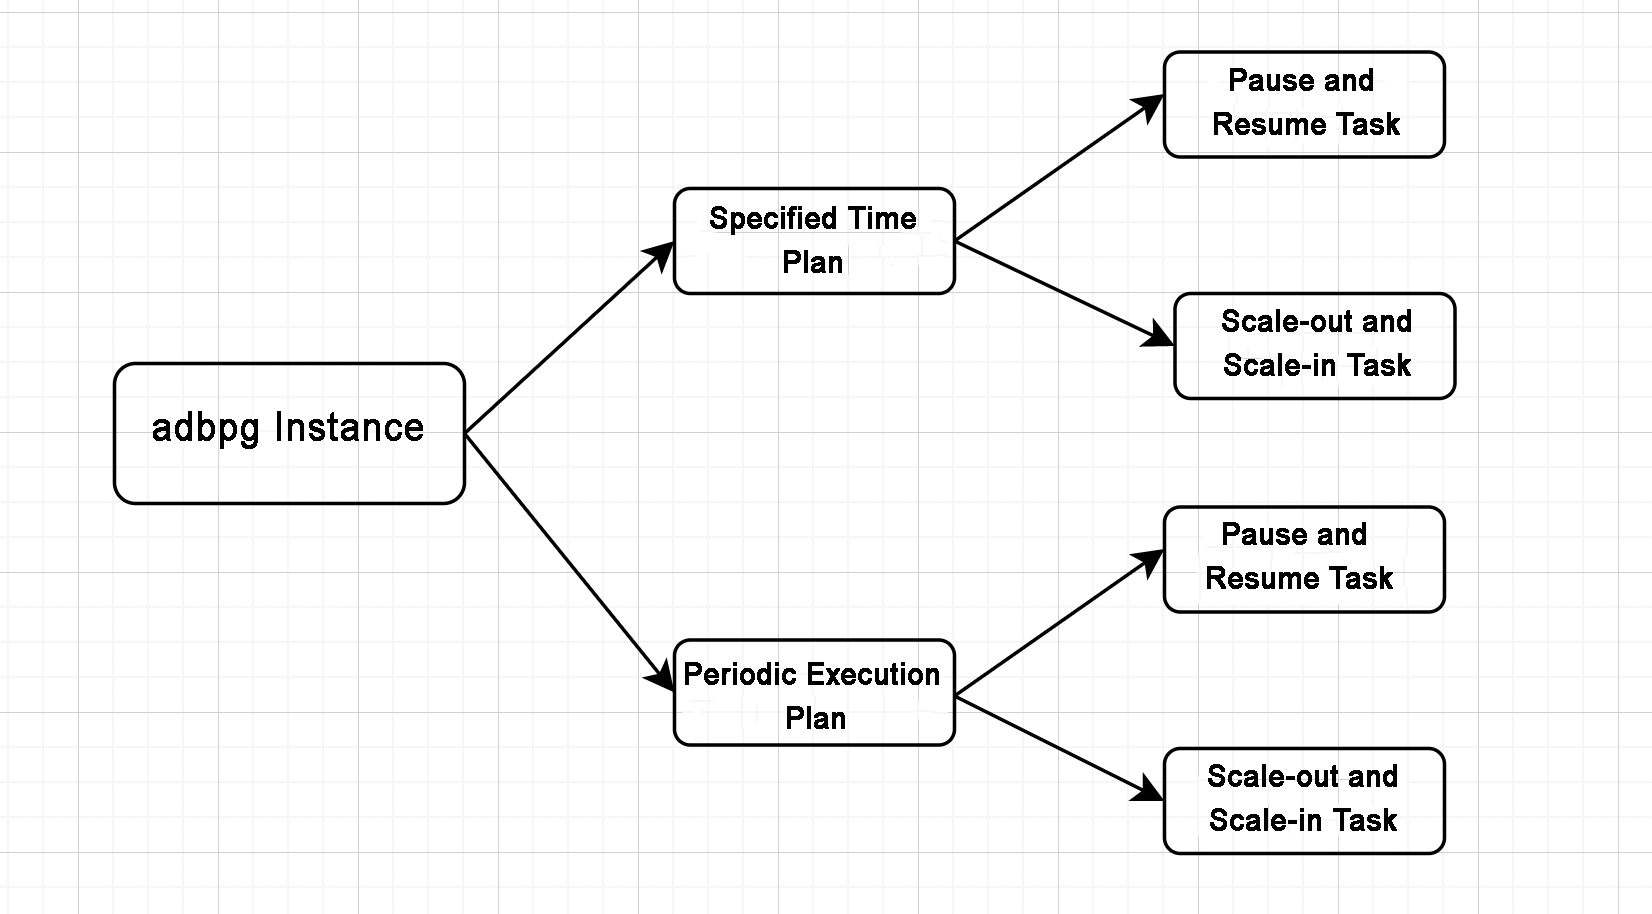
Execute planned tasks (start, pause, scale-out, and scale-in) at the specified time, which applies to emergencies. For example, if a user wants to temporarily run a batch of tasks, temporarily scale out, and scale in immediately after the run, it can be used to manage resource usage reasonably.
Execute tasks based on a fixed cycle (start, pause, scale-out, and scale-in), which applies to regular services, such as offline batch running. The computing resources are scaled out during batch running every early morning and reduced after running.
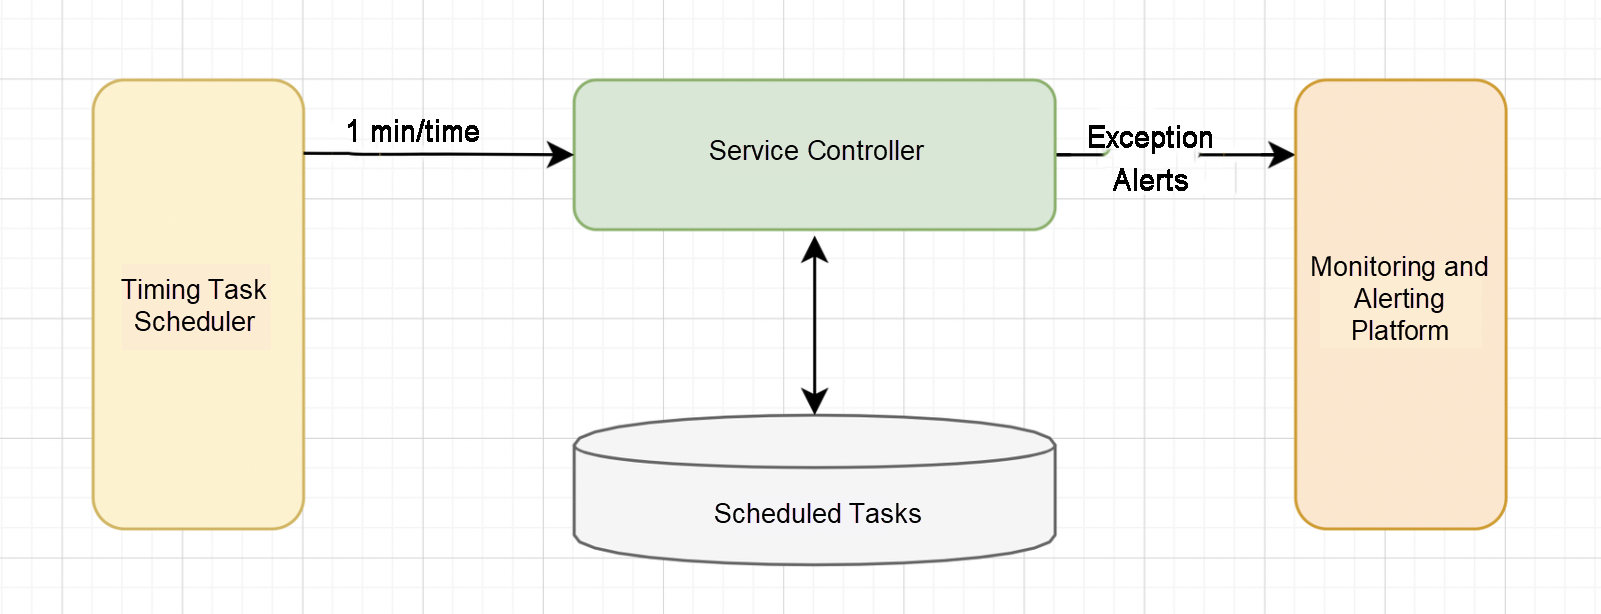
Planned tasks are associated with instances, and one instance can create multiple planned tasks. The timing task scheduler calls the execution task operation of the business controller every minute. The business controller queries all the planned tasks to be executed and uses an asynchronous thread pool to execute the specific planned tasks. Considering the scheduling cycle of the timing task scheduler, theoretically, the task execution time may be delayed by up to one minute.
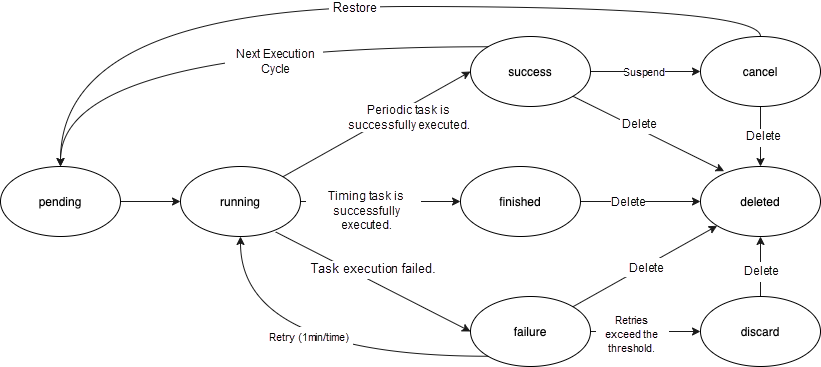
Planned tasks have the following states, and the state transitions are shown in the following figure:
Planned tasks enable users to plan resource usage in the time dimension, automatically scale in or pause instances during business troughs, and automatically start or scale out computing resources during business peaks, which saves user costs to the greatest extent. Also, planned tasks pose higher challenges to the automated O&M of products.
We mainly consider the timing task scheduler and monitor alerts to ensure planned tasks can be executed on time.
Planned tasks are divided into two types. The first type does not depend on the underlying resources, such as pause and scale-in. Such tasks are mainly related to the running environment during execution, and the probability of failure is small. Even if the task fails, as long as it is handled within a controllable time range, the impact on users is controllable. However, the success rate of start and scale-out tasks depends on the current run time environment and the watermark of the underlying resource pool. If such tasks are not executed timely or fail to be executed, they will impact the user's business and easily cause production failures. Therefore, how to ensure the success rate of such tasks is our primary consideration.
The underlying layer of the adbpg serverless instance is deployed in a resource pool mode, which can improve the production and elasticity speed of the instance and realize per-second scale in and out. However, the resource pool needs to maintain certain resource buffers. If the resource sales rate does not increase, the business cost will increase. For planned tasks, if an instance is paused or scaled in, not releasing resources ensures the resources of the instance being started or scaled out but will undoubtedly increase the cost of the product. If resources are released, how can we ensure that the instance has resources when it is started or scaled out? We adopt the resource pool mode with separate hot and cold pools. The hot pool stores schedulable resources without maintaining resource buffers. The cold pool stores ECS off-duty, which is pre-installed with business components. There is no charge for computing resources. Users only need to bear the cost of the system disk. When the hot pool is insufficient, the cold pool can pop up to the hot pool without business awareness. The following is the implementation principle of the hot and cold resource pool mode:
After purchasing a Serverless instance, users can perform the following operations to create a planned task and view the execution records in the Event Center.
Note: Currently, Serverless only supports planned tasks only on a pay-as-you-go basis.
Click the link to purchase Serverless Instance: Pay-As-You-Go Trial
Log on to the AnalyticDB for PostgreSQL console. On the Instance Details page, click Plan Management and then click Create a Planned Task:
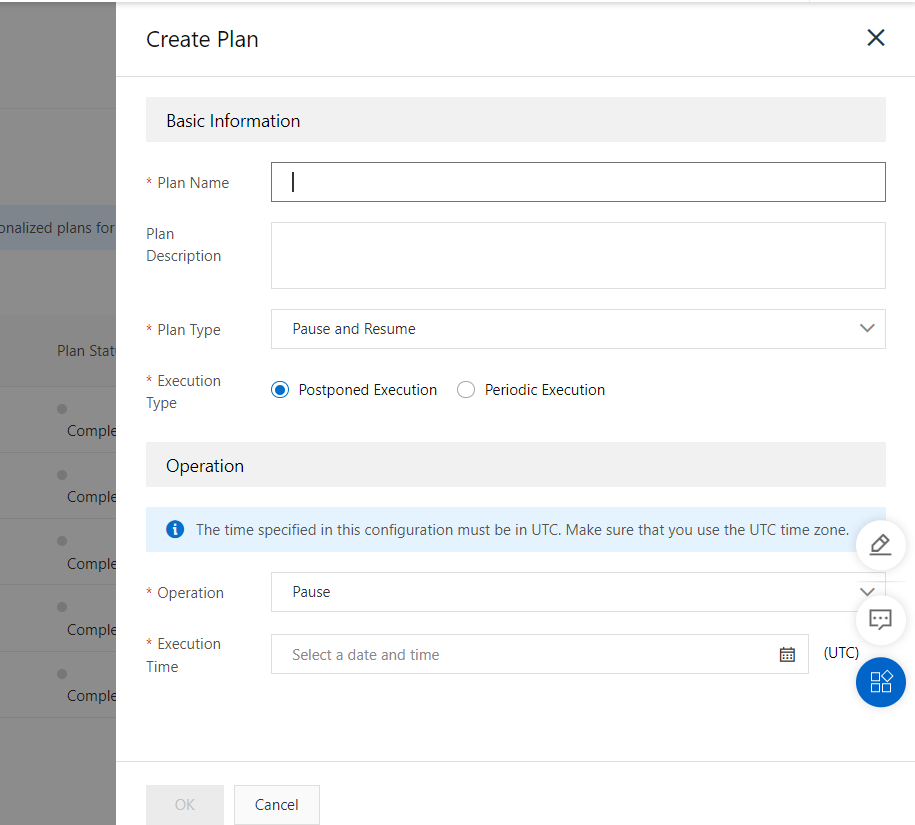
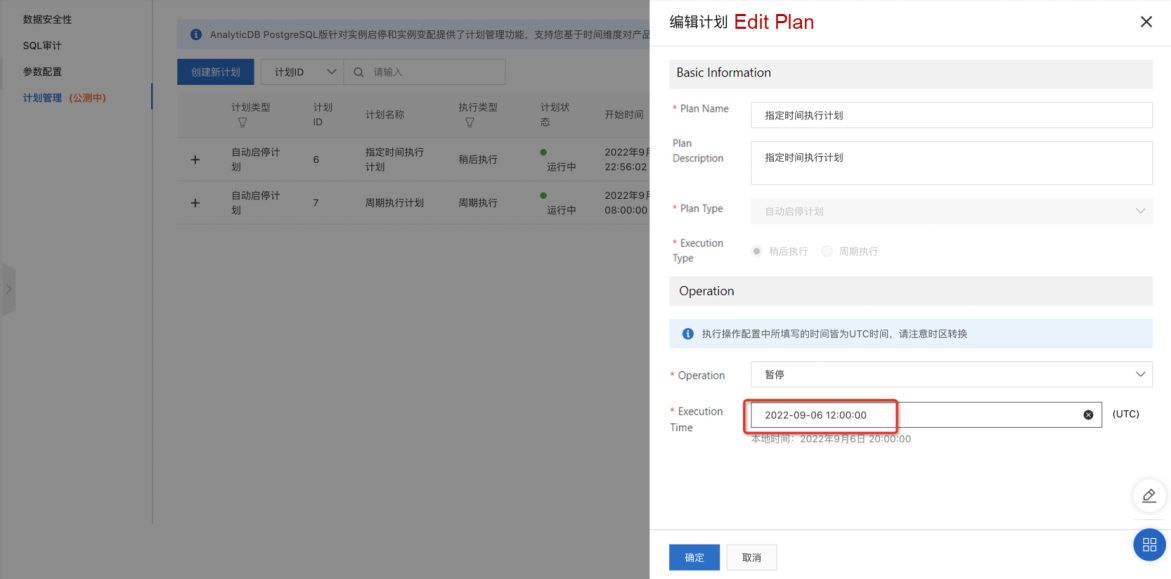
Note: The specified run time is UTC, which should be converted according to local time. After the planned task is created, the details can be viewed on the Plan List page, including the plan status and planned execution time.
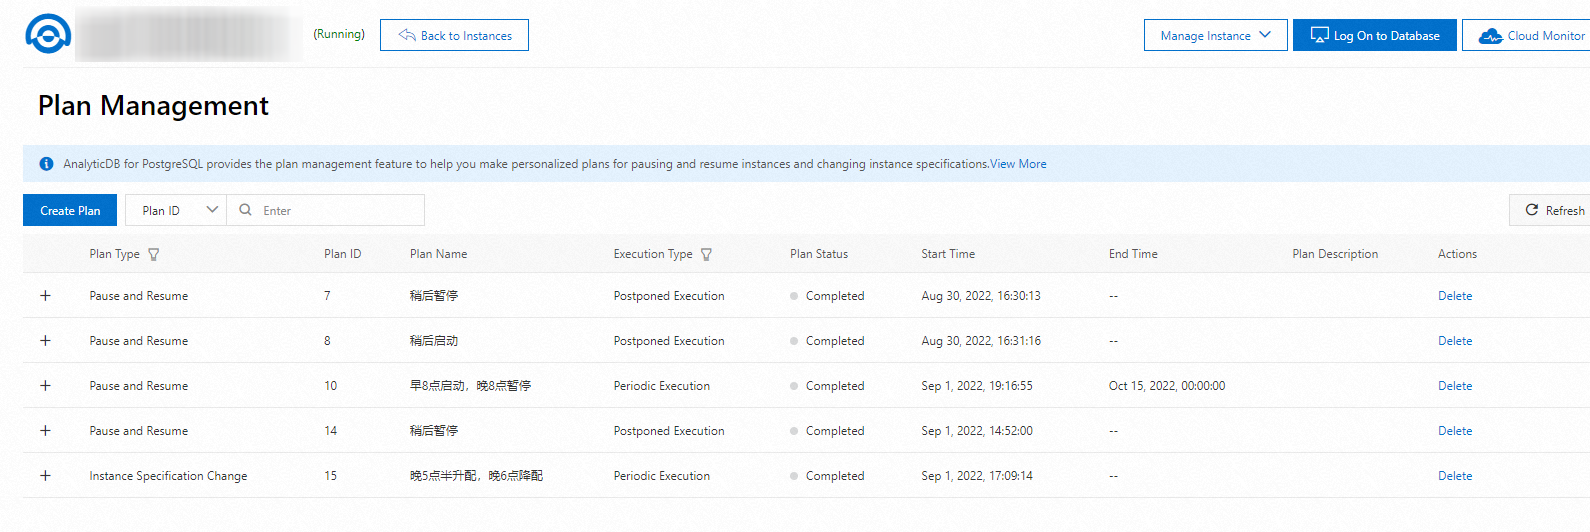
Log on to the AnalyticDB for PostgreSQL console. On the Instance Details page, click Plan Management and then click Create a Planned Task:
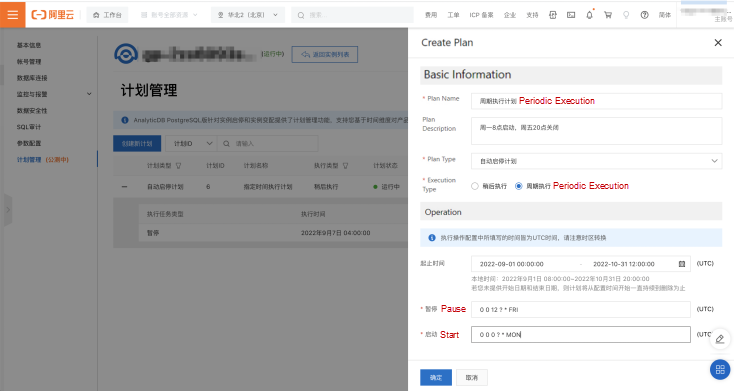
Note: cron expressions are calculated based on UTC and should be converted based on local time. After the planned task is created, the details can be viewed on the Plan List page, including the plan status and planned execution time.

The planned task that has been created can be edited to modify its name, description, and run time.
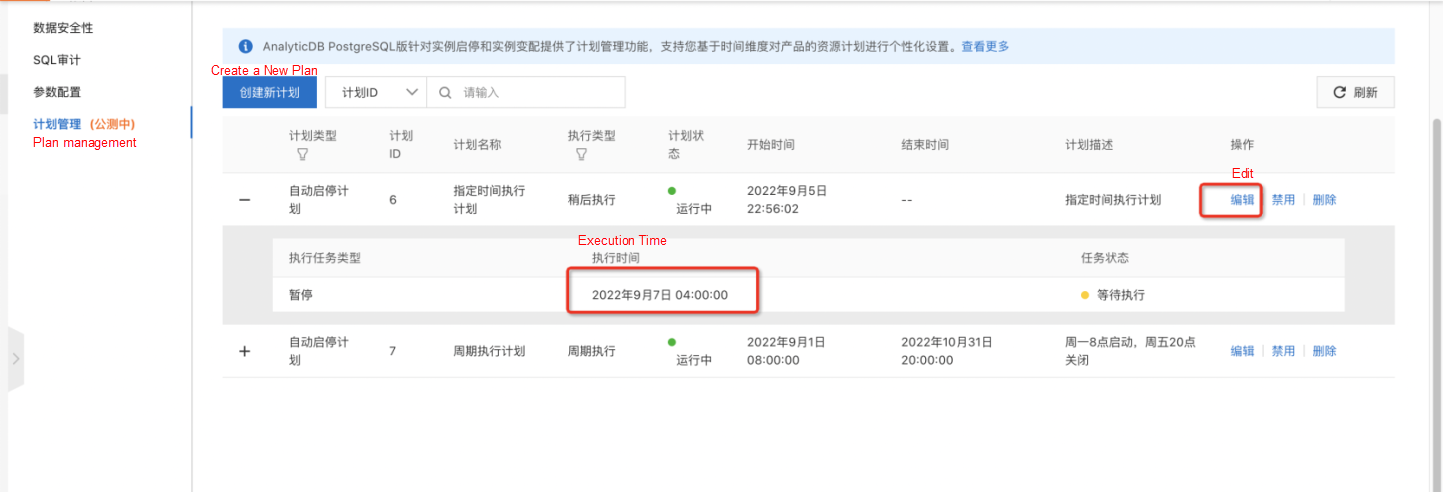
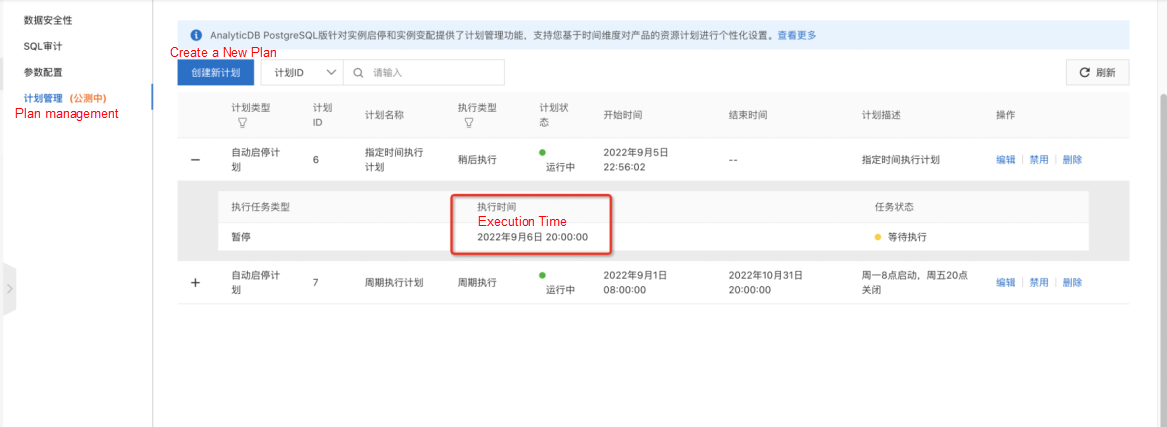
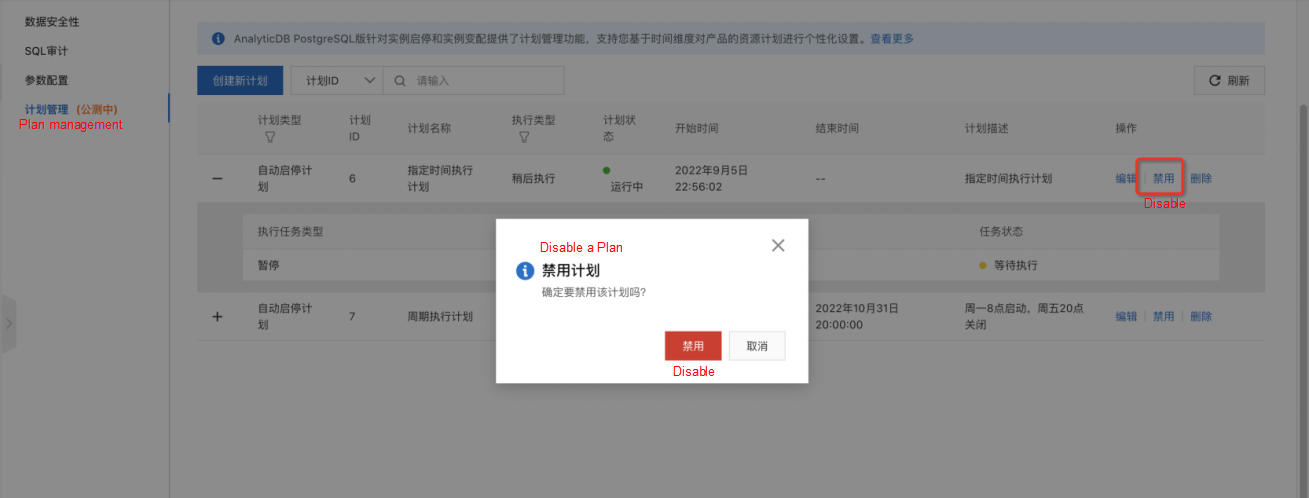
If users do not want to execute a planned task, they can temporarily disable it. When disabled, the planned task status becomes Disabled and will not be executed.

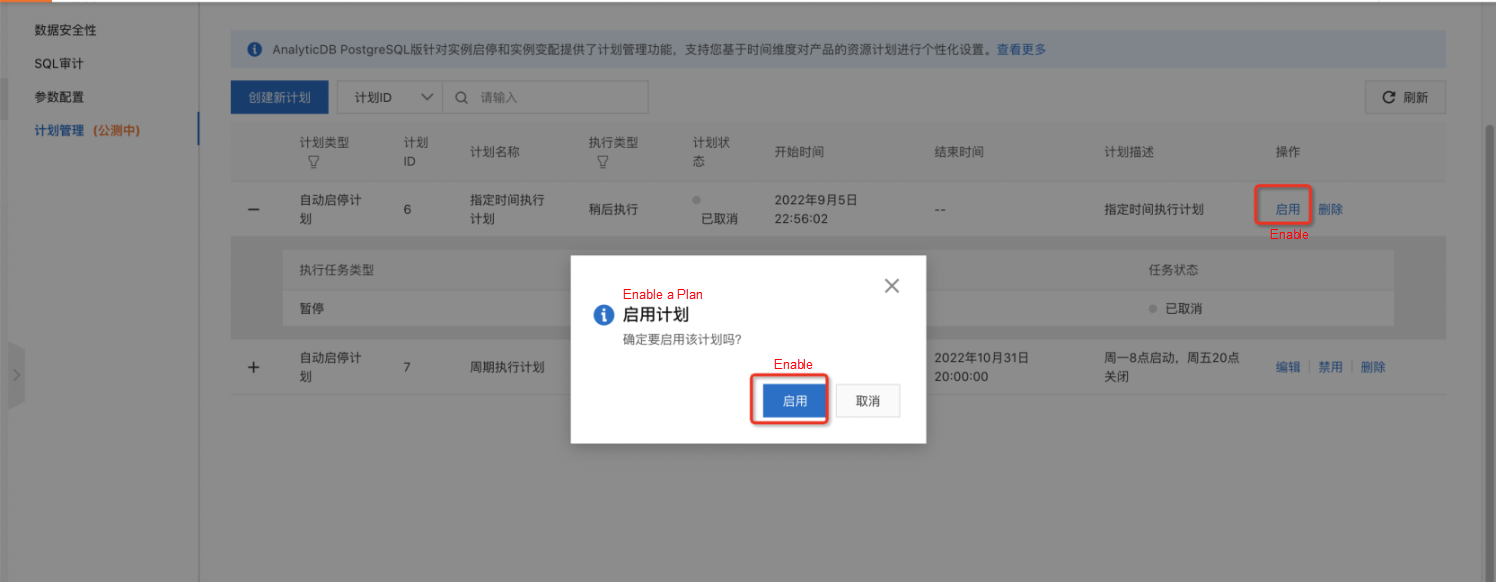
Users can restore disabled plans if they need.
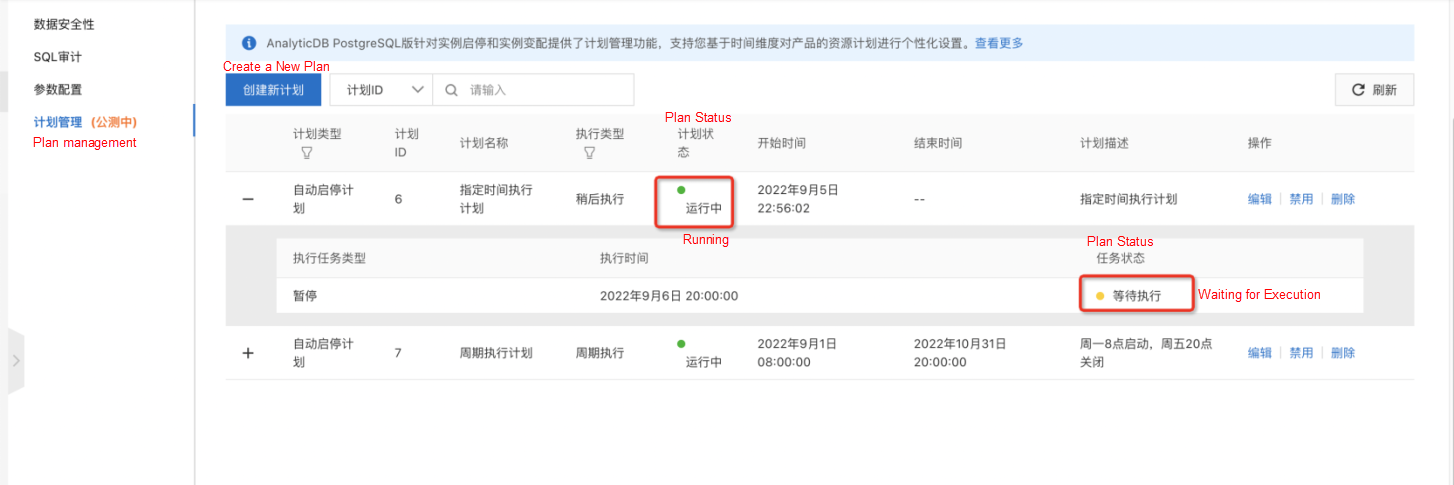
If users no longer want to execute the planned task, they can delete it.
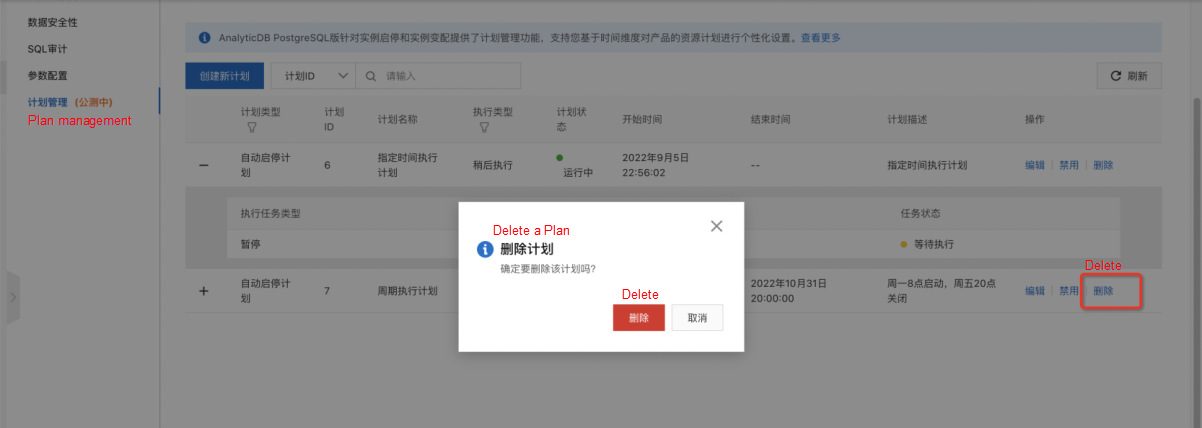
After a planned task is deleted, it will not be seen in the planned list.

The operations of the planned task are displayed in the Notification class event. This allows you to trace the change history. The execution result of the planned task is also displayed in the Notification class event.
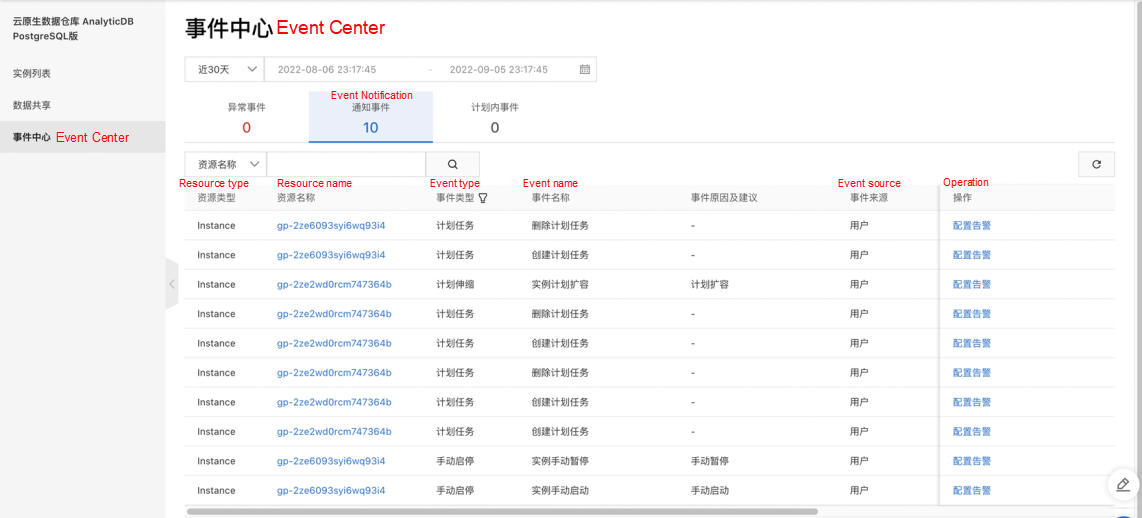
Reducing costs and increasing efficiency has always been the common goal between users and us. From manual start and pause to per-second billing and planned tasks, we continue to polish our product and strive to provide users with cost-effective and easy-to-use cloud-native data warehouse products.
[Best Practice] Instance Pause Released by AnalyticDB for PostgreSQL to Help Optimize Costs
ApsaraDB - February 13, 2023
ApsaraDB - July 20, 2021
ApsaraDB - July 13, 2023
ApsaraDB - January 22, 2021
ApsaraDB - July 19, 2023
ApsaraDB - August 12, 2020
 PolarDB for PostgreSQL
Alibaba Cloud PolarDB for PostgreSQL is an in-house relational database service 100% compatible with PostgreSQL and highly compatible with the Oracle syntax.
Learn More Hologres
A real-time data warehouse for serving and analytics which is compatible with PostgreSQL.
Learn More Database for FinTech Solution
Leverage cloud-native database solutions dedicated for FinTech.
Learn More Lindorm
Lindorm is an elastic cloud-native database service that supports multiple data models. It is capable of processing various types of data and is compatible with multiple database engine, such as Apache HBase®, Apache Cassandra®, and OpenTSDB.
Learn MoreMore Posts by ApsaraDB