This topic describes how to query and analyze audit logs in the Tablestore console.
Usage notes
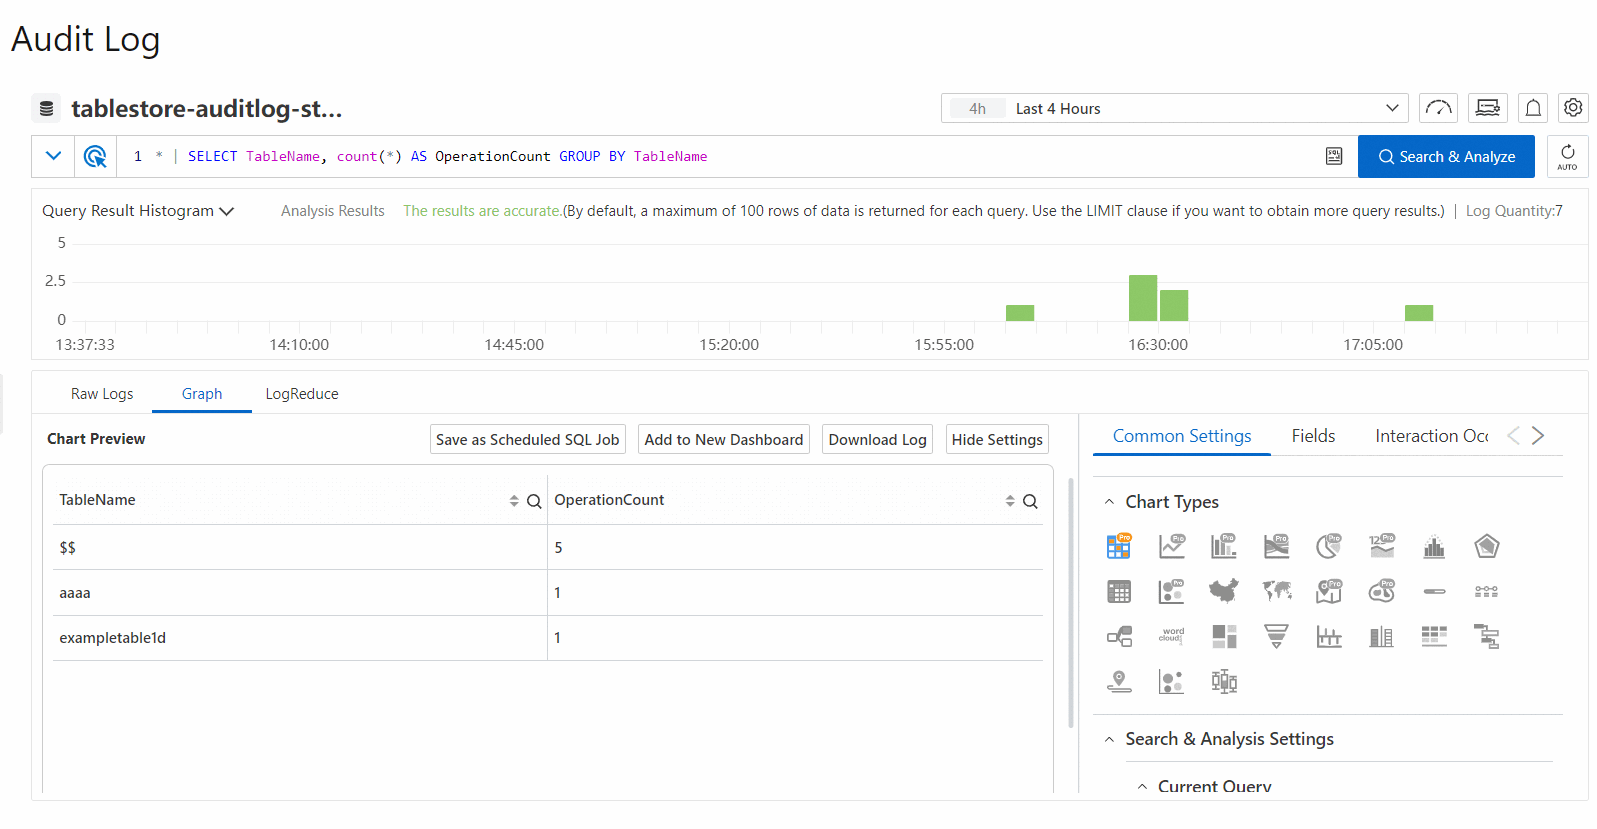
The Tablestore console uses the CreateIndex API operation to check whether secondary indexes are supported. Therefore, the audit logs contain some validation error messages for creating indexes whose names are invalid. In the error messages, the API is CreateIndex, HttpStatus is 400, and TableName is $$. You can ignore these logs. When you query and analyze logs, exclude these detection logs by filtering with the TableName != '$$' condition.
Procedure
The first time you use the audit log feature in the Tablestore console, you must enable the audit log feature. If you have already enabled the audit log feature, you can directly query logs.
Enable the audit log feature
Log on to the Tablestore console.
In the top navigation bar, select a resource group and a region. Then, in the left-side navigation pane, click Audit Log.
NoteThe first time you use the audit log feature, you must follow the on-screen instructions to authorize Simple Log Service to access Tablestore. If you have not activated Simple Log Service, follow the on-screen instructions to activate Simple Log Service.
On the Audit Log page, click Activate Audit Log.
In the Activate Audit Log message, click OK.
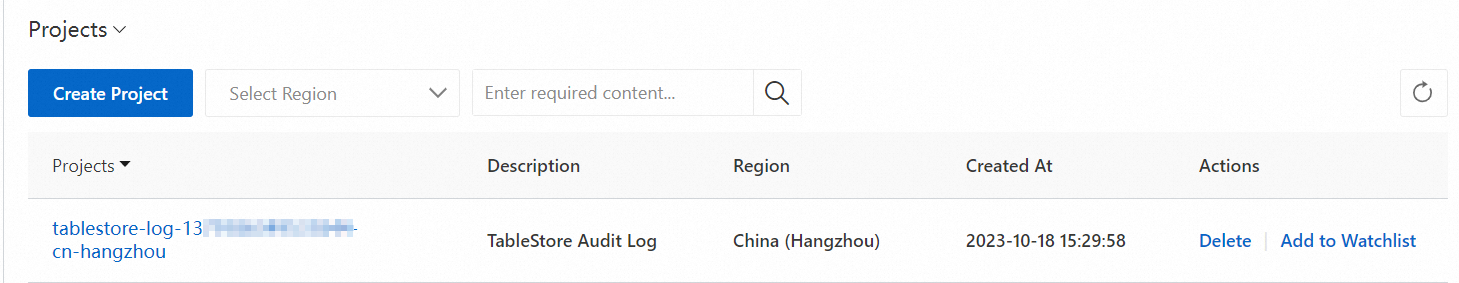
After you enable the audit log feature of Tablestore, a project and a Logstore are automatically created in Simple Log Service in the same region to store the Tablestore audit logs, as shown in the following figure.
 Note
NoteDo not delete the automatically generated project and Logstore in Simple Log Service. Otherwise, the Tablestore audit logs become abnormal.
Query and analyze logs
The Tablestore audit log feature integrates the query and analysis features of Simple Log Service to support second-level queries of billions to hundreds of billions of logs and allow statistical analysis of query results by executing SQL statements.
Log on to the Tablestore console.
In the top navigation bar, select a resource group and a region. Then, in the left-side navigation pane, click Audit Log.
On the Audit Log page, select a time range or enter a query statement, and click Search & Analyze.
A search and analytic statement consists of a search statement and an analytic statement, in the format of search statement|analytic statement. A search statement can be independently executed. An analytic statement must be executed together with a search statement.
Search statement: Used to view, search, and filter log data. You can specify conditions in a search statement to filter data. For example, you can specify a time range, request type, and keyword to filter data sets. A search statement can be independently executed. For more information, see Search syntax and functions.
Analytic statement: Used to filter, convert, collect statistics about, and aggregate log data. For example, you can calculate the average value of data over a period of time or obtain year-on-year and month-on-month results of log data. An analytic statement must be used together with a search statement, in the format of
search statement|analytic statement. For syntax description, see SQL syntax and functions.
Description of features on the page
Histogram
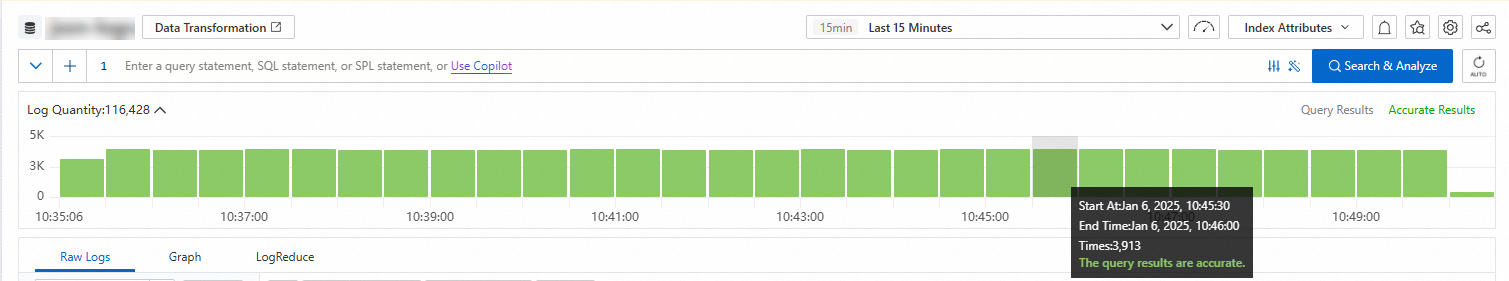
When you move the pointer over a green rectangle, you can view the period of time that is represented by the rectangle and the number of returned logs within the period of time.
If you double-click a green rectangle, you can view log distribution in a finer-grained manner. You can also view the returned logs within the specified period of time on the Raw Logs tab.
Raw logs
Log details

Log field details
Click Table or Raw Data to switch the log format.
 > Download Log: You can download logs to your local computer. For more information, see Download logs.
 > JSON Configurations: Specify the JSON display format and JSON expansion level.
 - > Event Settings: Configure events for raw logs.
 : Copy the log content.
 : Simple Log Service Copilot, used to summarize information based on log content and find error messages.
Displayed Fields
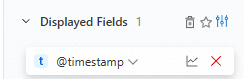
In the Displayed Fields section, click
 next to the target field to remove the indexed field from the Displayed Fields section. The field will no longer be displayed in the log information on the right.
 : Add a view to favorites. After you add fields to the Displayed Fields section, you can add the current view to favorites. You can select the view from the Views drop-down list.
 > Tag Settings: Specify fields as tag fields.
Indexed Fields
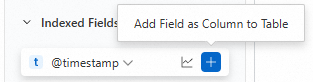
In the Indexed Fields section, click
 next to the target field to add the field to the Displayed Fields section. The field will be displayed in the log information on the right.
 : View information such as Basic Distribution and Statistical Metrics of the field. For more information, see Field settings.
Statistical charts
Charts are the results rendered by Simple Log Service based on query and analysis statements. Simple Log Service provides various chart types such as tables, line charts, and column charts. After you execute a query and analysis statement, you can view the visualized query and analysis results on the Graph tab.
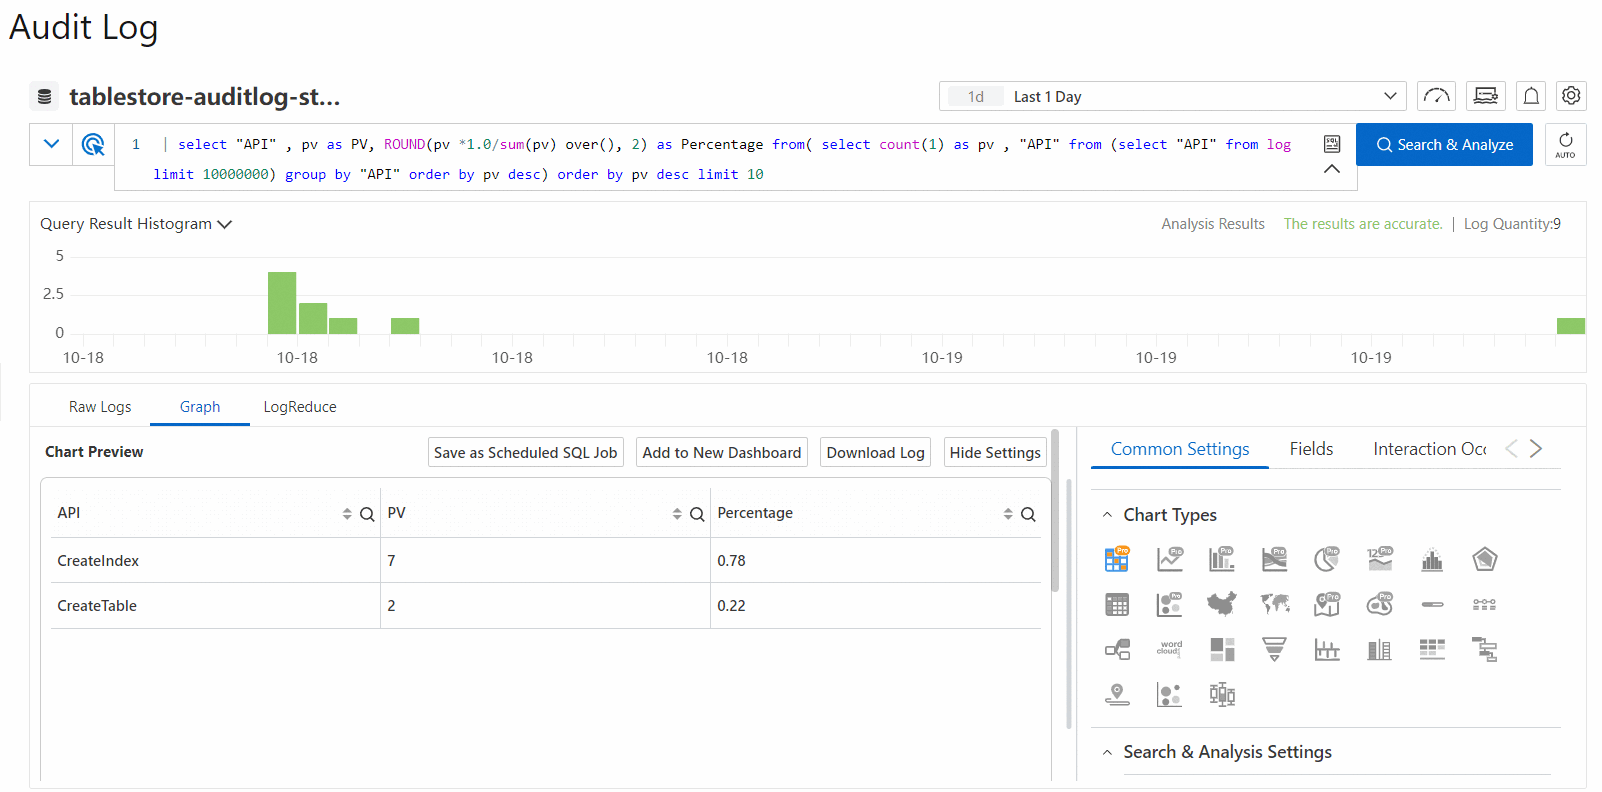
Description of other features on the Graph tab:
Add to New Dashboard: A dashboard is a real-time data analysis panel provided by Simple Log Service. You can click Add to New Dashboard to save the query and analysis results as a chart to the dashboard. For more information, see Overview of visualization.
Save as Scheduled SQL Job: Simple Log Service provides the Scheduled SQL feature to periodically analyze data, store aggregated data, and project and filter data. For more information, see How Scheduled SQL works.
Interaction Occurrences: Interaction occurrences are an essential feature in data analysis, which allows you to change the hierarchy of data dimensions and transform the granularity of analysis to obtain more detailed information from the data. For more information, see Configure an interaction occurrence for a dashboard to perform drill-down analysis.
LogReduce
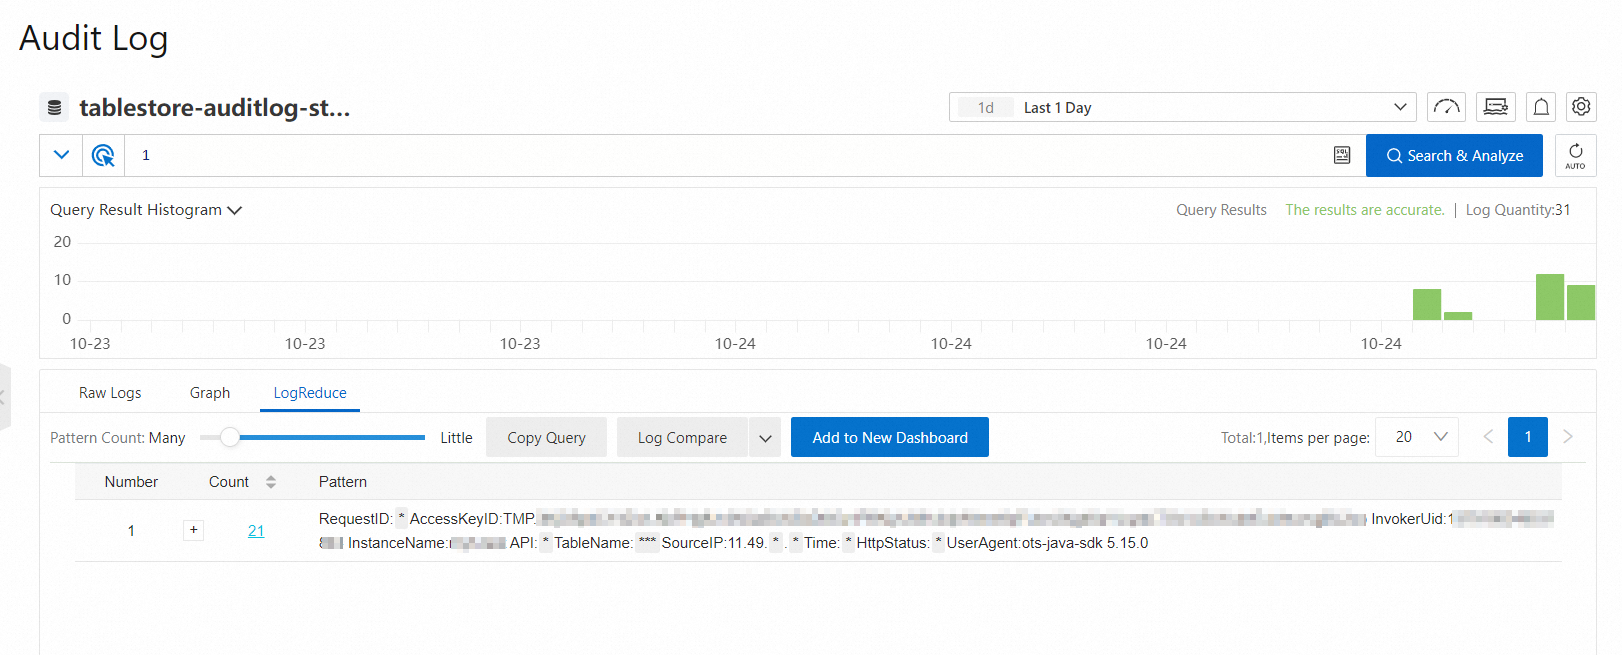
On the LogReduce tab, click Enable LogReduce to aggregate logs with high similarity when logs are collected. For more information, see LogReduce.
SQL enhancement

Click the  icon and select SQL Enhancement or Completely Accurate to enable the Dedicated SQL feature. If you use the Standard SQL feature to analyze a large amount of data that is generated over a period of time, Simple Log Service cannot analyze all data in a single query request. You can enable the Dedicated SQL feature to increase computing resources and the amount of data that can be analyzed in a single query request. For information about how to specify that Dedicated SQL is enabled by default, see Dedicated SQL: Trillion-level log query optimization solution.
Alert

Click the  icon in the upper-right corner to save the query and analysis results as an alert. For more information, see Configure an alert rule in Simple Log Service.
Billing
When you use the Tablestore audit log feature, a Logstore is created in Simple Log Service to store logs and Simple Log Service is used to to query and analyze logs. You are charged for storage usage and other resource usage by Simple Log Service. For more information, see Billing overview.