💡Are you still worried about the observability transformation of Go applications?
💡Are you still performing manual tracking, modifying code, or importing SDKs?
💡Are you still worried about tracking points affecting performance? Today, we are bringing a solution with zero-code modification-Loongsuite Go agent, allowing your Go application to automatically obtain end-to-end observability capabilities at compile-time!🚀
In the microservices model, observability has become an essential capability for application O&M. However, traditional observability solutions often face three major pain points:
According to statistics, traditional tracking plans require developers to spend 20-30% of their time on monitoring code, and it is very error-prone.
Traditional tracking solutions require developers to manually insert monitoring code into the business code:
// Traditional method: Manual tracking is required.
func handleRequest(w http.ResponseWriter, r *http. Request) {
// Manually create a span.
ctx, span := tracer.Start(r.Context(), "handleRequest")
defer span.End()

// Business logic
result := doSomething()

// Manually record attributes
span.SetAttributes(attribute.String("result", result))
}
This method raises the following issues:
● Code pollution: Business code and monitoring code are mixed together.
● High maintenance costs: The monitoring code must be updated each time the business logic is modified.
● Easy to omit: Developers may forget to add tracking points to some critical paths.
For an existing Go application, if you want to integrate observability, you usually need to:
● Import the OpenTelemetry SDK
● Modify each key function and add tracking code
● Configure the exporter and sampling policy.
● Test to verify that the tracking point is correct.
This process can take days or even weeks of workload.
Although runtime tracking is flexible, it incurs certain performance overhead:
● The tracking logic must be executed for each call.
● Serialization, network transmission, and other operations
● may affect application performance.
The Loongsuite Go agentuses compile-time instrumentation technology to automatically inject monitoring code during the compilation phase, achieving true zero-code modification..
This is an enterprise-level Go application observability solution open-sourced by Alibaba, which has been used on a large scale in the production environment.
You only need to add the otel prefix before go build without modifying any business code:
# Traditional method
go build -o app cmd/app

# Use the Loongsuite Go agent
otel go build -o app cmd/app
It is that simple! Your application automatically obtains end-to-end observability capabilities.
The tool automatically detects the frameworks and libraries you use and injects the corresponding monitoring code:
● HTTP frameworks: Gin, Echo, Fiber, FastHTTP, and Hertz
● RPC frameworks: gRPC, Dubbo-go, Kitex, and Kratos
● Databases: Database/SQL, GORM, MongoDB, and Elasticsearch
● Caches: go-redis and redigo
● Logstores: Zap, Logrus, Slog, and Zerolog
● AI frameworks: LangChain and Ollama
● More: Supports more than 50 mainstream Go frameworks and libraries.
Compile-time instrumentation means:
● Low runtime overhead: Monitoring code is already optimized at compile time.
● No reflection overhead: Does not rely on runtime reflection mechanisms.
● Production-ready: Validated in large-scale production environments.
Recently, we implemented automatic instrumentation support for the official Model Context Protocol (MCP) Go SDK. MCP is a protocol introduced by companies such as Google and Anthropic. It is used to integrate LLM applications with external data sources and tools, becoming increasingly important in AI application development.
With the rapid development of AI applications, more and more developers are using the MCP protocol to build LLM applications. However, the observability of MCP applications has always been a challenge:
● Complex protocol: MCP supports multiple operations (such as tools/call, resources/read, and prompts/get).
● Middleware mechanism: The official SDK provides middleware, but users may not actively use it.
● Time measurement: It is necessary to accurately measure the complete time of requests and responses.
We adopted the strategy of automatic injection during initialization. Monitoring middleware is automatically injected when NewServer and NewClient are created, ensuring 100% coverage.
The official MCP SDK provides a comprehensive middleware mechanism, but how to automatically inject monitoring middleware without modifying user code is a technical challenge.
We adopted the strategy of automatic injection during initialization:
// Automatically inject monitoring middleware when NewServer is created.
func afterNewServer(call api.CallContext, s *mcp.Server) {
    if s == nil {
        return
    }
    // Automatically inject monitoring middleware.
    monitoringMiddleware := createServerMonitoringMiddleware()
    s.AddReceivingMiddleware(monitoringMiddleware)
}

// Automatically inject monitoring middleware when NewClient is created.
func afterNewClient(call api.CallContext, c *mcp.Client) {
    if c == nil {
        return
    }
    // Automatically inject monitoring middleware.
    monitoringMiddleware := createClientMonitoringMiddleware()
    c.AddReceivingMiddleware(monitoringMiddleware)
}In this way, we achieved:
User code does not need to be modified at all:
// User code: Create an MCP server.
server := mcp.NewServer(&mcp.Implementation{
    Name: "my-server",
    Version: "1.0.0",
}, nil)

// Add a tool for normal use.
mcp.AddTool(server, &mcp.Tool{
    Name: "greet",
    Description: "Say hi",
}, handler)

// Run the server.
server.Run(ctx, transport)
After compilation using otel go build, all MCP requests are automatically monitored, including:
● Client invoking tools (tools/call)
● Read resources (resources/read)
● Retrieving prompts (prompts/get)
● Initializing connections (initialize)
The Loongsuite Go agent adds two key phases during compile-time:
Traditional Go compilation flow:
Source code parsing → Type checking → Semantic analysis → Code optimization → Code generation → Linking

Use the Loongsuite Go agent:
Preprocessing → Instrumentation → Source code parsing → Type checking → Semantic analysis → Code optimization → Code generation → Linking● go:linkname: Linking the instrumentation function to the namespace of the target package.
● AST operation: Modify the abstract syntax tree to inject monitoring code.
● Rule-driven: Define instrumentation behavior via JSON rule files.
Based on framework attributes, we support multiple instrumentation methods:
# Linux/MacOS (Recommended)
sudo curl -fsSL https://cdn.jsdelivr.net/gh/alibaba/loongsuite-go-agent@main/install.sh | sudo bash

# Or download manually
wget https://github.com/alibaba/loongsuite-go-agent/releases/latest/download/otel-linux-amd64
chmod +x otel-linux-amd64
sudo mv otel-linux-amd64 /usr/local/bin/otel# Just prefix the go build with otel.
otel go build -o app cmd/app# Export to Jaeger (development environment)
export OTEL_EXPORTER_JAEGER_ENDPOINT=http://localhost:14268/api/traces
# Or export to OTLP (production environment)
export OTEL_EXPORTER_OTLP_ENDPOINT=http://localhost:4317./appIt's that simple! Your application is now equipped with end-to-end observability capabilities.🎉
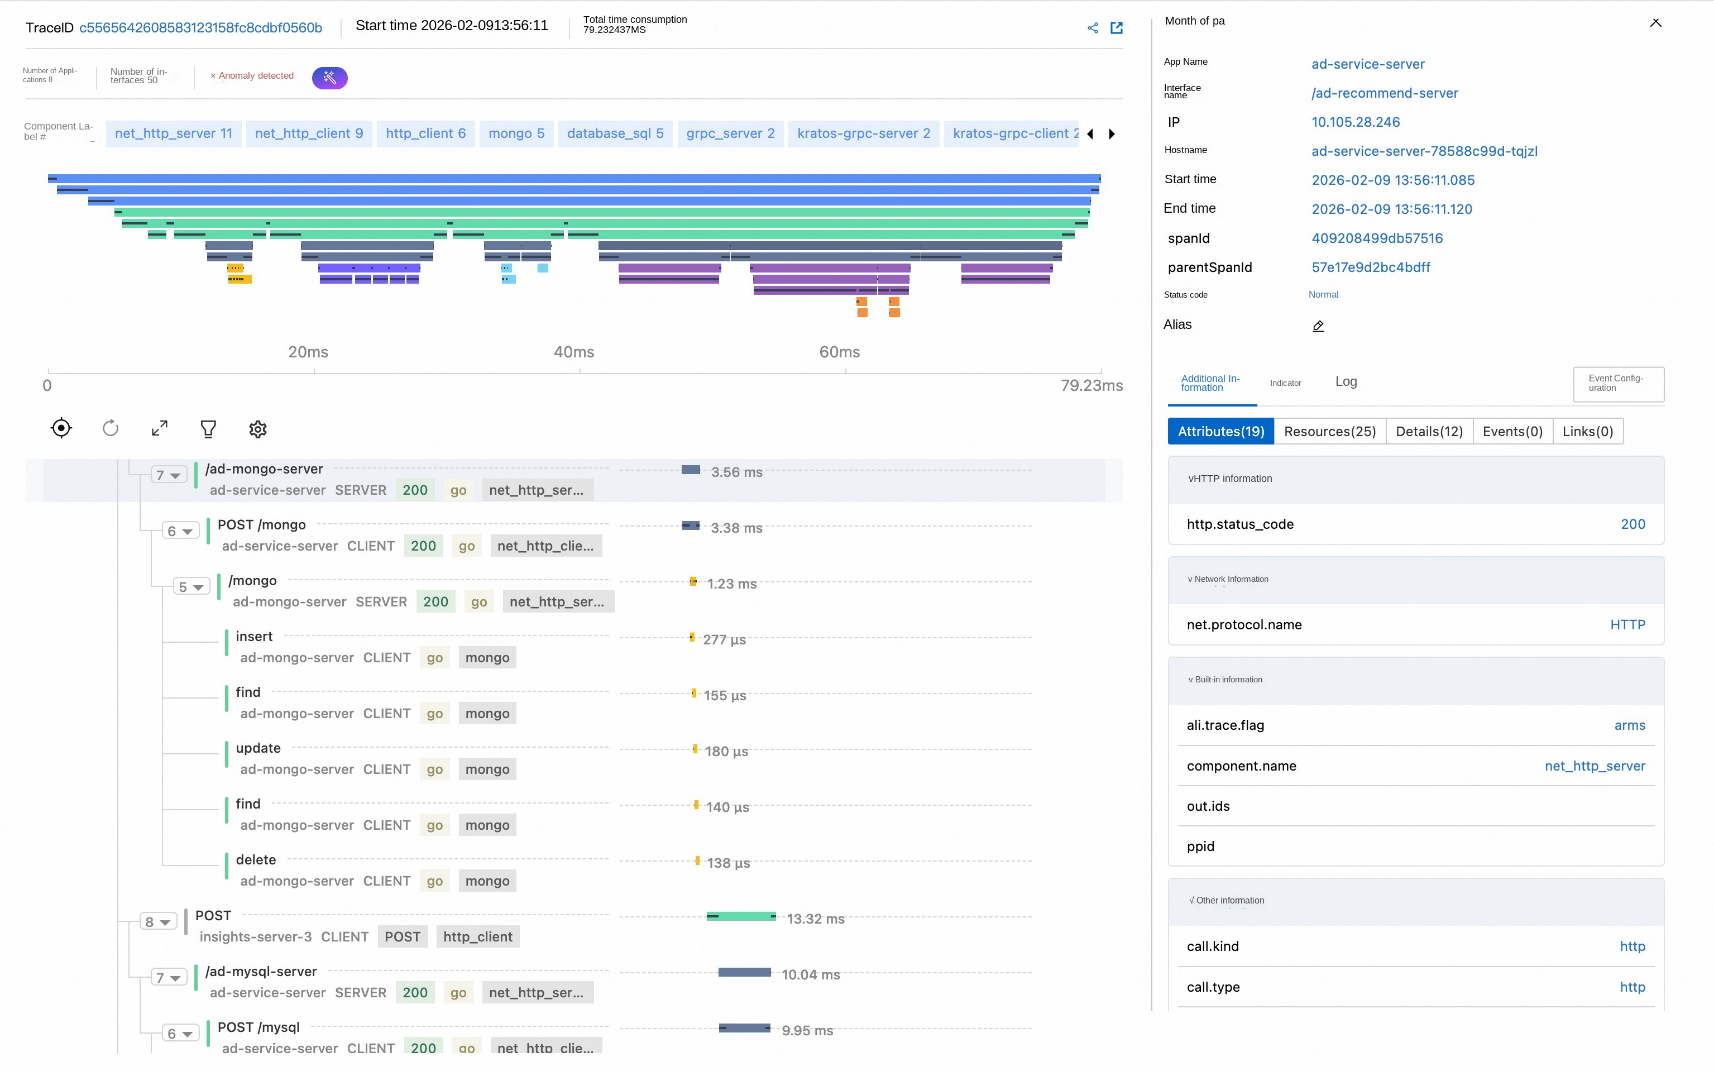
After use, you can see the following on Jaeger, Zipkin, or other observability platforms that support OpenTelemetry:
● ✅Complete invocation chain: From HTTP requests to database queries, everything is clear at a glance.
● ✅Detailed performance metrics: duration and error rate of each operation
● ✅Rich contextual information: request parameters, response results, and error messages
The tool supports multiple export methods. You only need to configure environment variables:
| Export method | Environment variable | Scenario |
|---|---|---|
| Jaeger | OTEL_EXPORTER_JAEGER_ENDPOINT | Developer/staging environment |
| OTLP | OTEL_EXPORTER_OTLP_ENDPOINT | Production environment (recommended) |
| Console | OTEL_EXPORTER_CONSOLE=true | Debugging/Demo |
| Prometheus | OTEL_EXPORTER_PROMETHEUS_PORT | Metric monitoring |
For more information about the configuration options, see Official documentation.
The Loongsuite Go agent supports 50+ mainstream Go frameworks and libraries, including:
| Category | Framework example |
|---|---|
| HTTP framework | Gin, Echo, Fiber, FastHTTP, Hertz, Iris, Mux |
| RPC framework | gRPC, Dubbo-go, Kitex, Kratos, TRPC-go |
| Database | database/sql, GORM, MongoDB, Elasticsearch, Cassandra |
| Cache | go-redis, redigo |
| Log | Zap, Logrus, Slog, Zerolog, go-kit/log |
| AI framework | LangChain, Ollama, OpenAI SDK, MCP |
| Message queue | Kafka (Sarama, Segmentio) |
| Service governance | Sentinel, Nacos |
For more information, see GitHub repository.
Performance advantages brought by compile-time instrumentation:
| Metric | Traditional runtime instrumentation | Loongsuite Go Agent |
|---|---|---|
| Runtime overhead | 5-10% | < 3% |
| Compile time increase | 0% | ~20% |
| Code intrusive | High | Zero |
| Maintenance cost | High | Low |
Benefits:
● ✅Low runtime overhead: Monitoring code is optimized at compile-time, and no runtime reflection is required.
● ✅Production verification: It has been verified in large-scale production environments of companies such as Alibaba.
● ✅Performance-friendly: According to benchmarks, the application performance overhead after instrumentation is usually less than 3%.
💡Note: Although the compile time increases, this only occurs during the developer/build phase and does not affect runtime performance.
● GitHub: https://github.com/alibaba/loongsuite-go-agent
● Document: https://alibaba.github.io/loongsuite-go-agent/
● DingTalk group: 102565007776
● GitHub issues: Feedback on questions and suggestions
● Contribution code: Welcome to submit pull requests.
| Attribute | Traditional manual tracking | Loongsuite Go Agent |
|---|---|---|
| Code modification | Requires extensive modifications | ✅ Zero-code modification |
| Development time | Days to weeks | ✅ 5 minutes |
| Maintenance cost | High (synchronous update required) | ✅ Low (automatic maintenance) |
| Coverage | Easy to miss | ✅ 100% coverage |
| Performance overhead | 5-10% | ✅ < 3% |
| Framework support | Requires individual implementation | ✅ 50+ frameworks automatically supported |
● 🌟GitHub: https://github.com/alibaba/loongsuite-go-agent
● 📖Document: https://alibaba.github.io/loongsuite-go-agent/
● 💼Commercial edition: https://www.alibabacloud.com/help/arms/application-monitoring/user-guide/monitoring-the-golang-applications/
● 💬DingTalk group: 102565007776
If you find it useful, welcome to star⭐ and share!
References:
● GitHub: https://github.com/alibaba/loongsuite-go-agent
● Document: https://alibaba.github.io/loongsuite-go-agent/
● Commercial edition: https://www.alibabacloud.com/help/arms/application-monitoring/user-guide/monitoring-the-golang-applications/
Revelations from the AI Open-Source Library Poisoning Event and Alibaba Cloud AI Gateway’s Answer
RUM Practice: Android Network Performance Optimization with Data

786 posts | 60 followers
FollowAlibaba Cloud Native Community - September 18, 2026
Alibaba Cloud Native Community - September 4, 2025
Alibaba Cloud Native Community - July 7, 2026
Alibaba Cloud Native Community - April 9, 2026
Alibaba Cloud Native Community - July 28, 2026
Alibaba Cloud Native Community - September 8, 2026
786 posts | 60 followers
Follow QwenWork
QwenWork is dedicated to helping employees strengthen their professional competitiveness in the AI era and to enabling enterprises to improve organizational effectiveness.
Learn More Token Plan
Build more, spend less. One plan, every modality.
Learn More
Alibaba Cloud Model Studio
A one-stop generative AI platform to build intelligent applications that understand your business, based on Qwen model series such as Qwen-Max and other popular models
Learn More DevOps Solution
Accelerate software development and delivery by integrating DevOps with the cloud
Learn MoreMore Posts by Alibaba Cloud Native Community

