Publish
Encrypt and publish
Authenticate by dynamic token
Copy and transfer
Accept transfer
DataV is a powerful yet accessible data visualization tool, featuring geographic information systems allowing for rapid interpretation of data to understand relationships, patterns, and trends. All packed into a user-friendly interface.
By integrating live dashboards, DataV can present and monitor business data simultaneously. This data-driven approach enables for well-organized data mining and analysis allowing the user to seize new opportunities that otherwise might remain hidden.
Benefits

-
Presentation
Showcase business performance data in a variety of settings such as investor relation meetings, press releases, exhibitions, and quarterly reports.

-
Monitoring
Drive business growth with data. Tools such as real-time business and operation data monitoring can offer your business early warnings for a rapid response.

-
Decision-making
The live presentation of multi-dimensional data will enable you to discover the value of data and not miss any opportunities.

-
Easy to Use Interface
Create professional visualizations with limited programming skills courtesy of simple visual configuration widgets and interface that you can manage with the click of a mouse.
Features
-


Templates for Any Scenario
DataV provides a wide range of templates for all types of scenarios such as control centers, geographic analysis, real-time monitoring, and operation analytics, all of which require minimal customization, meaning you can design and render high-quality visual representations without the aid of a designer.
-


Diverse Visualization Widget Library
In addition to basic charts, DataV can recognize a wide range of spatial and non-spatial file formats and can represent data spatially for geographic points and locations, route and trip data as well as heat maps and scatterplots. Alongside 2D and 3D capabilities, third-party chart libraries such as ECharts and AntV-G2 also integrate flawlessly with DataV.
-


Wide Range of Databases and Data Formats
Connect to numerous databases including Alibaba Cloud‘s AnalyticDB, ApsaraDB for RDS and APIs with the support of dynamic requests. DataV also recognizes static data in CSV and JSON formats.
-


User-friendly Interface
With its visual interface and configuration widgets, users can create professional visualizations with a click of a mouse. Very little programming is required.
-


Interactive Data Analysis
Simple and efficient method to configure interactions between components, enabling interactive data analysis by transferring parameters from one component to another.
-


Simple Publishing and Editing
Projects can be published as web pages and secured with passwords or access tokens. For split-screen displays, rendering optimization improves display resolution.
How it works
-
Smart Factory

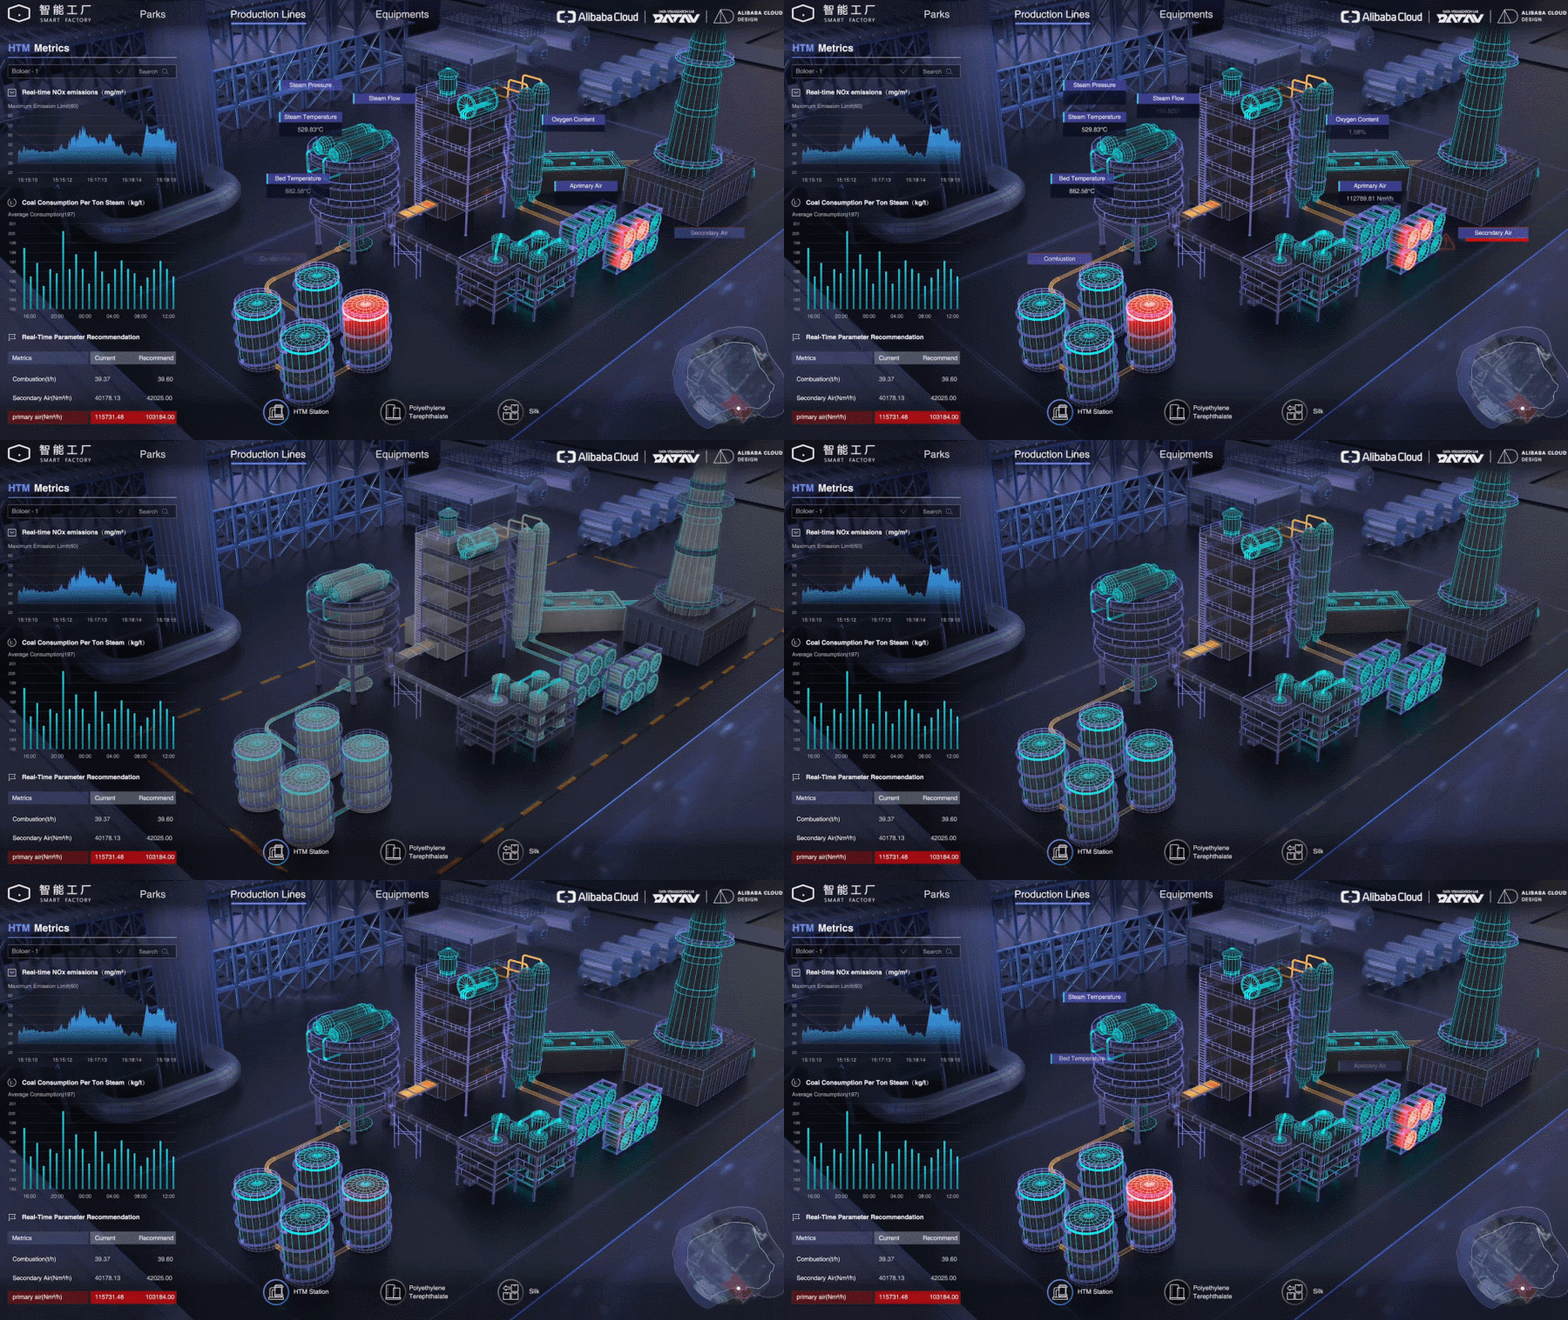
Smart Factory
Data visualization for production in smart factories
This DataV visualization project provides a full representation of the production parameters in each phase of a smart factory. The system also collects work data of each production line or workshop to a centralized control center to implement production control. This project gives managers insight into operations of each production phase, minimizes potential errors in production procedures, and provides a graphical interface to facilitate remote monitoring and management.
Pricing
DataV provides 3 editions for public cloud users: Basic Edition Enterprise Edition and Professional Edition. Prices and detailed features are listed as follows.
-
Publish and sharing
-
Available module
-
Data source
-
Chart widget
-
Custom widget
-
Interaction
-
Advanced feature
-
- Feature Details
-
-
Template
Workspace
Project
Projects extensible -
Basic data source
Advanced data source -
Basic widget
Geographical widget
ECharts widget -
Widget upload
Widget package authorization
Graphic developer tool -
Callback ID
Bound variable
Basic interaction widget
Professional interaction widget -
Group, hide, and lock widgets
Add widgets to favorites
Add widget groups to favorites or other groups
Node-based programming -
- Basic Edition
-
-
basic
5
-
-
-
-
-
-
$360.00USD/Yr.
- Enterprise Edition
-
-
Advanced
2
20
-
-
-
3
-
-
20
-
$3600.00USD/Yr.
- Professional Edition
-
-
Advanced
5
40
-
-
-
unlimited
-
-
40
-
$9000.00USD/Yr.
Upgraded Support For You
1 on 1 Presale Consultation, 24/7 Technical Support, Faster Response, and More Free Tickets.

1 on 1 Presale Consultation

24/7 Technical Support

6 Free Tickets per Quarter
