Resource Manager是PolarDB用于实时监控集群的CPU使用率和内存使用率的一种监控功能,支持用户线程和资源组两种资源监控维度。您可以通过实时监控CPU和内存使用率,了解系统运行的实时状况,区分系统压力来源,通过业务调度将压力合理分散。本文将介绍如何使用Resource Manager功能。
前提条件
PolarDB集群版本需为PolarDB MySQL版8.0版本且内核小版本需为8.0.2.1.0或以上。
说明 关于如何升级内核小版本请参见小版本管理。
注意事项
- 开启线程池(Thread Pool)功能会导致CPU和内存统计不准确,因此暂不支持将Resource Manager的开关参数resource_group_enabled和线程池(Thread Pool)开关参数loose_thread_pool_enabled同时开启。
- 暂不支持自定义资源组配置,所有的用户线程连接成功后都归属于
user_default资源组,系统后台线程则归属于sys_default资源组。
参数配置
Resource Manager监控功能支持配置以下参数:
说明
- 启用Resource Manager的监控功能需要将resource_group_enabled、performance_schema和cpu_usage_capture_enabled3个参数都设置为ON。
- 设置resource_group_enabled、performance_schema和cpu_usage_capture_enabled3个参数后,需要重启集群内所有节点新参数值才会生效,重启前请做好业务安排,谨慎操作。
| 参数 | 取值范围 | 说明 |
| resource_group_enabled |
ON或OFF 默认值为OFF |
是否开启Resource Group功能。 |
| performance_schema |
ON或OFF 默认值为OFF |
是否开启Performance Schema功能。 |
| cpu_usage_capture_enabled |
ON或OFF 默认值为OFF |
是否开启CPU使用率采集功能。 |
| cpu_usage_capture_interval |
100~1000 默认值为500 |
CPU使用率采集间隔,单位为毫秒。 该参数表示相邻的两次CPU使用率采样操作的最小时间间隔。 |
| cpu_usage_summarize_interval |
1000~ULONG_MAX 默认值为2000 |
CPU使用率统计间隔,单位为毫秒。 该参数表示查询结果中展示的CPU使用率是过去多长时间内的平均CPU使用率。 |
| performance_schema_minimal |
ON或OFF 默认值为OFF |
是否开启将performance_schema的内存使用最小化。 performance_schema设置为ON后,默认会启用很多性能相关的信息统计,对性能影响较大。因此,若您希望减少performance_schema参数对系统性能的影响,建议您将performance_schema_minimal参数设置为ON。 说明 仅当performance_schema设置为ON时,才支持配置该参数。 |
资源监控
- 您可以使用如下命令查询线程的资源使用情况:
call db_resource_manager.show_processlist(); call db_resource_manager.show_processlist_verbose();说明- 使用
show_processlist命令时,查询结果不会单独显示子线程的信息,而是将并行子线程使用的资源加到主线程上统一显示,CPU使用率可能会超过100%。 show_processlist_verbose会独立展示子线程信息。
mysql> call db_resource_manager.show_processlist(); +------+------+-----------------+------+---------+------+-----------+-----------+----------------+-----------+---------+-----+----------------------------------------------+ | ID | USER | HOST | DB | COMMAND | TIME | STATE | PARENT_ID | RESOURCE_GROUP | CPU_RATIO | MEM | DOP | INFO | +------+------+-----------------+------+---------+------+-----------+-----------+----------------+-----------+---------+-----+----------------------------------------------+ | 7 | root | 127.0.0.1:47983 | test | Query | 0 | starting | NULL | USR_default | 0.00 | 455273 | 1 | call db_resource_manager.show_processlist() | | 12 | root | 127.0.0.1:53189 | tpch | Query | 51 | executing | NULL | USR_default | 380.86 | 1238314 | 4 | select | | | | | | | | | | | | | | l_returnflag, | | | | | | | | | | | | | | l_linestatus, | | | | | | | | | | | | | | sum(l_quantity) as sum_qty, | | | | | | | | | | | | | | sum(l | +------+------+-----------------+------+---------+------+-----------+-----------+----------------+-----------+---------+-----+----------------------------------------------+ 2 rows in set (0.00 sec) mysql> call db_resource_manager.show_processlist_verbose(); +------+------+-----------------+------+---------+------+-----------+-----------+----------------+-----------+--------+-----+----------------------------------------------+ | ID | USER | HOST | DB | COMMAND | TIME | STATE | PARENT_ID | RESOURCE_GROUP | CPU_RATIO | MEM | DOP | INFO | +------+------+-----------------+------+---------+------+-----------+-----------+----------------+-----------+--------+-----+----------------------------------------------+ | 7 | root | 127.0.0.1:47983 | test | Query | 0 | starting | NULL | USR_default | 0.02 | 455273 | 1 | call db_resource_manager.show_processlist_verbose() | | 12 | root | 127.0.0.1:53189 | tpch | Query | 53 | executing | NULL | USR_default | 0.00 | 521446 | 4 | select | | | | | | | | | | | | | | l_returnflag, | | | | | | | | | | | | | | l_linestatus, | | | | | | | | | | | | | | sum(l_quantity) as sum_qty, | | | | | | | | | | | | | | sum(l | | 13 | root | 127.0.0.1:53189 | tpch | Query | 53 | executing | 12 | USR_default | 96.71 | 192442 | 1 | NULL | | 14 | root | 127.0.0.1:53189 | tpch | Query | 53 | executing | 12 | USR_default | 93.13 | 185954 | 1 | NULL | | 15 | root | 127.0.0.1:53189 | tpch | Query | 53 | executing | 12 | USR_default | 94.73 | 183398 | 1 | NULL | | 16 | root | 127.0.0.1:53189 | tpch | Query | 53 | executing | 12 | USR_default | 96.73 | 196194 | 1 | NULL | +------+------+-----------------+------+---------+------+-----------+-----------+----------------+-----------+--------+-----+----------------------------------------------+ 6 rows in set (0.00 sec)您还可以使用如下查询命令,对查询结果进行过滤和排序:select * from information_schema.processlist_verbose order by cpu_ratio desc limit 10; select * from information_schema.processlist_verbose where time > 60 order by mem desc - 使用
- 您可以使用如下命令查询当前系统中所有的资源组以及资源组的配置情况:
select * from information_schema.resource_group;说明 查询前,需先设置参数resource_group_enabled为ON。更多信息,请参见参数配置。
性能影响
Resource Manager功能开启后,会对PolarDB集群性能产生些许影响,同时由于performance_schema开启后,默认会启用很多性能相关的信息统计,对性能影响较大。
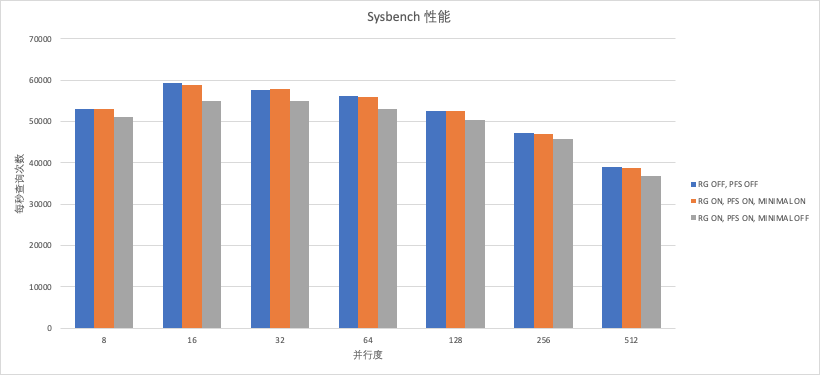
从以上Sysbench性能测试结果可以看出:
- 当开启Resource Manager监控功能(即performance_schema和resource_group_enabled参数均设置为ON)且performance_schema_minimal 参数设置为OFF,相比未开启Resource Manager监控(即performance_schema和resource_group_enabled均保持默认值OFF),此时对性能影响较大,性能下降幅度约为8%。
- 当开启Resource Manager监控功能(即performance_schema和resource_group_enabled均设置为ON),但performance_schema_minimal设置为ON时,相比未开启Resource Manager监控(即performance_schema和resource_group_enabled均保持默认值OFF),此时对性能影响较小,性能下降幅度约为2%。
说明
- 若需要减少performance_schema参数对系统性能的影响,建议您将performance_schema_minimal参数设置为ON。
- 上述测试中使用了Sysbench测试方法,对8核32 GB规格的PolarDB MySQL版集群进行测试。不同实例配置和不同使用场景,对性能的影响程度会存在差别。