调用链分析支持三种查询方式:查询框、查询面板和快捷筛选。查询条件会互相联动,您可以根据个人习惯选择合适的查询方式。
查询框
在调用链分析页面的查询框中直接输入筛选条件。
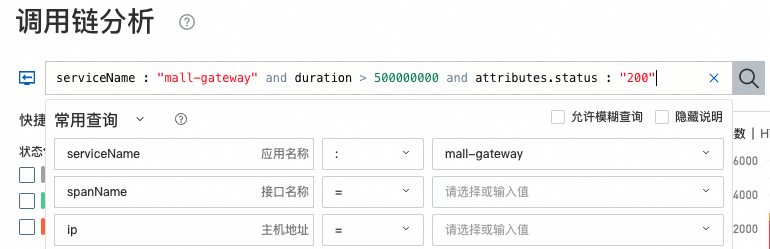
调用链分析兼容日志服务 SLS 查询语句的语法。
如要在筛选条件中使用“*”和“?”通配符查询,请勾选允许模糊查询。
查询条件中duration选项的单位为纳秒,例如需要过滤duration大于500 ms的调用链,则在过滤条件表达式中需要输入
duration >= 500000000。如要查询duration在某个区间的调用链,如0到500 ms的调用链,则输入duration in (0 500000000),默认为左闭右开形式。如要查询Attributes或Resources中的字段,请在查询时添加
attributes.或resources.前缀。
查询语法示例:
查询/components/api/v1/ads/data接口HTTP状态码为500的调用链:
spanName : "/components/api/v1/ads/data" and attributes.http.status_code : 500查询opentelemetry-demo-adservice应用抛出异常的调用链:
serviceName : "opentelemetry-demo-adservice" and attributes.excep.ids : *
查询面板
在调用链分析页面单击查询框,在下拉查询面板中可以指定筛选条件的具体值,并支持添加自定义属性(Attributes)和资源属性(Resources)筛选条件。
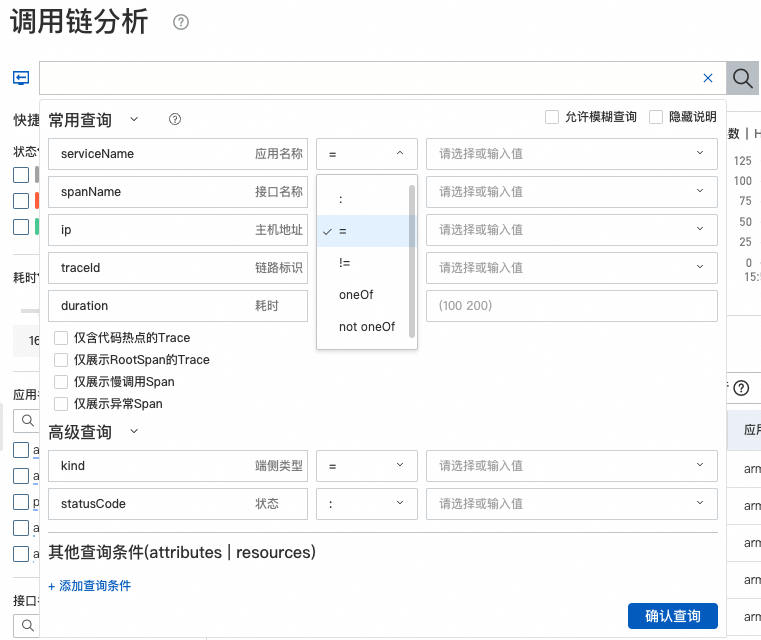
如需使用多选,请将运算符切换为oneOf,并选择多个候选值;如需使用反选(不包含选值中的任何一个),请将运算符切换为not oneOf。
查询条件中duration选项的单位为纳秒,例如需要过滤duration大于500 ms的调用链,则在过滤条件表达式中需要输入
duration >= 500000000。如要查询duration在某个区间的调用链,如0到500 ms的调用链,则输入duration in (0 500000000),默认为左闭右开形式。如果需要查询Attributes和Resources,请单击+添加查询条件。
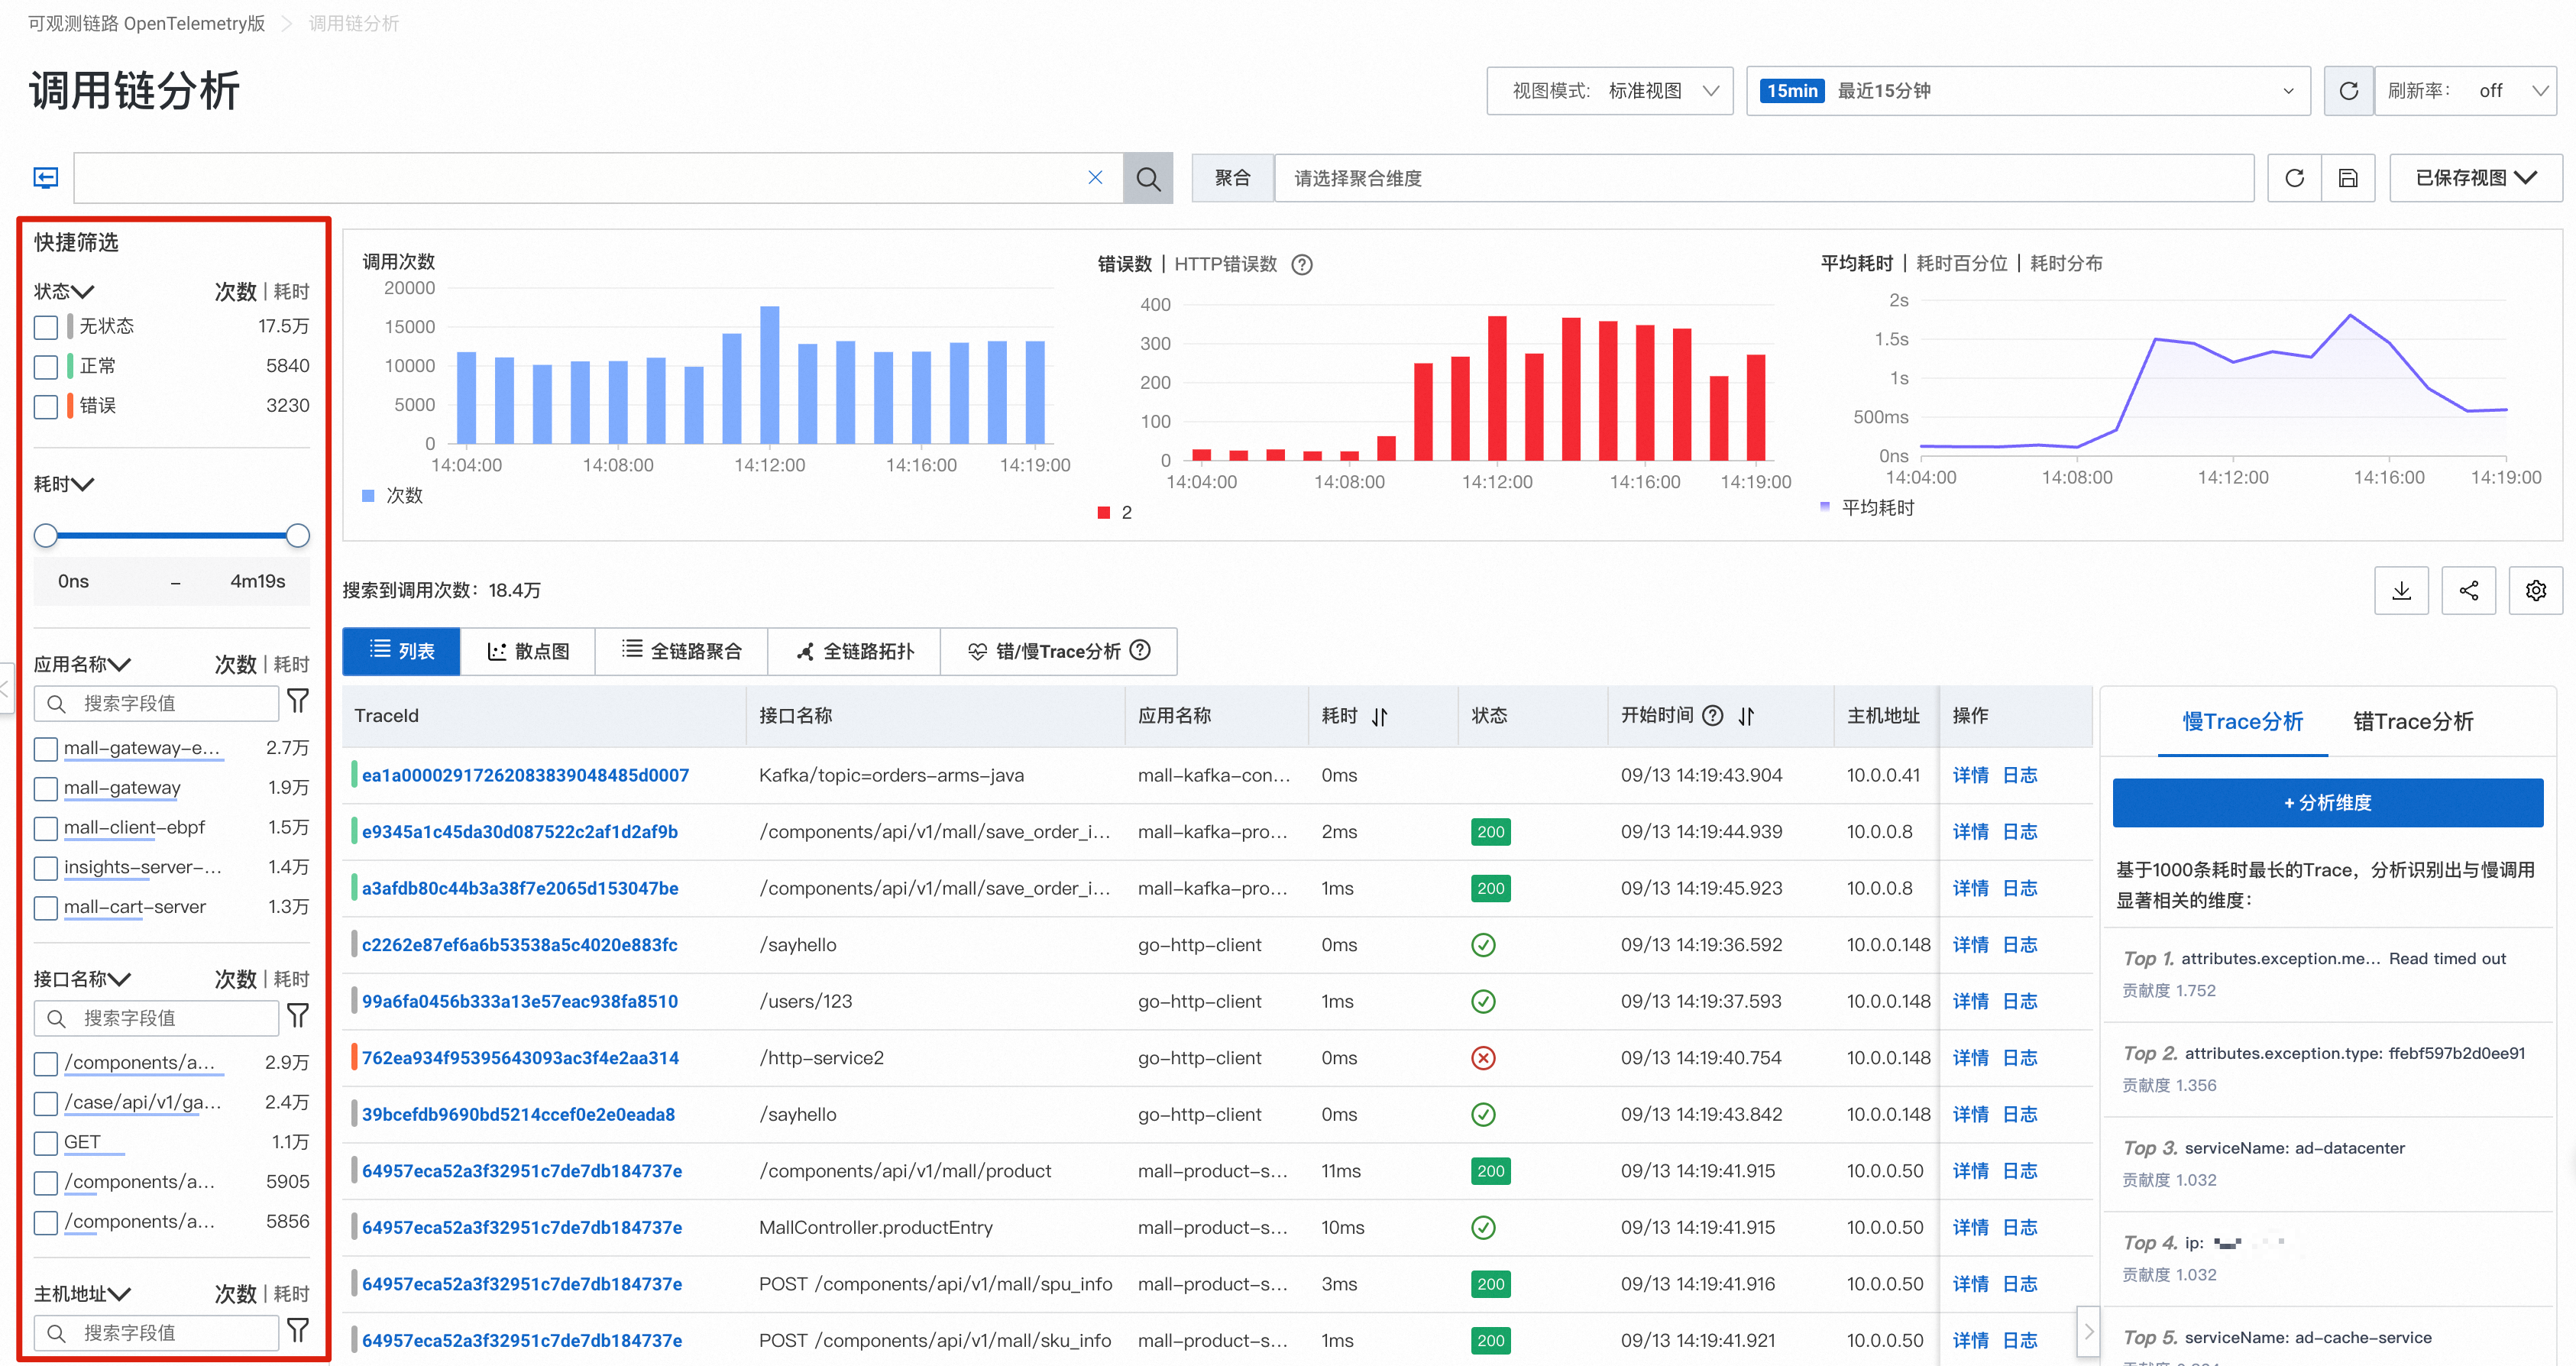
快捷筛选
在调用链分析页面左侧快捷筛选区域,通过状态、耗时、应用名称、接口名称和主机地址维度快速筛选链路。
例如在状态中选中错误,可以快速筛选出
statusCode=2的异常链路。选中某个应用或接口,可以快速筛选该应用或接口下的链路。
快捷筛选的优势不仅是操作方便,还可以进行多级筛选。通过实时显示当前组合条件下的链路数据分布,帮助您发现潜在的异常特征。