当您需要提升服务网格内部通信透明度并优化监控策略时,可以基于Mixerless Telemetry技术收集遥测数据,实现对业务容器的无侵入式监控。这些监控指标可被可观测监控Prometheus版或自建Prometheus采集,从而有效地监控服务性能,如请求率、错误率和延迟等。本文以自建Prometheus为例,介绍如何配置自建Prometheus并采集监控指标数据,帮助您及时发现和解决服务相关的问题,提高系统的稳定性和可靠性。
前提条件
步骤一:安装Prometheus
下载Istio安装包,并解压。关于Istio安装包下载地址,请参见Download Istio。
通过kubectl连接集群。具体操作,请参见获取集群KubeConfig并通过kubectl工具连接集群。
执行以下命令,安装Prometheus。
kubectl --kubeconfig <kubeconfig位置> apply -f <解压后Istio安装包位置>/samples/addons/prometheus.yaml
步骤二:开启ASM的监控指标采集
ASM版本为1.17.2.35以下,需执行此步骤。ASM版本为1.17.2.35及以上,请跳过此步骤。
登录ASM控制台,在左侧导航栏,选择。
在网格管理页面,单击目标实例名称,然后在左侧导航栏,选择。
在监控指标页面,选择集成自建Prometheus实现监控,确认已按照对应文档完成相关参数配置 ,然后单击将监控指标采集到阿里云可观测监控Prometheus版,然后在确认对话框,单击确定。
关于如何集成自建Prometheus实现网格监控,请参见集成自建Prometheus实现网格监控。
步骤三:配置Prometheus
配置Istio的监控指标。
删除Prometheus Pod,使Prometheus配置生效。
在集群管理页左侧导航栏,选择。
在容器组页面单击Prometheus操作列下的。
在提示对话框,单击确定。
执行以下命令,查看Prometheus配置中的
job_name。kubectl --kubeconfig <kubeconfig位置> get cm prometheus -n istio-system -o jsonpath={.data.prometheus\\.yml} | grep job_name预期输出:
- job_name: 'istio-mesh'
- job_name: 'envoy-stats'
- job_name: 'istio-policy'
- job_name: 'istio-telemetry'
- job_name: 'pilot'
- job_name: 'sidecar-injector'
- job_name: prometheus
  job_name: kubernetes-apiservers
  job_name: kubernetes-nodes
  job_name: kubernetes-nodes-cadvisor
- job_name: kubernetes-service-endpoints
- job_name: kubernetes-service-endpoints-slow
  job_name: prometheus-pushgateway
- job_name: kubernetes-services
- job_name: kubernetes-pods
- job_name: kubernetes-pods-slow
步骤四:生成监控指标数据
执行以下命令,在ACK集群中部署podinfo示例应用。
使用以下内容,创建podinfo.yaml。
apiVersion: apps/v1
kind: Deployment
metadata:
  name: podinfo
spec:
  minReadySeconds: 3
  revisionHistoryLimit: 5
  progressDeadlineSeconds: 60
  strategy:
    rollingUpdate:
      maxUnavailable: 0
    type: RollingUpdate
  selector:
    matchLabels:
      app: podinfo
  template:
    metadata:
      annotations:
        prometheus.io/scrape: "true"
        prometheus.io/port: "9797"
      labels:
        app: podinfo
    spec:
      containers:
      - name: podinfod
        image: registry-cn-hangzhou.ack.aliyuncs.com/ack-demo/podinfo:6.7.1
        imagePullPolicy: IfNotPresent
        ports:
        - name: http
          containerPort: 9898
          protocol: TCP
        - name: http-metrics
          containerPort: 9797
          protocol: TCP
        - name: grpc
          containerPort: 9999
          protocol: TCP
        command:
        - ./podinfo
        - --port=9898
        - --port-metrics=9797
        - --grpc-port=9999
        - --grpc-service-name=podinfo
        - --level=info
        - --random-delay=false
        - --random-error=false
        env:
        - name: PODINFO_UI_COLOR
          value: "#34577c"
        livenessProbe:
          exec:
            command:
            - podcli
            - check
            - http
            - localhost:9898/healthz
          initialDelaySeconds: 5
          timeoutSeconds: 5
        readinessProbe:
          exec:
            command:
            - podcli
            - check
            - http
            - localhost:9898/readyz
          initialDelaySeconds: 5
          timeoutSeconds: 5
        resources:
          limits:
            cpu: 2000m
            memory: 512Mi
          requests:
            cpu: 100m
            memory: 64Mi
        volumeMounts:
          - name: data
            mountPath: /data
      volumes:
        - name: data
          emptyDir: {}
---
apiVersion: v1
kind: Service
metadata:
  name: podinfo
spec:
  type: ClusterIP
  selector:
    app: podinfo
  ports:
    - name: http
      port: 9898
      protocol: TCP
      targetPort: http
    - port: 9999
      targetPort: grpc
      protocol: TCP
      name: grpc
使用数据面集群的kubeconfig,部署podinfo示例应用。
kubectl apply -f podinfo.yaml
执行以下命令,请求podinfo应用,以产生监控指标数据。
podinfo_pod=$(k get po -n test -l app=podinfo -o jsonpath={.items..metadata.name})
for i in {1..10}; do
   kubectl --kubeconfig "$USER_CONFIG" exec $podinfo_pod -c podinfod -n test -- curl -s podinfo:9898/version
  echo
done
在Envoy容器内确认监控指标已生成。
执行以下命令,请求Envoy确认是否包含istio_requests_total监控指标。
kubectl --kubeconfig <kubeconfig位置> exec $podinfo_pod -n test -c istio-proxy -- curl -s localhost:15090/stats/prometheus | grep istio_requests_total预期输出:
:::: istio_requests_total ::::
# TYPE istio_requests_total counter
istio_requests_total{response_code="200",reporter="destination",source_workload="podinfo",source_workload_namespace="test",source_principal="spiffe://cluster.local/ns/test/sa/default",source_app="podinfo",source_version="unknown",source_cluster="c199d81d4e3104a5d90254b2a210914c8",destination_workload="podinfo",destination_workload_namespace="test",destination_principal="spiffe://cluster.local/ns/test/sa/default",destination_app="podinfo",destination_version="unknown",destination_service="podinfo.test.svc.cluster.local",destination_service_name="podinfo",destination_service_namespace="test",destination_cluster="c199d81d4e3104a5d90254b2a210914c8",request_protocol="http",response_flags="-",grpc_response_status="",connection_security_policy="mutual_tls",source_canonical_service="podinfo",destination_canonical_service="podinfo",source_canonical_revision="latest",destination_canonical_revision="latest"} 10

istio_requests_total{response_code="200",reporter="source",source_workload="podinfo",source_workload_namespace="test",source_principal="spiffe://cluster.local/ns/test/sa/default",source_app="podinfo",source_version="unknown",source_cluster="c199d81d4e3104a5d90254b2a210914c8",destination_workload="podinfo",destination_workload_namespace="test",destination_principal="spiffe://cluster.local/ns/test/sa/default",destination_app="podinfo",destination_version="unknown",destination_service="podinfo.test.svc.cluster.local",destination_service_name="podinfo",destination_service_namespace="test",destination_cluster="c199d81d4e3104a5d90254b2a210914c8",request_protocol="http",response_flags="-",grpc_response_status="",connection_security_policy="unknown",source_canonical_service="podinfo",destination_canonical_service="podinfo",source_canonical_revision="latest",destination_canonical_revision="latest"} 10
执行以下命令,请求Envoy确认是否包含istio_request_duration监控指标。
kubectl --kubeconfig <kubeconfig位置> exec $podinfo_pod -n test -c istio-proxy -- curl -s localhost:15090/stats/prometheus | grep istio_request_duration预期输出:
:::: istio_request_duration ::::
# TYPE istio_request_duration_milliseconds histogram
istio_request_duration_milliseconds_bucket{response_code="200",reporter="destination",source_workload="podinfo",source_workload_namespace="test",source_principal="spiffe://cluster.local/ns/test/sa/default",source_app="podinfo",source_version="unknown",source_cluster="c199d81d4e3104a5d90254b2a210914c8",destination_workload="podinfo",destination_workload_namespace="test",destination_principal="spiffe://cluster.local/ns/test/sa/default",destination_app="podinfo",destination_version="unknown",destination_service="podinfo.test.svc.cluster.local",destination_service_name="podinfo",destination_service_namespace="test",destination_cluster="c199d81d4e3104a5d90254b2a210914c8",request_protocol="http",response_flags="-",grpc_response_status="",connection_security_policy="mutual_tls",source_canonical_service="podinfo",destination_canonical_service="podinfo",source_canonical_revision="latest",destination_canonical_revision="latest",le="0.5"} 10

istio_request_duration_milliseconds_bucket{response_code="200",reporter="destination",source_workload="podinfo",source_workload_namespace="test",source_principal="spiffe://cluster.local/ns/test/sa/default",source_app="podinfo",source_version="unknown",source_cluster="c199d81d4e3104a5d90254b2a210914c8",destination_workload="podinfo",destination_workload_namespace="test",destination_principal="spiffe://cluster.local/ns/test/sa/default",destination_app="podinfo",destination_version="unknown",destination_service="podinfo.test.svc.cluster.local",destination_service_name="podinfo",destination_service_namespace="test",destination_cluster="c199d81d4e3104a5d90254b2a210914c8",request_protocol="http",response_flags="-",grpc_response_status="",connection_security_policy="mutual_tls",source_canonical_service="podinfo",destination_canonical_service="podinfo",source_canonical_revision="latest",destination_canonical_revision="latest",le="1"} 10
...
结果验证
使用负载均衡的方式对外暴露Prometheus服务。具体操作,请参见Service管理。
在集群管理页左侧导航栏,选择。
在服务页面单击Prometheus External IP列下的IP地址。
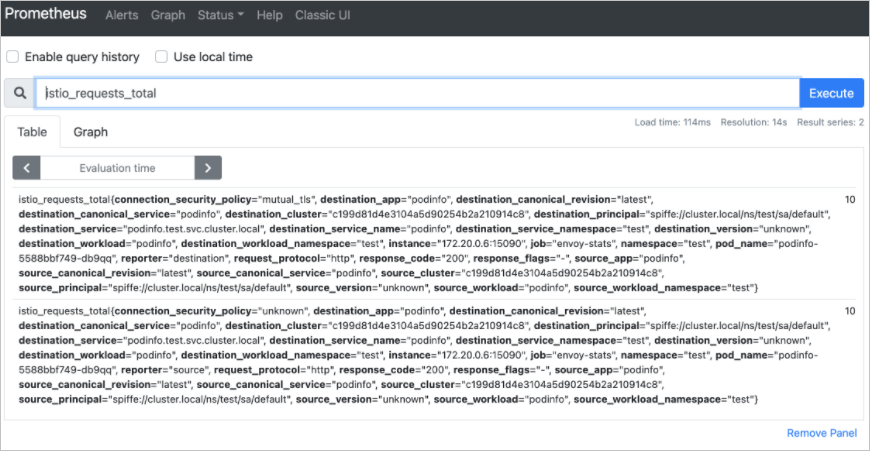
在Prometheus中输入istio_requests_total,单击Execute。
如下图所示,说明Prometheus采集应用监控指标成功。