在微服務架構中,OpenTelemetry提供了一個強大的跟蹤架構,能夠捕捉到在分布式系統中服務之間傳遞的請求跟蹤資料,這些資料對於理解請求流程和服務間的依賴關係至關重要。但是如果需要涉及到深入分析單個微服務的內部效能,例如當服務響應速度變慢或者出現逾時,跟蹤資料可能無法完全揭示問題的原因。在這種情況下,我們需要更細緻的效能分析資料(Profiling資料)協助我們定位問題根因。
工作原理
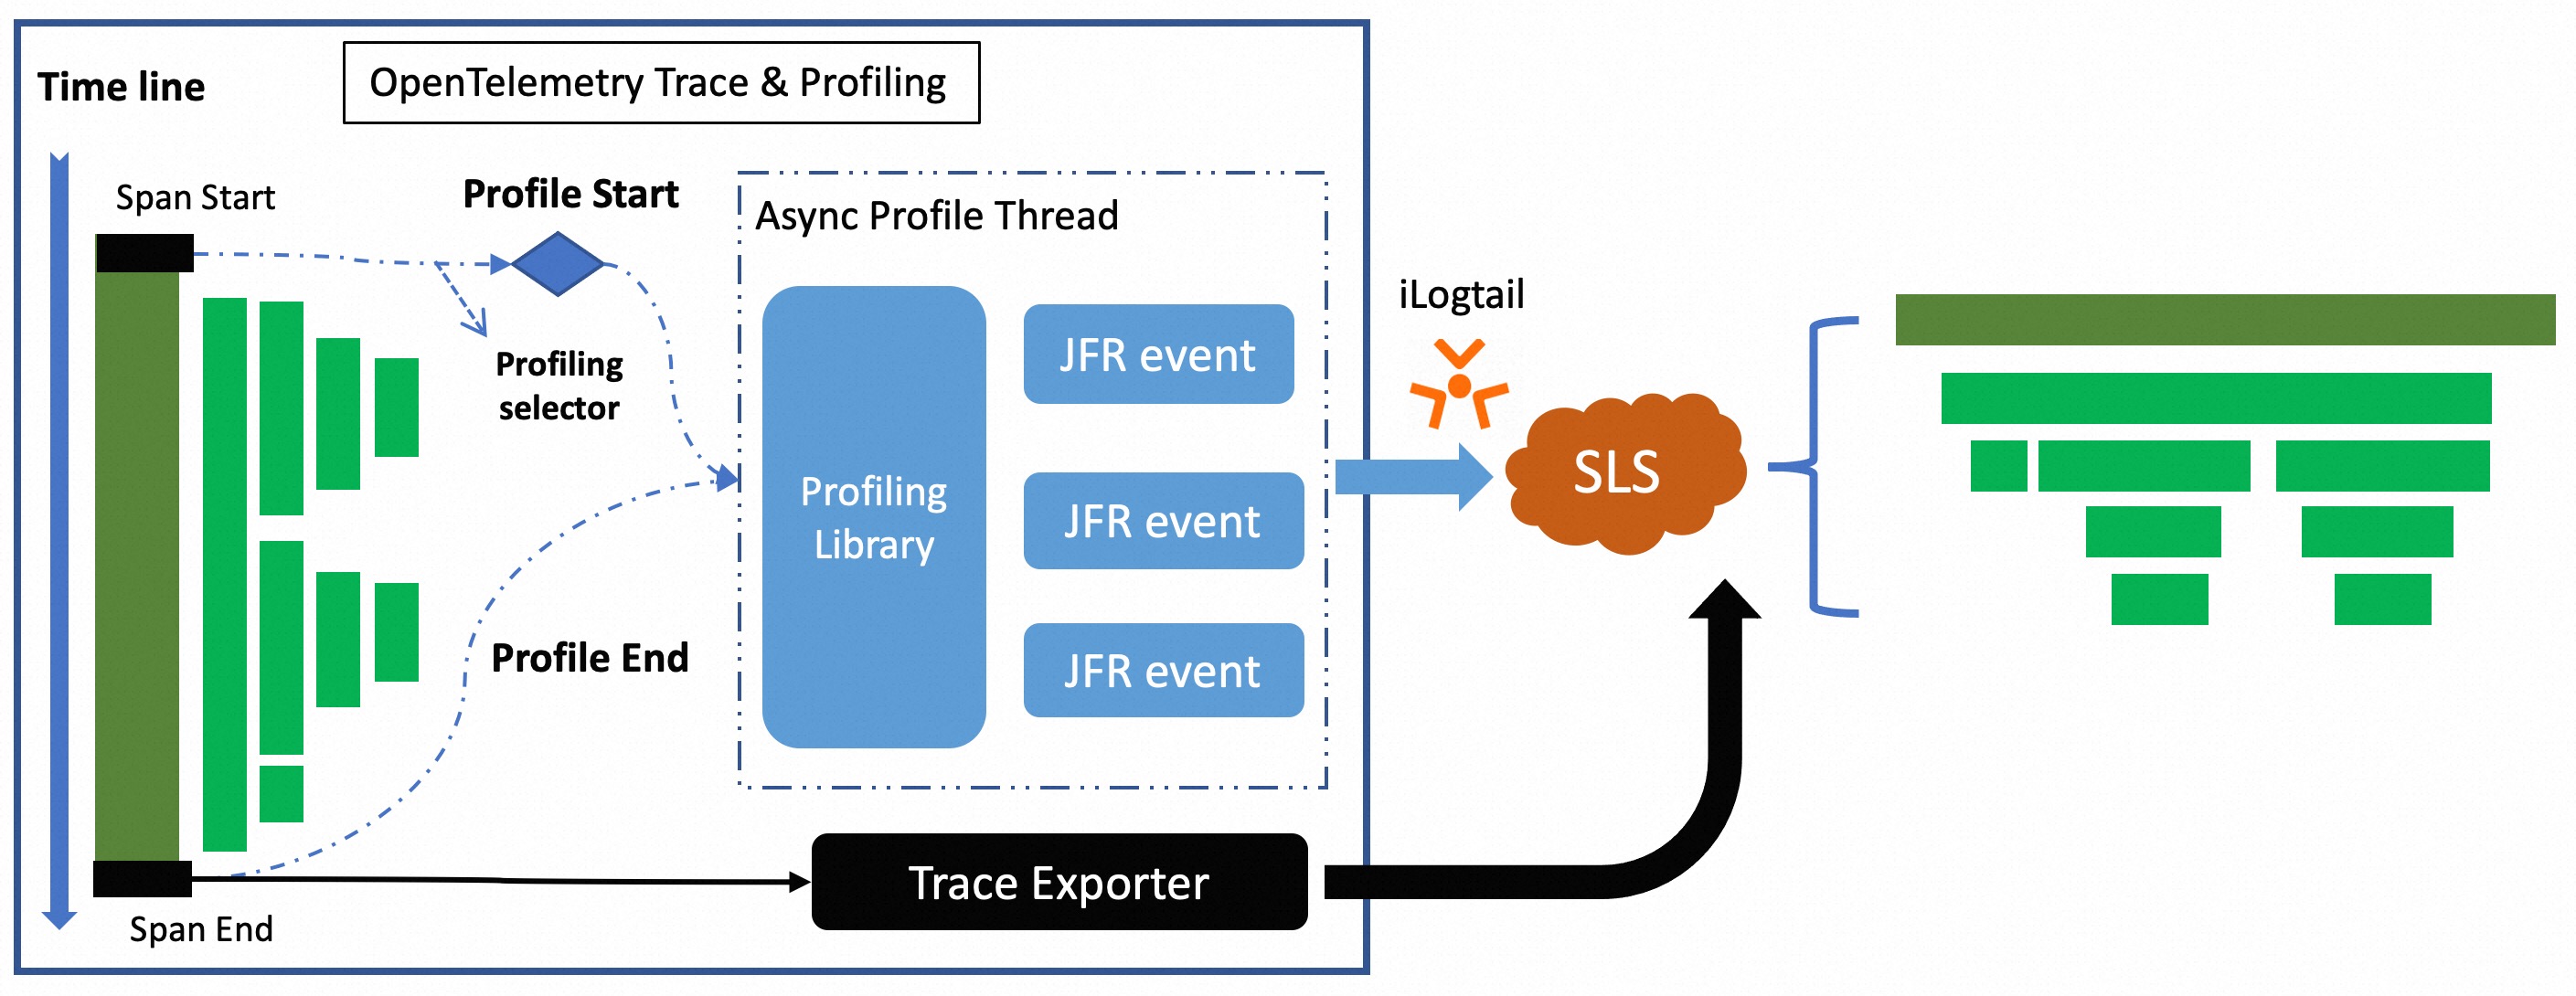
根據Profiling配置確定需要分析的Trace資料。當相應的Trace被捕獲時,擴充包會觸發Java Flight Recorder (JFR)的Profiling任務,收集方法執行時間、記憶體消耗、CPU使用等運行時資訊。
採集到的Profiling資料通過ilogtail發送到Log Service,在Log Service可以通過Trace ID將Profiling資料與Trace資料相關聯,協助開發人員找到應用中的效能熱點。
應用情境
以下兩個情境出現問題無法定位,Profiling資料可以找到這些盲點,從而更好地理解應用程式的效能瓶頸。
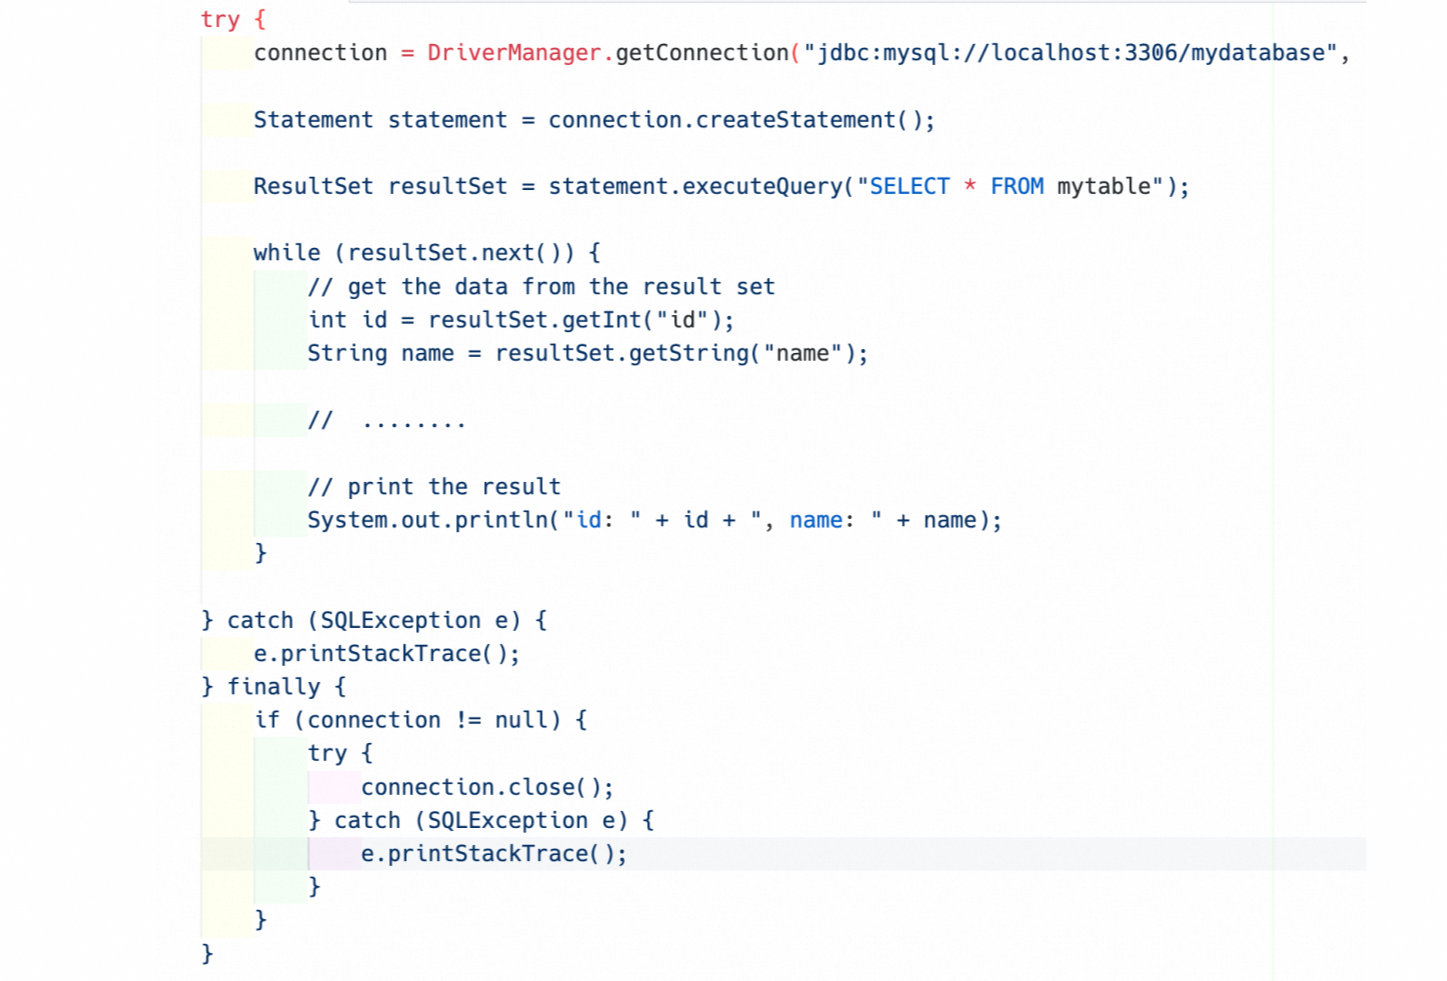
記憶體申請過多,導致頻繁GC
應用程式使用JDBC進行資料庫操作,而在執行資料查詢時,沒有對返回的資料量進行限制。如圖所示,如果表資料量過大,那麼會造成大量記憶體申請從而導致頻繁的GC,最終影響應用程式的效能。
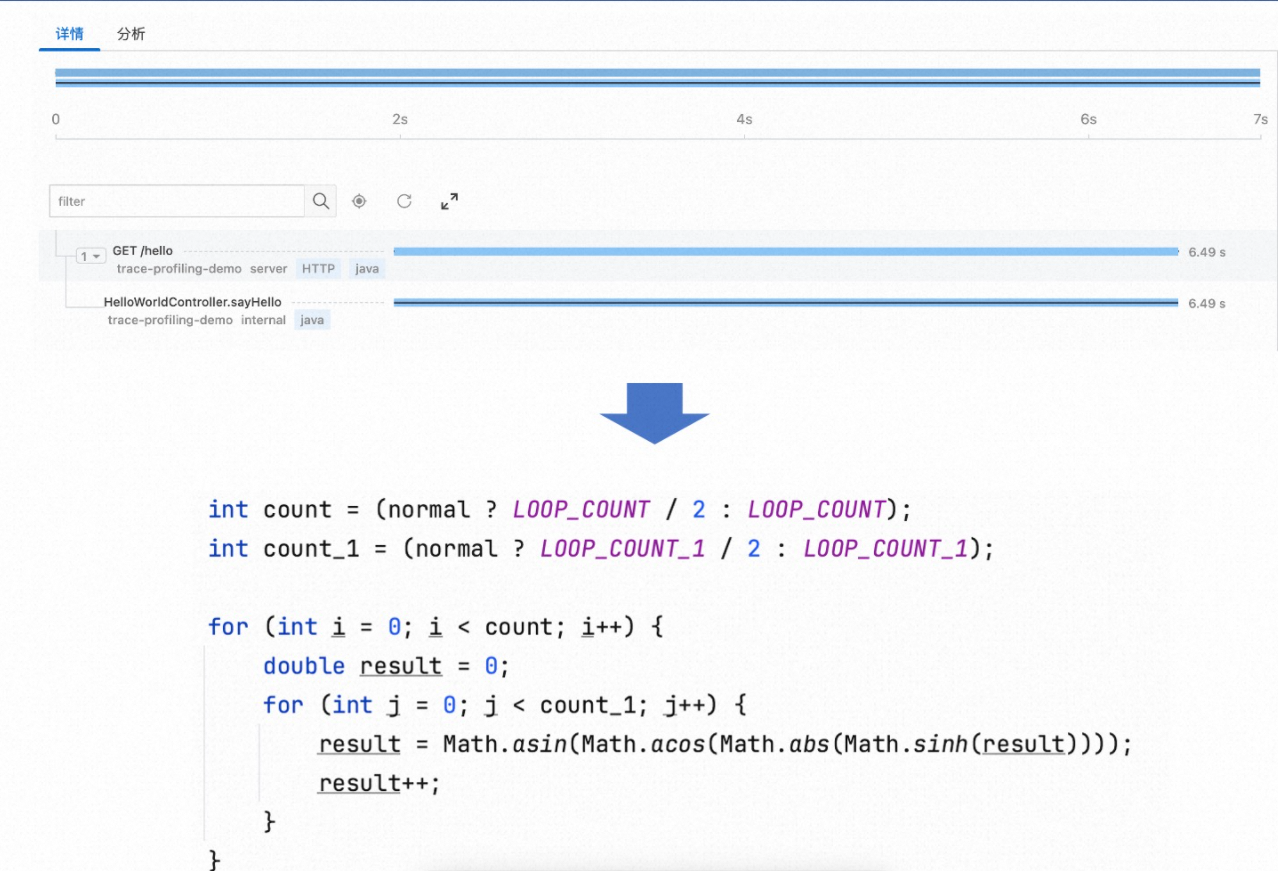
Trace埋點稀疏,CPU執行過長,導致無法定位問題根因
為了減少Agent對應用程式效能的影響,Trace資料不會對每一行代碼進行埋點,這種選擇性跟蹤策略可能導致一些沒有埋點的耗時代碼地區在效能分析中形成盲點,如果這些地區出現效能問題,便難以通過Trace資料被檢測到。 例如一個關鍵商務邏輯沒有被跟蹤,它的效能問題可能就無法通過Trace資料被發現。
安裝 Profiling 資料接收端
安裝CRD 模板工具
操作方式 | 描述 |
叢集外安裝 | 叢集外部安裝要求登入賬戶存在 |
叢集內安裝 | 容器內安裝基於已安裝組件 |
叢集外安裝
登入叢集,下載模板工具。
中國地區
curl https://logtail-release-cn-hangzhou.oss-cn-hangzhou.aliyuncs.com/kubernetes/crd-tool.tar.gz -o /tmp/crd-tool.tar.gz海外地區
curl https://logtail-release-ap-southeast-1.oss-ap-southeast-1.aliyuncs.com/kubernetes/crd-tool.tar.gz -o /tmp/crd-tool.tar.gz
安裝模板工具,安裝成功後會在當前檔案夾產生
sls-crd-tool工具。tar -xvf /tmp/crd-tool.tar.gz -C /tmp &&chmod 755 /tmp/crd-tool/install.sh && sh -x /tmp/crd-tool/install.sh執行
./sls-crd-tool list命令驗證工具是否安裝成功,當存在傳回值時,說明工具安裝成功。
容器內安裝
登入叢集,進入
alibaba-log-controller容器。kubectl get pods -n kube-system -o wide |grep alibaba-log-controller | awk -F ' ' '{print $1}' kubectl exec -it {pod} -n kube-system bash cd ~下載模板工具。
如叢集內可以下載公網資源,操作方法如下:
中國地區
curl https://logtail-release-cn-hangzhou.oss-cn-hangzhou.aliyuncs.com/kubernetes/crd-tool.tar.gz -o /tmp/crd-tool.tar.gz海外地區
curl https://logtail-release-ap-southeast-1.oss-ap-southeast-1.aliyuncs.com/kubernetes/crd-tool.tar.gz -o /tmp/crd-tool.tar.gz
如叢集內無法下載公網資源,可以叢集外下載,使用
kubectl cp <source> <destination>或者ACK上傳等功能將模板工具傳輸至上述容器。
安裝模板工具,安裝成功後會在當前檔案夾產生
sls-crd-tool工具。tar -xvf /tmp/crd-tool.tar.gz -C /tmp &&chmod 755 /tmp/crd-tool/install.sh && sh -x /tmp/crd-tool/install.sh執行
./sls-crd-tool list命令驗證工具是否安裝成功,當存在傳回值時,說明工具安裝成功。
安裝Profiling資料接收服務
執行
./sls-crd-tool -l en list命令。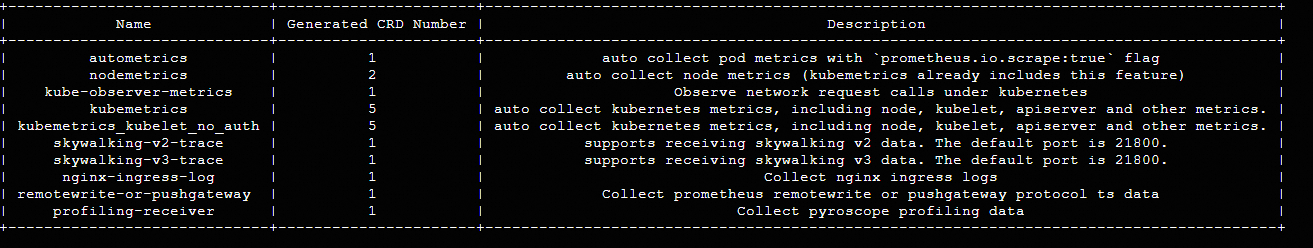
執行
./sls-crd-tool -i get --project ${project} --instance ${instance} profiling-receiver。${project} :全棧可觀測執行個體歸屬的 Project
${instance}: 全站可觀測執行個體 ID
執行
./sls-crd-tool apply -f template-profiling-receiver.yaml。
應用端
安裝Profiling Extension
建立 profiling_config.yaml 設定檔(該配置僅採集 10 條 Trace)
enabled: true
maxProfilingCount: 10
profilingIntervalMillis: 5000
agentConfigs:
   agent.upload.server: "http://
logtail-statefulset.kube-system:4040"
   agent.timeout: 10
   agent.ingest.max.tries: 2
   agent.log.level: off
   agent.log.file: ""
   period: 20
   cpu.engine: async_profiler
   wallclock.engine: async_profiler
   alloc.engine: async_profiler
以下是相關配置參數說明
配置項
說明
是否必填
預設值
enabled
是否開啟Profiling
是
false
maxProfilingCount
最大Profiling並行任務數
否
10
profilingIntervalMillis
Profiling任務間隔
否
5000
agentConfigs
Profiling Agent配置
否
agent.upload.server
Profiling資料上報地址
否
agent.timeout
Profiling資料上報逾時時間 ,單位:s(秒)
否
10
agent.ingest.max.tries
Profiling資料上傳重試次數
否
2
agent.log.level
Profiling Agent記錄層級
否
off
agent.log.file
Profiling Agent記錄檔路徑
否
period
Profiling資料上傳周期,單位:s(秒)
否
20
cpu.engine
CPU採集引擎,目前支援
auto/async_profiler/jfr/off否
off
wallclock.engine
WallClock採集引擎,目前支援
auto/async_profiler/off否
off
alloc.engine
Alloc採集引擎,目前支援
auto/async_profiler/jfr/off否
off
profilingRules
Profiling規則配置
否
profilingRules.name
Profiling規則名稱
是
profilingRules.type
Profiling規則類型,目前支援
ROOT_SPAN, AGENT_RESOURCE, SPAN_NAME是
profilingRules.attributes
Profiling規則屬性,根據不同的規則類型,屬性值也不同
否
啟動應用程式
java -javaagent:/path/to/opentelemetry-javaagent-all.jar \
     -Dotel.service.name=test-demo \
     -Dotel.javaagent.extensions=/path/to/otel-extension.jar \
     -Dotel.profiling.config_endpoint=file:/path/to/profiling_config.yaml \
     -Dotel.service.name=trace-profiling-demo \
     -jar myapp.jar
查看資料
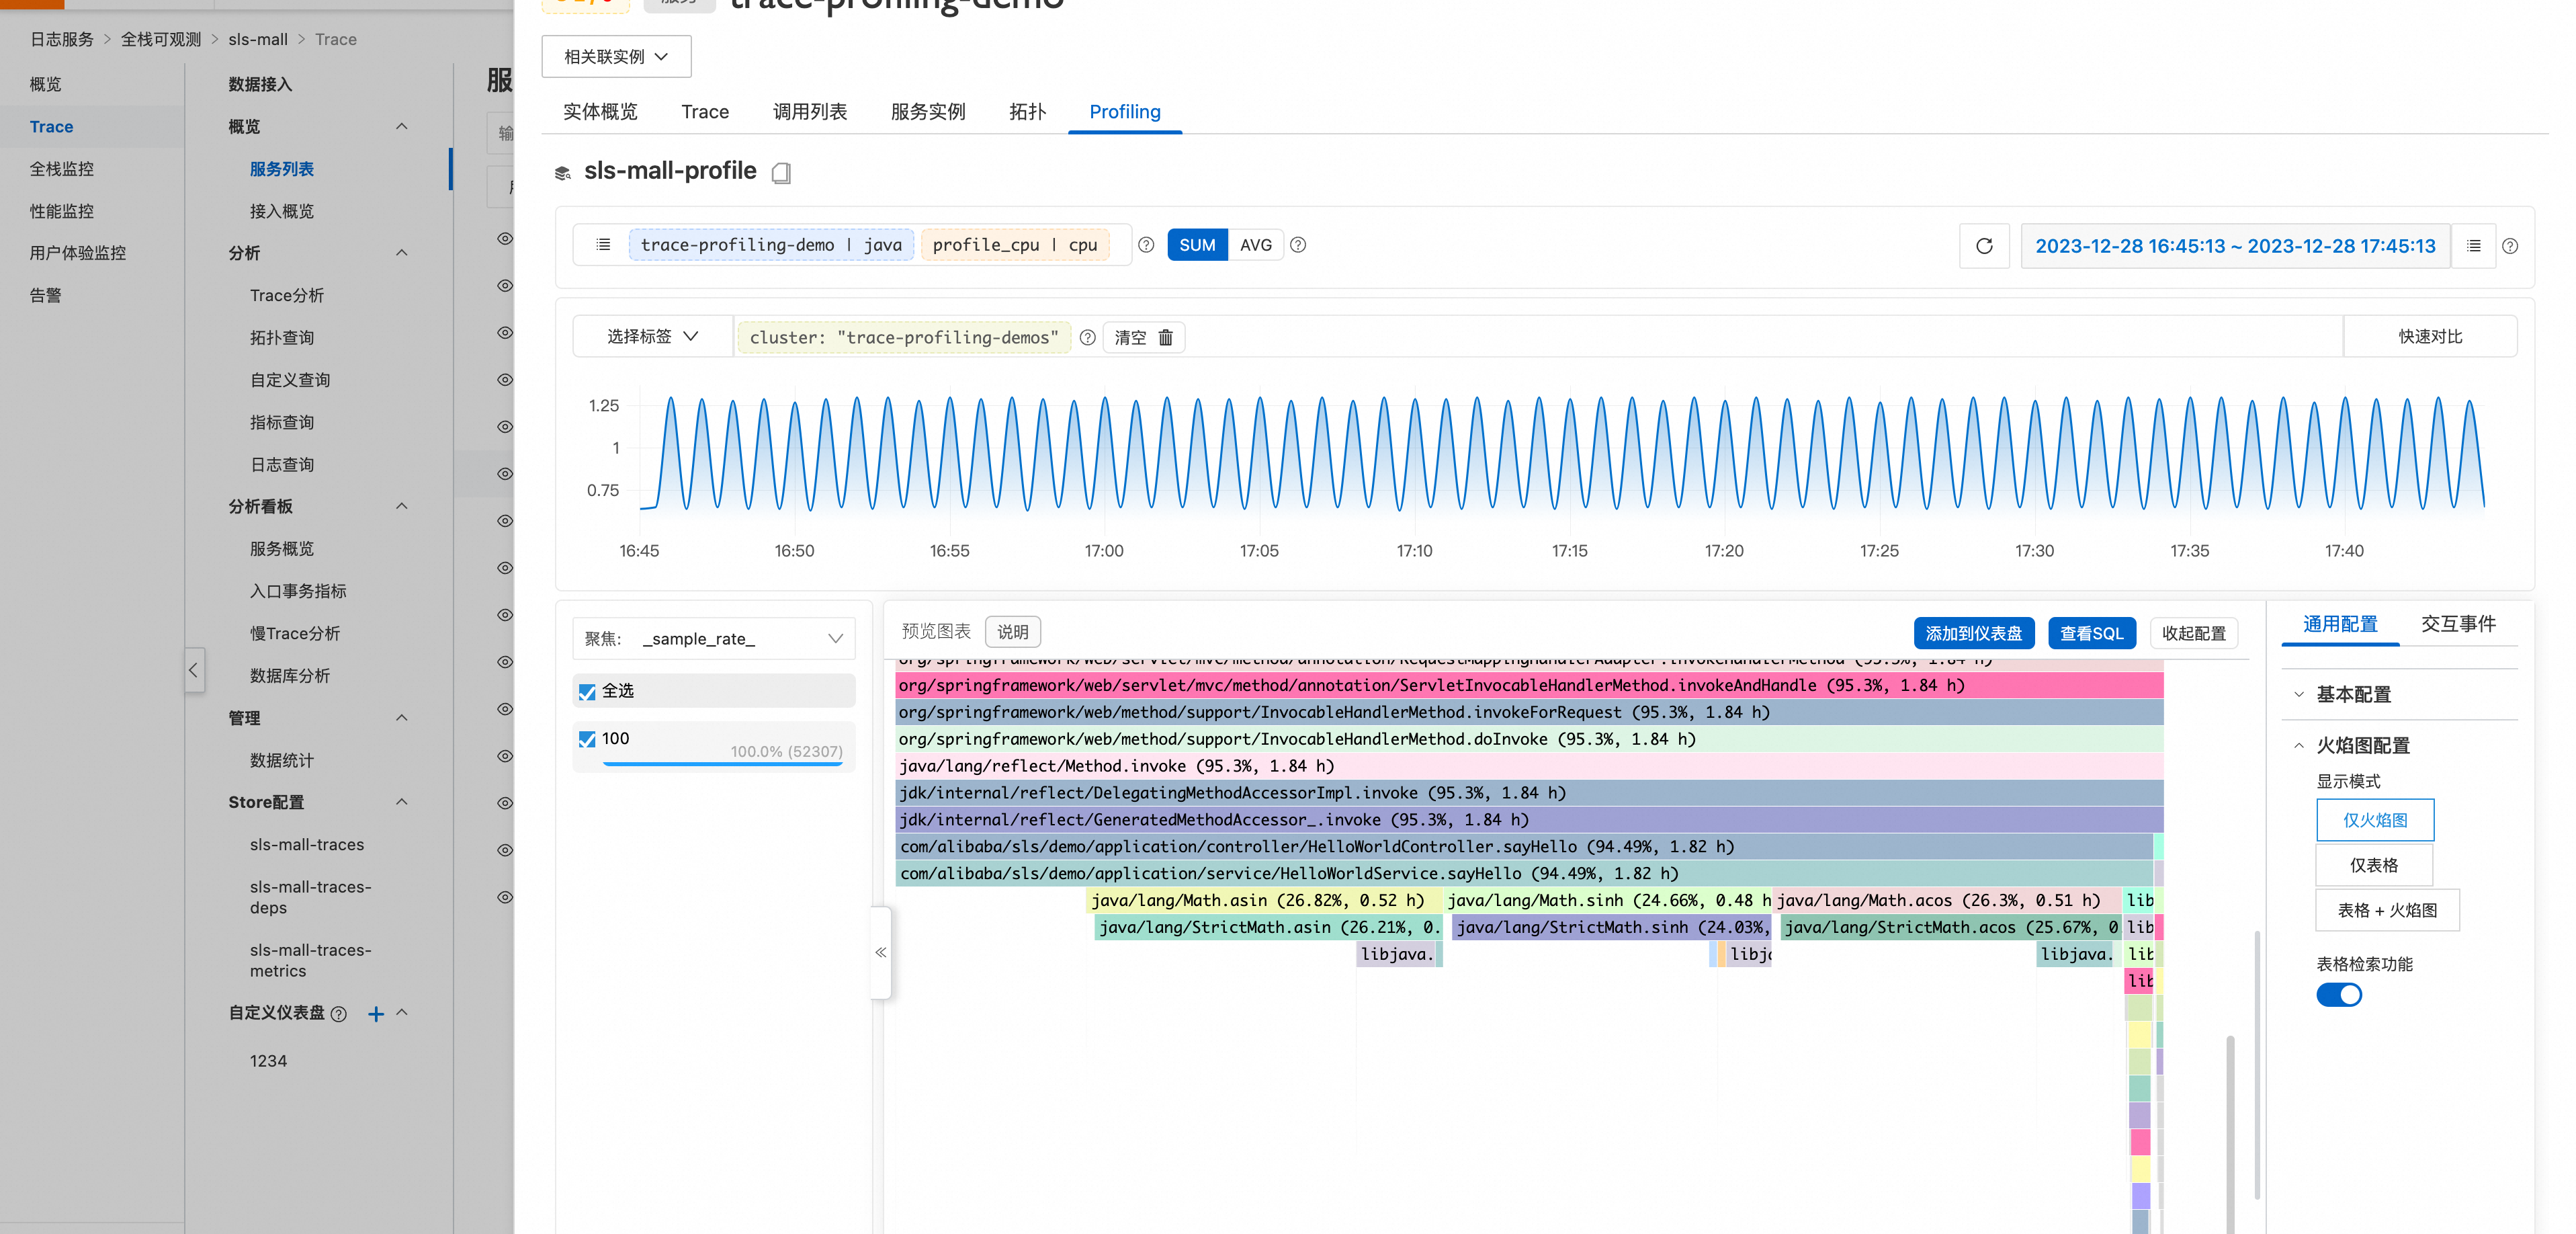
進入到全站可觀測執行個體,就可以點擊相關接入服務,即可查看相關的Profiling資料。
配置樣本
配置所有Root Span進行Profiling。
enabled: true
maxProfilingCount: 10
profilingIntervalMillis: 5000
agentConfigs:
  agent.upload.server: "http://localhost:4040"
  agent.timeout: 10
  agent.ingest.max.tries: 2
  agent.log.level: off
  agent.log.file: ""
  period: 20
  cpu.engine: async_profiler
  wallclock.engine: async_profiler
  alloc.engine: async_profiler
profilingRules:
  - name: "profiling root span"
    type: ROOT_SPAN
配置所有service.name為payment的Root Span進行Profiling。
enabled: true
maxProfilingCount: 10
profilingIntervalMillis: 5000
agentConfigs:
  agent.upload.server: "http://localhost:4040"
  agent.timeout: 10
  agent.ingest.max.tries: 2
  agent.log.level: off
  agent.log.file: ""
  period: 20
  cpu.engine: async_profiler
  wallclock.engine: async_profiler
  alloc.engine: async_profiler
profilingRules:
  - name: "profiling root span"
    type: ROOT_SPAN
  - name: "profiling all spans with some resouce attribute"
    type: AGENT_RESOURCE
    attributes:
      service.name: "payment" #例如,這裡指定了service.name為payment的Span將會被採集
配置所有Span service.name為payment,並且Span Name以`Get`開頭的Span進行Profiling。
enabled: true
maxProfilingCount: 10
profilingIntervalMillis: 5000
agentConfigs:
   agent.upload.server: "http://localhost:4040"
   agent.timeout: 10
   agent.ingest.max.tries: 2
   agent.log.level: off
   agent.log.file: ""
   period: 20
   cpu.engine: async_profiler
   wallclock.engine: async_profiler
   alloc.engine: async_profiler
profilingRules:
   - name: "profiling all spans with some resouce attribute"
     type: AGENT_RESOURCE
     attributes:
        service.name: "payment" #例如,這裡指定了service.name為payment的Span將會被採集
   - name: "profiling with span name"
     type: SPAN_NAME
     attributes:
        pattern: "Get*" # 支援Regex