本文主要介紹時序SPL指令的詳細資料。
SPL指令列表
指令名稱 | 說明 |
將Table資料構建成Series資料。 | |
將SPL查詢結果渲染為圖表以實現可視化。 |
make-series
將table構建為series結構。
文法
| make-series  <output> = <field-col> [default = <default-value>]
             [, ...]
             on <time-col>
             [from <time-begin> to <time-end>
              step <step-value>]
             [by <tag-col>,...]
指令塊
指令塊 | 必填 | 說明 |
<output> = <field-col> , ... | 是 | 被轉換為series的欄位列,可以選擇多列。 |
on <time-col> | 是 | 時間含義的欄位列。 |
[default = <default-value>] & [from <time-begin> to <time-end> step <step-value>] | 否 | 根據time列進行缺失值填充。包含截取的time範圍、填充步長和填充策略。 |
[by <tag-col>,...] | 否 | 按指定的tag列作彙總。 |
參數說明
參數 | 類型 | 說明 |
output | Field | 輸出彙總後的欄位。 |
field-col | Field | 輸入的欄位列。 |
default-value | String | 缺失值填充方式。 可選值:
|
time-col | Field | 輸入的時間列。 |
time-begin | String or Field | 期望得到的時間列範圍,起始點。 選擇性參數為:
|
time-end | String or Field | 期望得到的時間列範圍,結束點。選擇性參數為:
|
step-value | String | 缺失值填充步長。 可選單位: s(秒)、m(分鐘)、h(小時)、d(天)、w(周)。 |
tag-col | Field | 按該欄位值進行彙總。 |
樣本
將未經處理資料中的時間點構造為時間軸,並填充缺失點。
未經處理資料
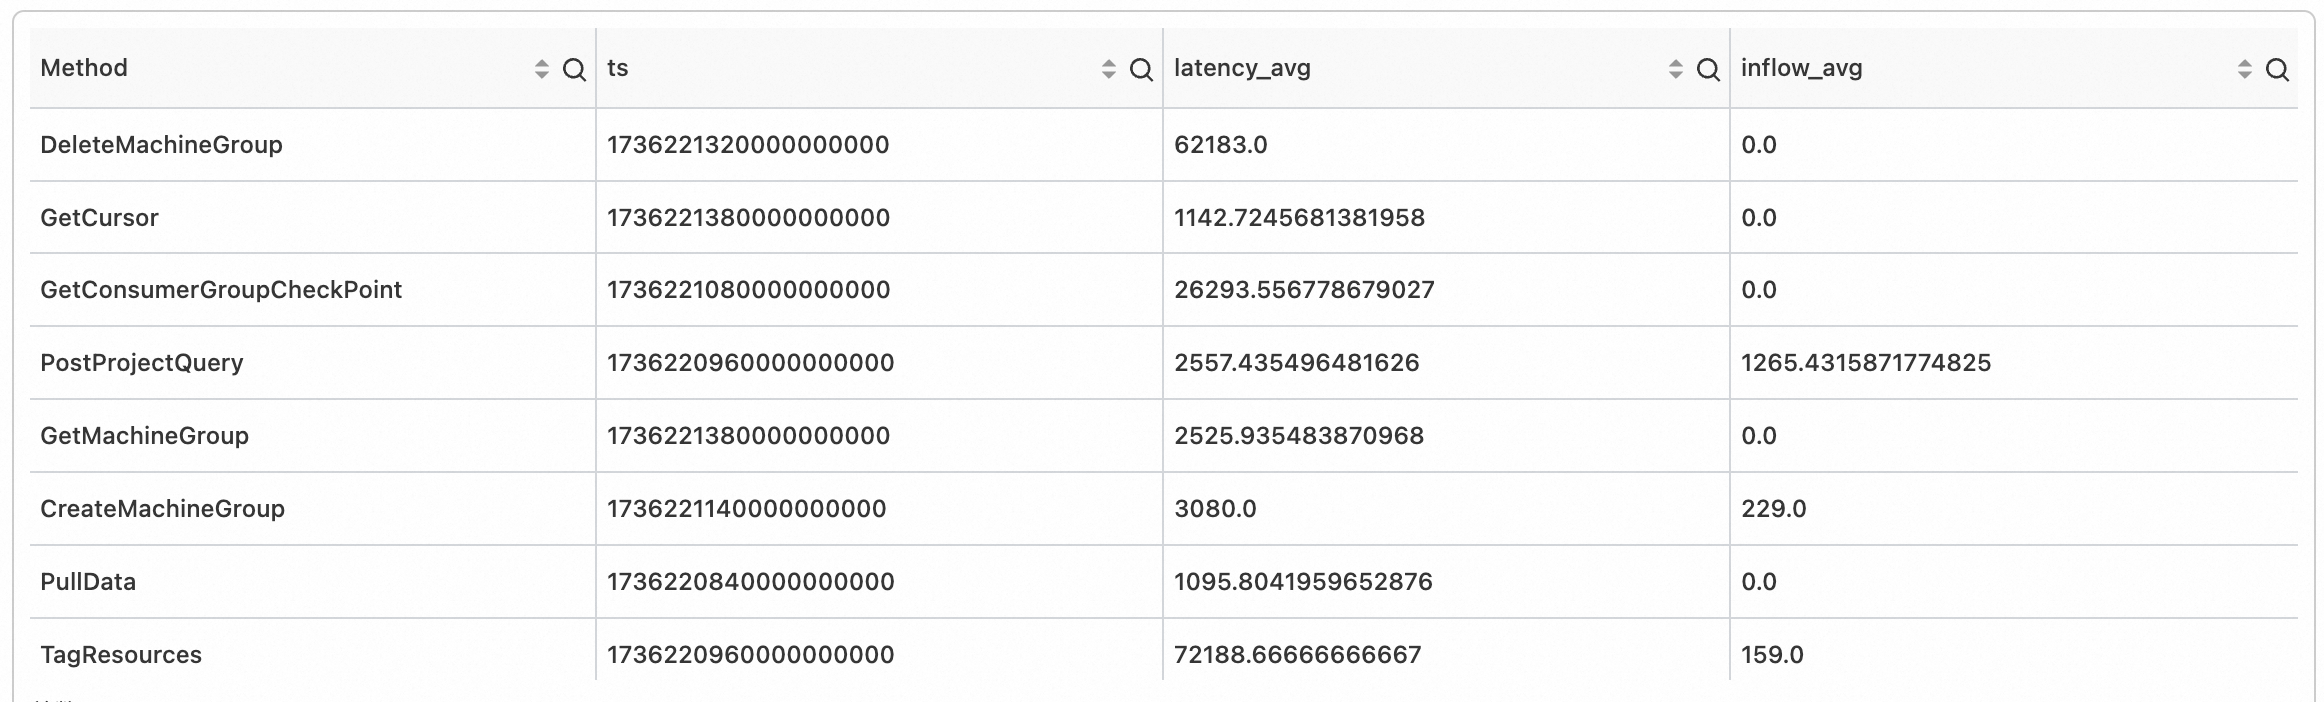
對不同的 Method,將時間戳記按60s對齊,並計算出60s時間視窗內的彙總指標,得到時間點。
SPL語句
* | extend ts = second_to_nano(__time__ - __time__ % 60)
  | stats latency_avg = avg(cast(latency as double)), inflow_avg = avg(cast (inflow as double)) by ts, Method
輸出結果
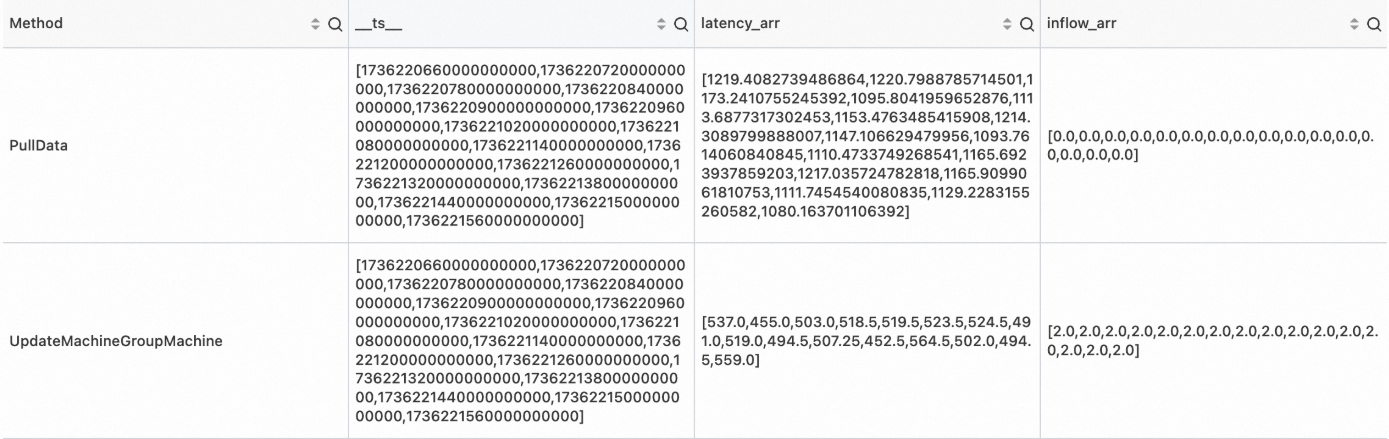
SPL語句
* | extend ts = second_to_nano(__time__ - __time__ % 60)
  | stats latency_avg = max(cast(latency as double)), inflow_avg = min(cast (inflow as double)) by ts, Method
  | make-series   latency_avg default = 'last',
                inflow_avg default = 'last'
                on ts
                from 'min' to 'max'
                step '1m'
                by Method
輸出結果
render
將SPL查詢結果渲染為圖表進行可視化。
render指令必須位於SPL查詢的最後一個運算子。
render指令不修改資料,只將可視化參數添加到查詢結果的拓展屬性中。
文法
render visualization [with ( propertyName = propertyValue [, ...])]指令塊
指令塊 | 必填 | 說明 |
visualization | 是 | 指示要使用的可視化圖表類型。支援的類型請參見Visualization。 |
propertyName = propertyValue | 否 | 索引值屬性對的分隔列表。支援類型請參見Properties。 |
參數說明
Visualization
Visualization | Description |
linechart | 線圖 |
Properties
PropertyName/PropertyValue 索引值對指示渲染圖表時要使用的額外資訊。所有屬性都是可選的。支援的屬性:
渲染時序預測圖的參數配置
PropertyName | PropertyValue |
xcolumn | 查詢結果中作為x軸的列名。 |
ycolumns | 查詢結果中作為y軸的列名列表,以逗號分隔。 |
例如:
... ...
| render linechart with (xcolumn=time_series,
                         ycolumns=metric_series, forecast_metric_series)
渲染異常檢測圖的參數配置
PropertyName | PropertyValue |
xcolumn | 查詢結果中作為 x 軸的列名。 |
ycolumns | 查詢結果中作為 y 軸的列名列表,以逗號分隔。 |
anomalyscore | 在圖表上顯示異常點的異常分數,僅作用於linechart。 |
anomalytype | 在圖表上顯示異常點的異常類型,僅作用於linechart。 |
例如:
... ...
| render linechart with (xcolumn=ts,
                         ycolumns=mem_arr, cpu_arr,
                         anomalyscore = anomalies_score_series,
                         anomalytype = anomalies_type_series)
樣本
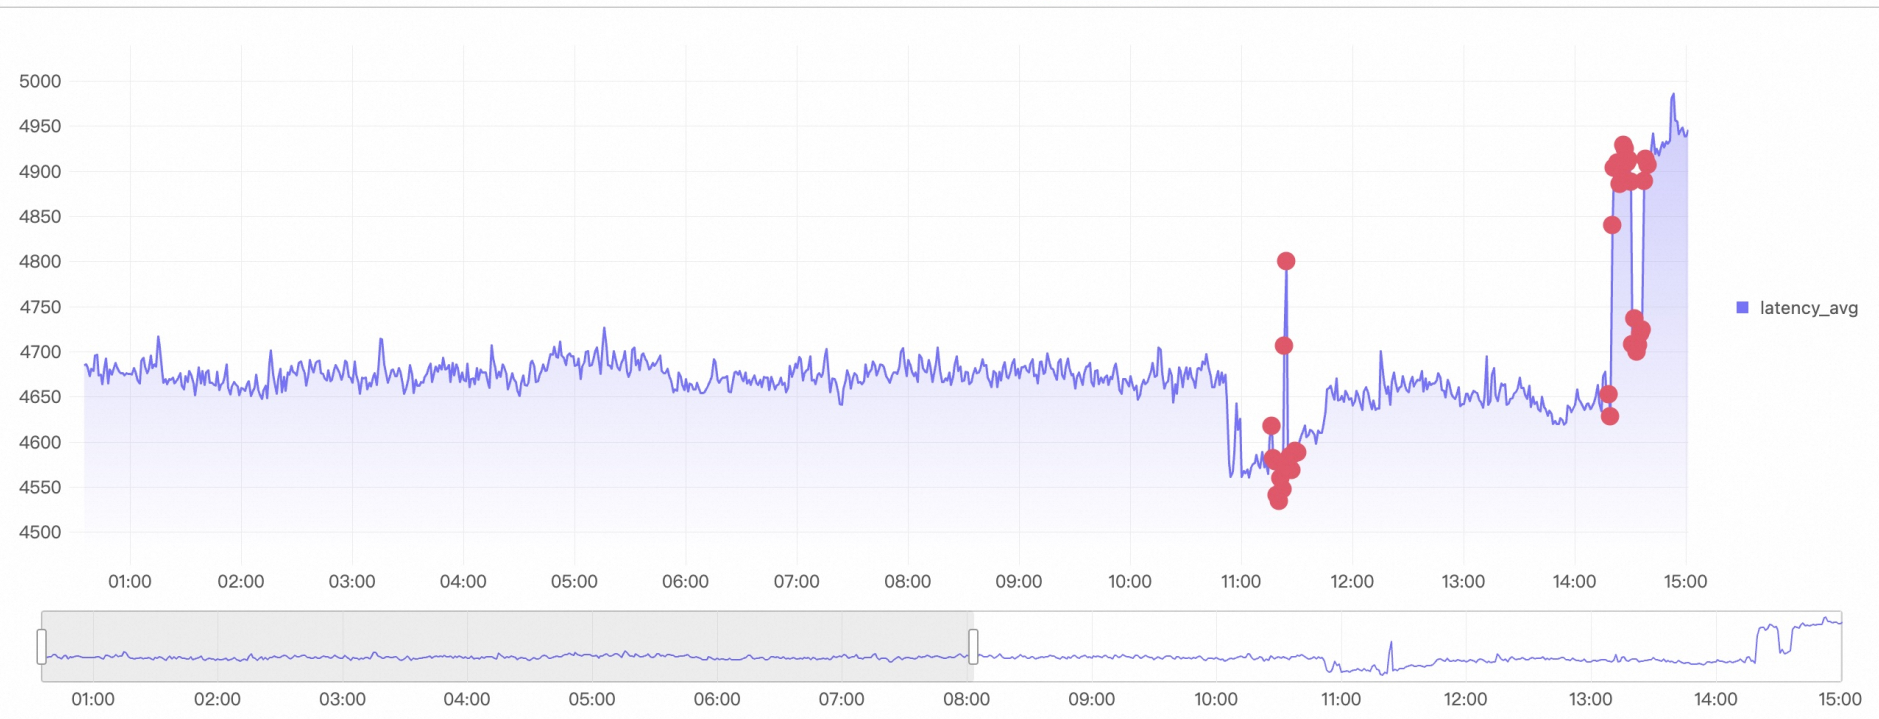
對所有時間軸異常檢測之後,保留最近 5 min 異常分數值,渲染異常檢測圖。
SPL語句
*
| extend ts= (__time__- __time__%60)*1000000000
| where Method='PostLogStoreLogs'
| stats latency_avg=avg(cast( Latency as bigint)) by ts, Method
| make-series   latency_avg = latency_avg default = 'null'
                on ts
                from 'min' to 'max'
                step '1m'
                by Method
| extend ret = series_decompose_anomalies(latency_avg)
| extend anomalies_score_series = ret.anomalies_score_series, anomalies_type_series = ret.anomalies_type_series, error_msg = ret.error_msg
| render linechart with (xcolumn=__ts__,
                         ycolumns=latency_avg,
                         anomalyscore = anomalies_score_series,
                         anomalytype = anomalies_type_series)
輸出結果