LLM的普及推動了對AI訓練與推理的精細化效能檢測與調優需求,眾多在GPU節點上啟動並執行業務,期望對GPU容器進行線上效能分析。在Kubernetes容器情境中,AI Profiling作為基於eBPF和動態進程注入的無侵入式效能分析工具,支援對運行GPU任務的容器進程進行線上檢測,涵蓋Python進程、CPU調用、系統調用、CUDA庫和CUDA核函數五個方面的資料擷取能力。通過對採集資料進行分析,可以更好地定位容器應用啟動並執行效能瓶頸並掌握對資源的利用程度,進而對應用進行最佳化。而對線上業務來說,可動態掛卸載的Profiling工具可以即時地對線上業務進行較為細緻的分析,且無需對業務代碼進行修改。本文將為您介紹如何通過命令列使用AI Profiling。
準備工作
目前的版本的AI Profiling中Python Profiling能力依賴於Python解譯器的USDT功能。若要啟用Python Profiling,請在業務容器中使用以下命令確認業務Pod是否已開啟USDT。
python -c "import sysconfig; print(sysconfig.get_config_var('WITH_DTRACE'))"如果輸出為1,則表示可以啟用Python Profiling,若為0,則無法開啟。
說明Profiling任務目前僅支援在ACK叢集中ECS及靈駿節點上運行。
如果希望使用本功能,請提交工單聯絡Container Service團隊擷取最新版本的kubectl-plugin下載連結及最新版本的Profiling鏡像地址。
操作步驟
步驟一:部署kubectl外掛程式
AI Profiling的部署採用kubectl-plugin的方式,具體步驟如下:
執行以下命令安裝該外掛程式,本文以Linux_amd64為例。
wget https://xxxxxxxxxxxxxxxxx.aliyuncs.com/kubectl_prof_linux_amd64
mv kubectl_prof_linux_amd64 /usr/local/bin/kubectl-prof
chmod +x /usr/local/bin/kubectl-prof
執行以下命令,查看外掛程式是否安裝成功。
kubectl prof deploy -h預期輸出:
deploy the profiling tool pod

Usage:
  kubectl-profile deploy [flags]

Aliases:
  deploy, run

Flags:
      --container string        Specify the target container name
  -d, --duration uint           Specify the profiling duration in seconds (default 60)
  -h, --help                    help for deploy
      --image string            Specify the profiling tool image
      --kubeconfig string       Specify the kubeconfig file
      --memory-limit string     Specify the memory limit (default "1Gi")
      --memory-request string   Specify the memory request (default "128Mi")
      --namespace string        Specify the target pod namespace (default "default")
      --node string             Specify the node name
      --pod string              Specify the target pod name
      --region-id string        Specify the region-id
      --ttl uint                Specify the ttl (default 60)
步驟二:選取目標業務容器並建立Profiling任務
選定業務Pod,擷取其Namespace、Name和Node參數,本文以一個Pytorch訓練任務為例。
NAME                              READY   STATUS    RESTARTS   AGE   IP               NODE
pytorch-train-worker-sample   	  1/1     Running   0          82s   172.23.224.197   cn-beijing.10.0.17.XXX
使用擷取的參數執行以下命令提交Profiling Job。指定需要進行Profiling的業務Pod和容器,Profiling Job將在業務Pod的目標容器所在節點建立Profiling Pod。
kubectl prof deploy \
    --image xxxxxxxxxx \                # 請替換為阿里雲提供的Profiling鏡像地址
    --duration 100000 \ 		# Profiling Pod環境持續的時間
    --namespace default \ 		# 業務Pod的Namespace
    --region-id cn-beijing \		# 環境所在的阿里雲Region ID
    --pod pytorch-train-worker-sample \ # 業務Pod的Name
    --container pytorch \		# 業務Pod的Container Name
    --memory-limit 10G \		# Profiling Pod的記憶體限制
    --memory-request 1G			# Profiling Pod的記憶體申請
步驟三:觸發開啟Profiling
執行如下命令,查看Profiling Pod相關資訊。
kubectl get pod預期輸出:
NAME                                                   READY   STATUS    RESTARTS   AGE
ai-profiler-89bf5b305acf2ec-xxxxx                      2/2     Running   0          1m
執行如下命令,進入Profiling Pod。
kubectl exec -ti ai-profiler-89bf5b305acf2ec-xxxxx -c debugger -- bash執行以下命令,列出所有的GPU進程,並產生Profiling命令模板。
llmtracker generateCommand預期輸出:
I0314 11:42:42.389890 2948136 generate.go:51] GPU PIDs in container: I0314 11:42:42.389997 2948136 generate.go:53] PID: xxxxx, Name: {"pid":xxxxx} I0314 11:42:42.390008 2948136 generate.go:69] The profiling command is: llmtracker profile\ -p <ProcessID-To-Profiling>\ -t <Profiling-Type(python,cuda,syscall,cpu or all)>\ -o /tmp/data.json\ -v 5\ --cpu-buffer-size <CPU-Buffer-Size, recommand to 20>\ --probe-file <Enable-CUDA-Lib-Profile-File>\ -d <Duration-To-Profiling>\ --delay <Delay-Time>\ --enable-cuda-kernel <Enable-CUDA-Kenrel-Profile(true or none)> I0314 14:37:12.436071 3083714 generate.go:86] Profiling Python Path is: /usr/bin/python3.10. If you want to profiling Python, please ser the environment variable: export EBPF_USDT_PYTHON_PATH=/usr/bin/python3.10說明若您需要開啟Python層面的Profiling,需要在執行Profiling環境中先設定輸出中的環境變數。
參數及說明如下所示:
參數
說明
-p指定需要進行Profiling的PID。可多次使用以支援多個PID。
-t指定Profiling類型,可選項為python、cuda、syscall、cpu。如需全部開啟,請填
all。-o指定Profiling結果的輸出檔案路徑和名稱,預設為
/tmp/data.json。-v指定日誌輸出的等級。
--cpu-buffer-size指定eBPF資料擷取的CPU緩衝區大小,預設值為20。
--probe-file指定CUDA Lib Profiling所需的模板檔案,請參見編寫規範,也可直接使用預設範本。
-d設定Profiling任務的期間,單位為秒。由於長時間開啟Profiling會抓取大量資料, 導致記憶體和磁碟壓力增大,不建議超過60s。
--delay設定Profiling啟動的延遲時間,單位為秒,若您開啟CUDA Kernel部分的Profiling,該參數建議設定為2以上。
--enable-cuda-kernel指定是否開啟CUDA Kernel部分的Profiling,設定為true為開啟。
其中,
-t cuda與--enable-cuda-kernel的區別如下:-t cuda使用eBPF採集CUDA庫Symbol的調用,包括每個API函數的調用時間和調用參數,進而具體分析過程中實際的調用情況。--enable-cuda-kernel:通過進程注入技術來採集CUDA Kernel函數的具體執行資訊,從而詳細的查看GPU端的任務流轉狀態。
更多全量參數,可執行
llmtracker profile -h命令查看。使用如下樣本內容執行Profiling,根據需求修改產生的Profiling命令。
說明本樣本為開啟了全部Profiling項(包含CUDA Kernel Profiling),CUDA Lib配置為
probe.json,輸出檔案路徑為/tmp/data.json,且添加--delay 3 -d 5表明延遲3s開始並持續5s的Profiling。export EBPF_USDT_PYTHON_PATH=/usr/bin/python3.10 llmtracker profile -p xxxxx -t all -o /tmp/data.json -v 5 --enable-cuda-kernel true --cpu-buffer-size 20 --probe-file probe.json --delay 3 -d 5執行如下命令,格式化結果檔案並匯出。
說明本步驟將結果檔案轉換為標準格式,以便於在TimeLine中展示。
如果結果檔案包含CUDA Kernel的Profiling資料,則需要添加參數
--cupti-dir,並將其固定為路徑/tmp。
llmtracker export -i /tmp/data.json -o /output/out.json --cupti-dir /tmp
步驟四:Profiling結果展示
使用Tensorboard展示分析
若您使用OSS、NAS等儲存,您可以參見查看TensorBoard查看結果資料的方式,在叢集中啟動一個掛載了包含Profiling結果資料的PVC的TensorBoard Pod,開啟TensorBoard查看相關資料。
使用Chrome Tracing展示分析
若您使用本機存放區,需要將產生的profiling結果檔案拷貝到本地,然後通過Chrome Tracing(Perfetto)開啟檔案進行查看。
效果展示
Tensorboard展示
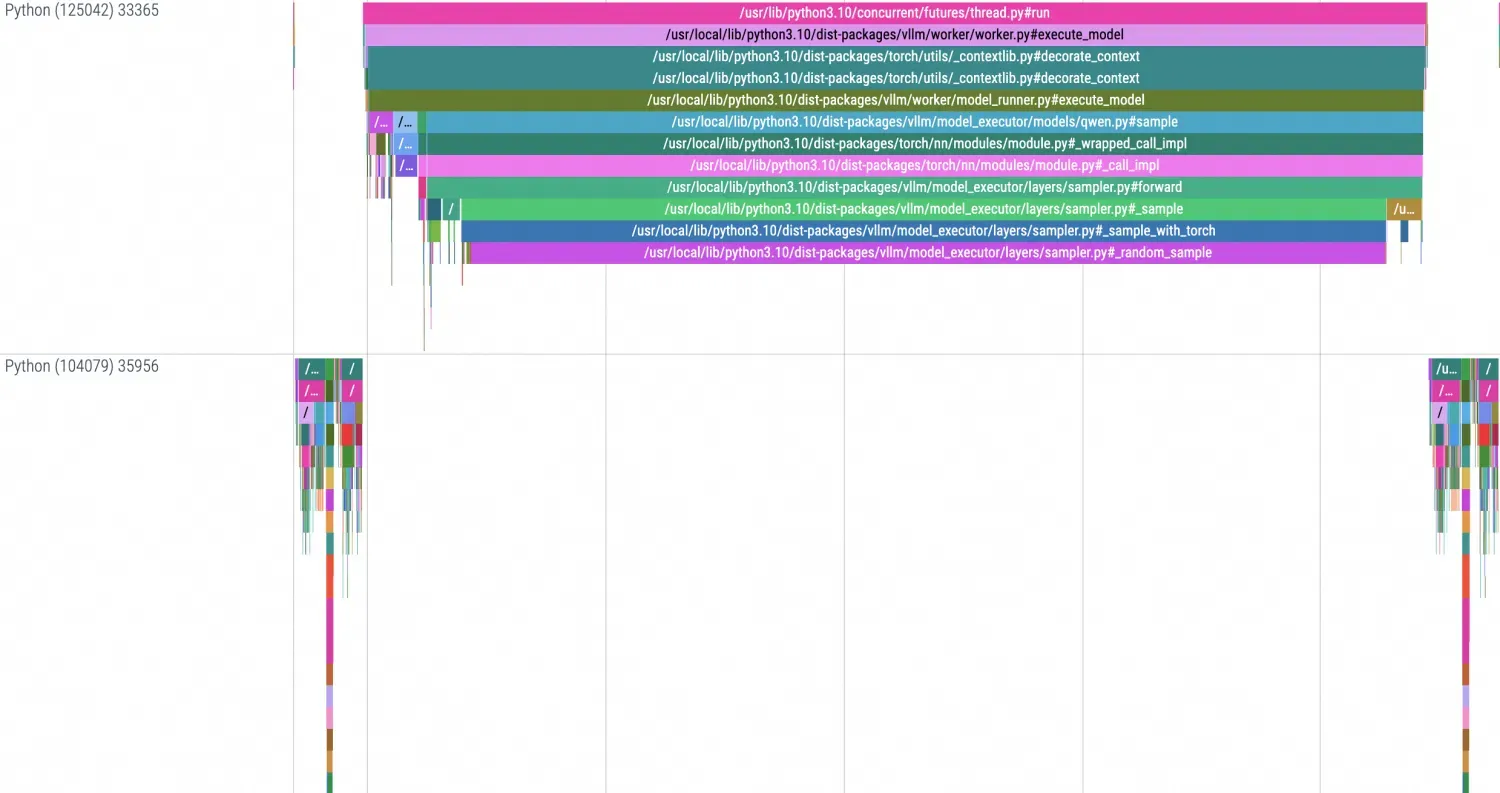
使用TensorBoard展示的TimeLine效果如下:
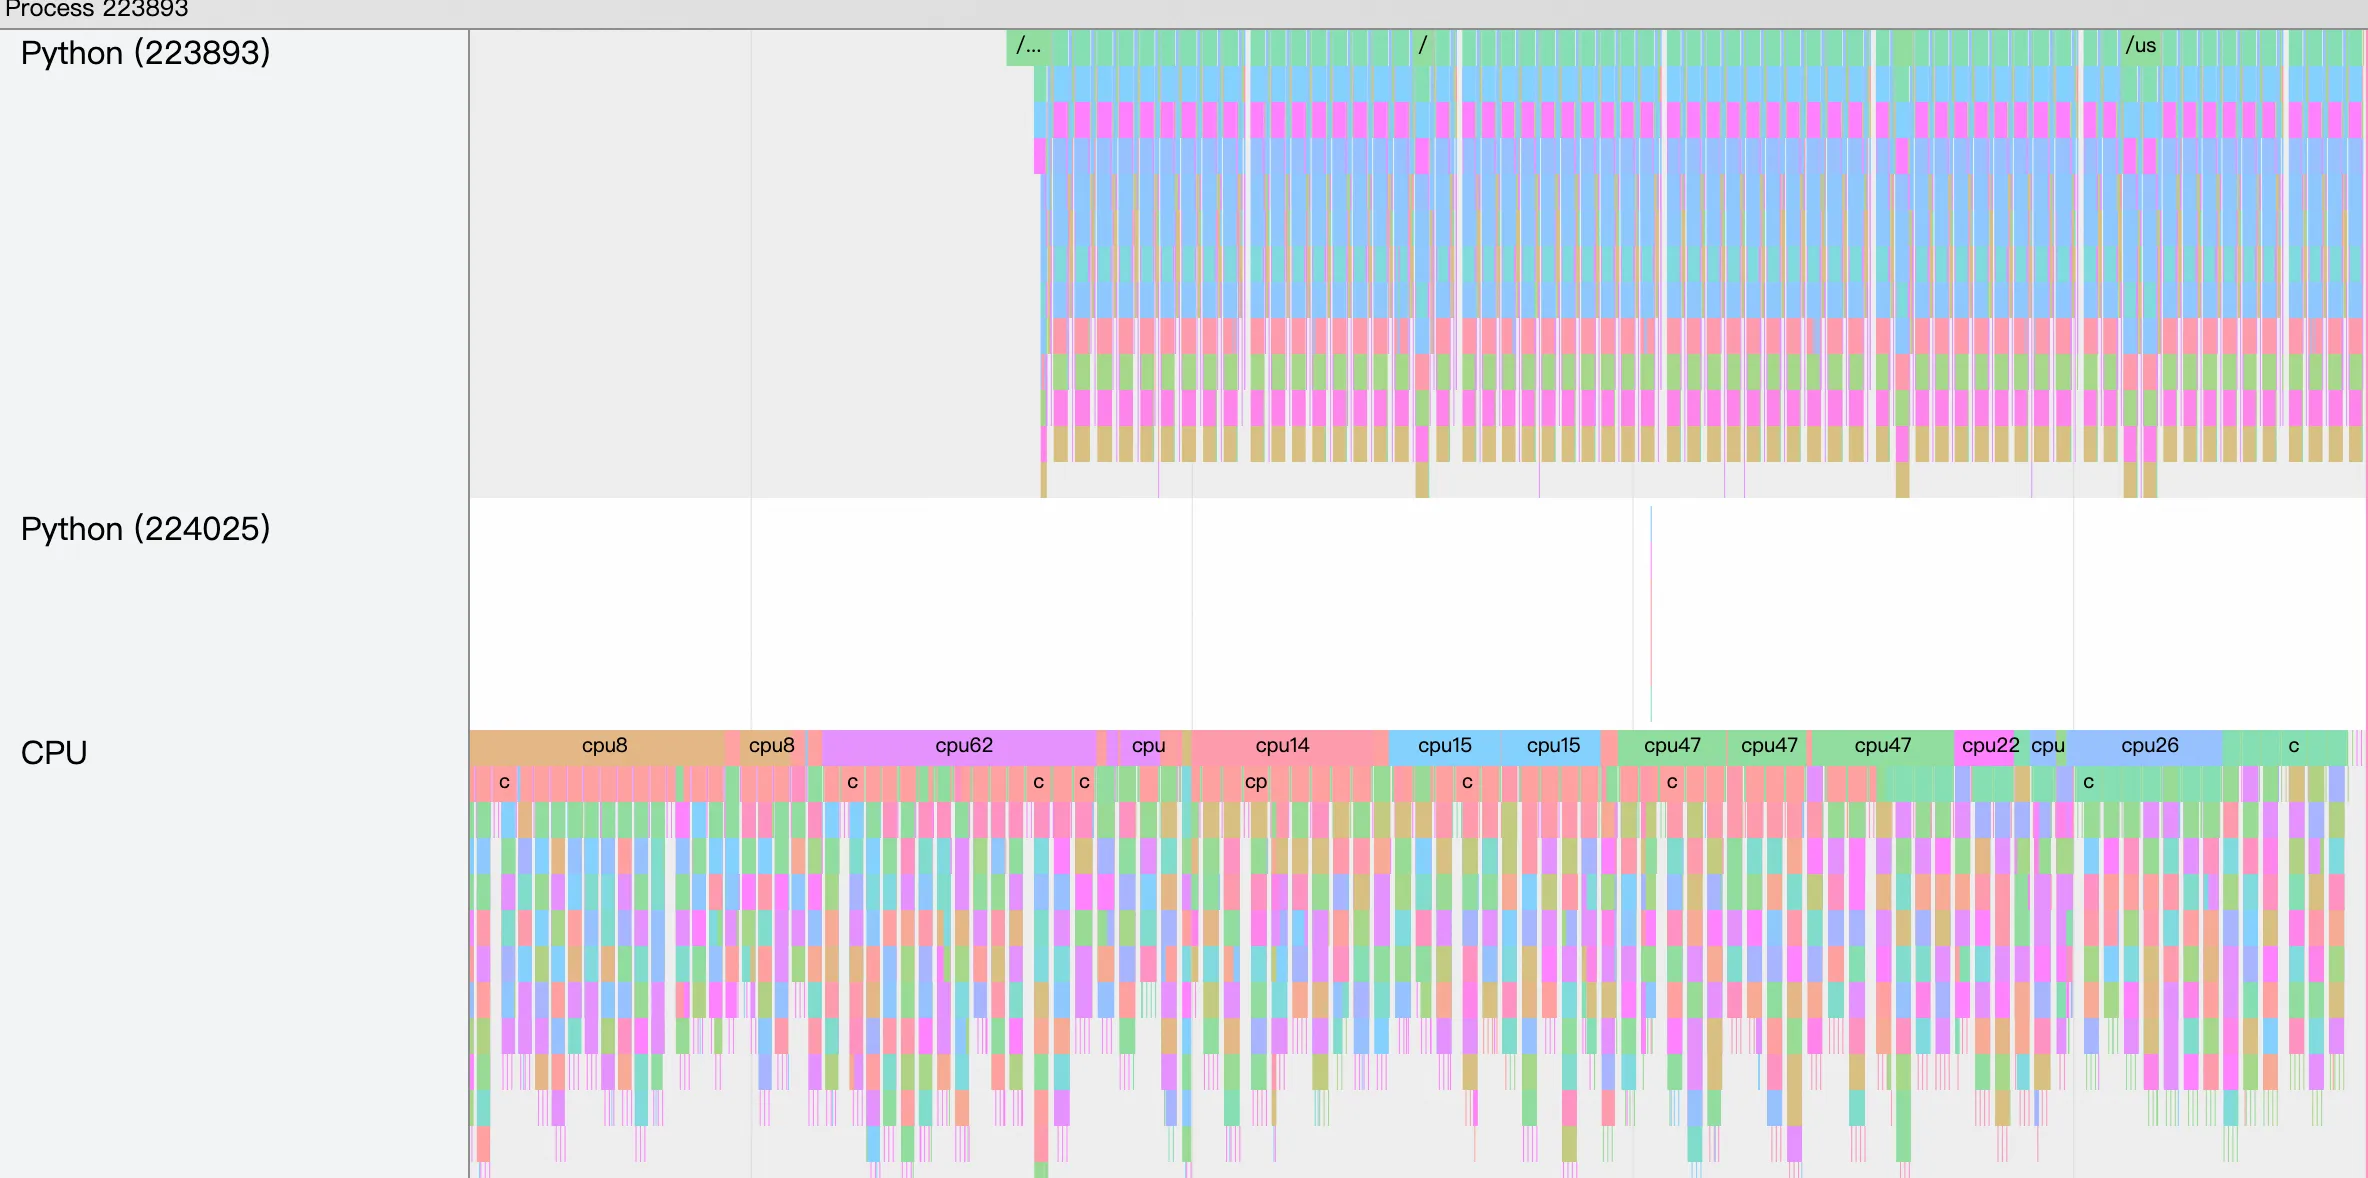
Chrome Tracing展示
本地使用Chrome Tracing展示的TimeLine效果如下:
AI Profiling附錄
CUDA Lib設定檔
擷取目標庫的遞迴依賴並進一步篩選庫檔案。在篩選出或確認自己期望追蹤的庫檔案後,可以通過
ldd命令來擷取目標抓取庫檔案的連結依賴,從而確定可以抓取有效資料的庫檔案範圍。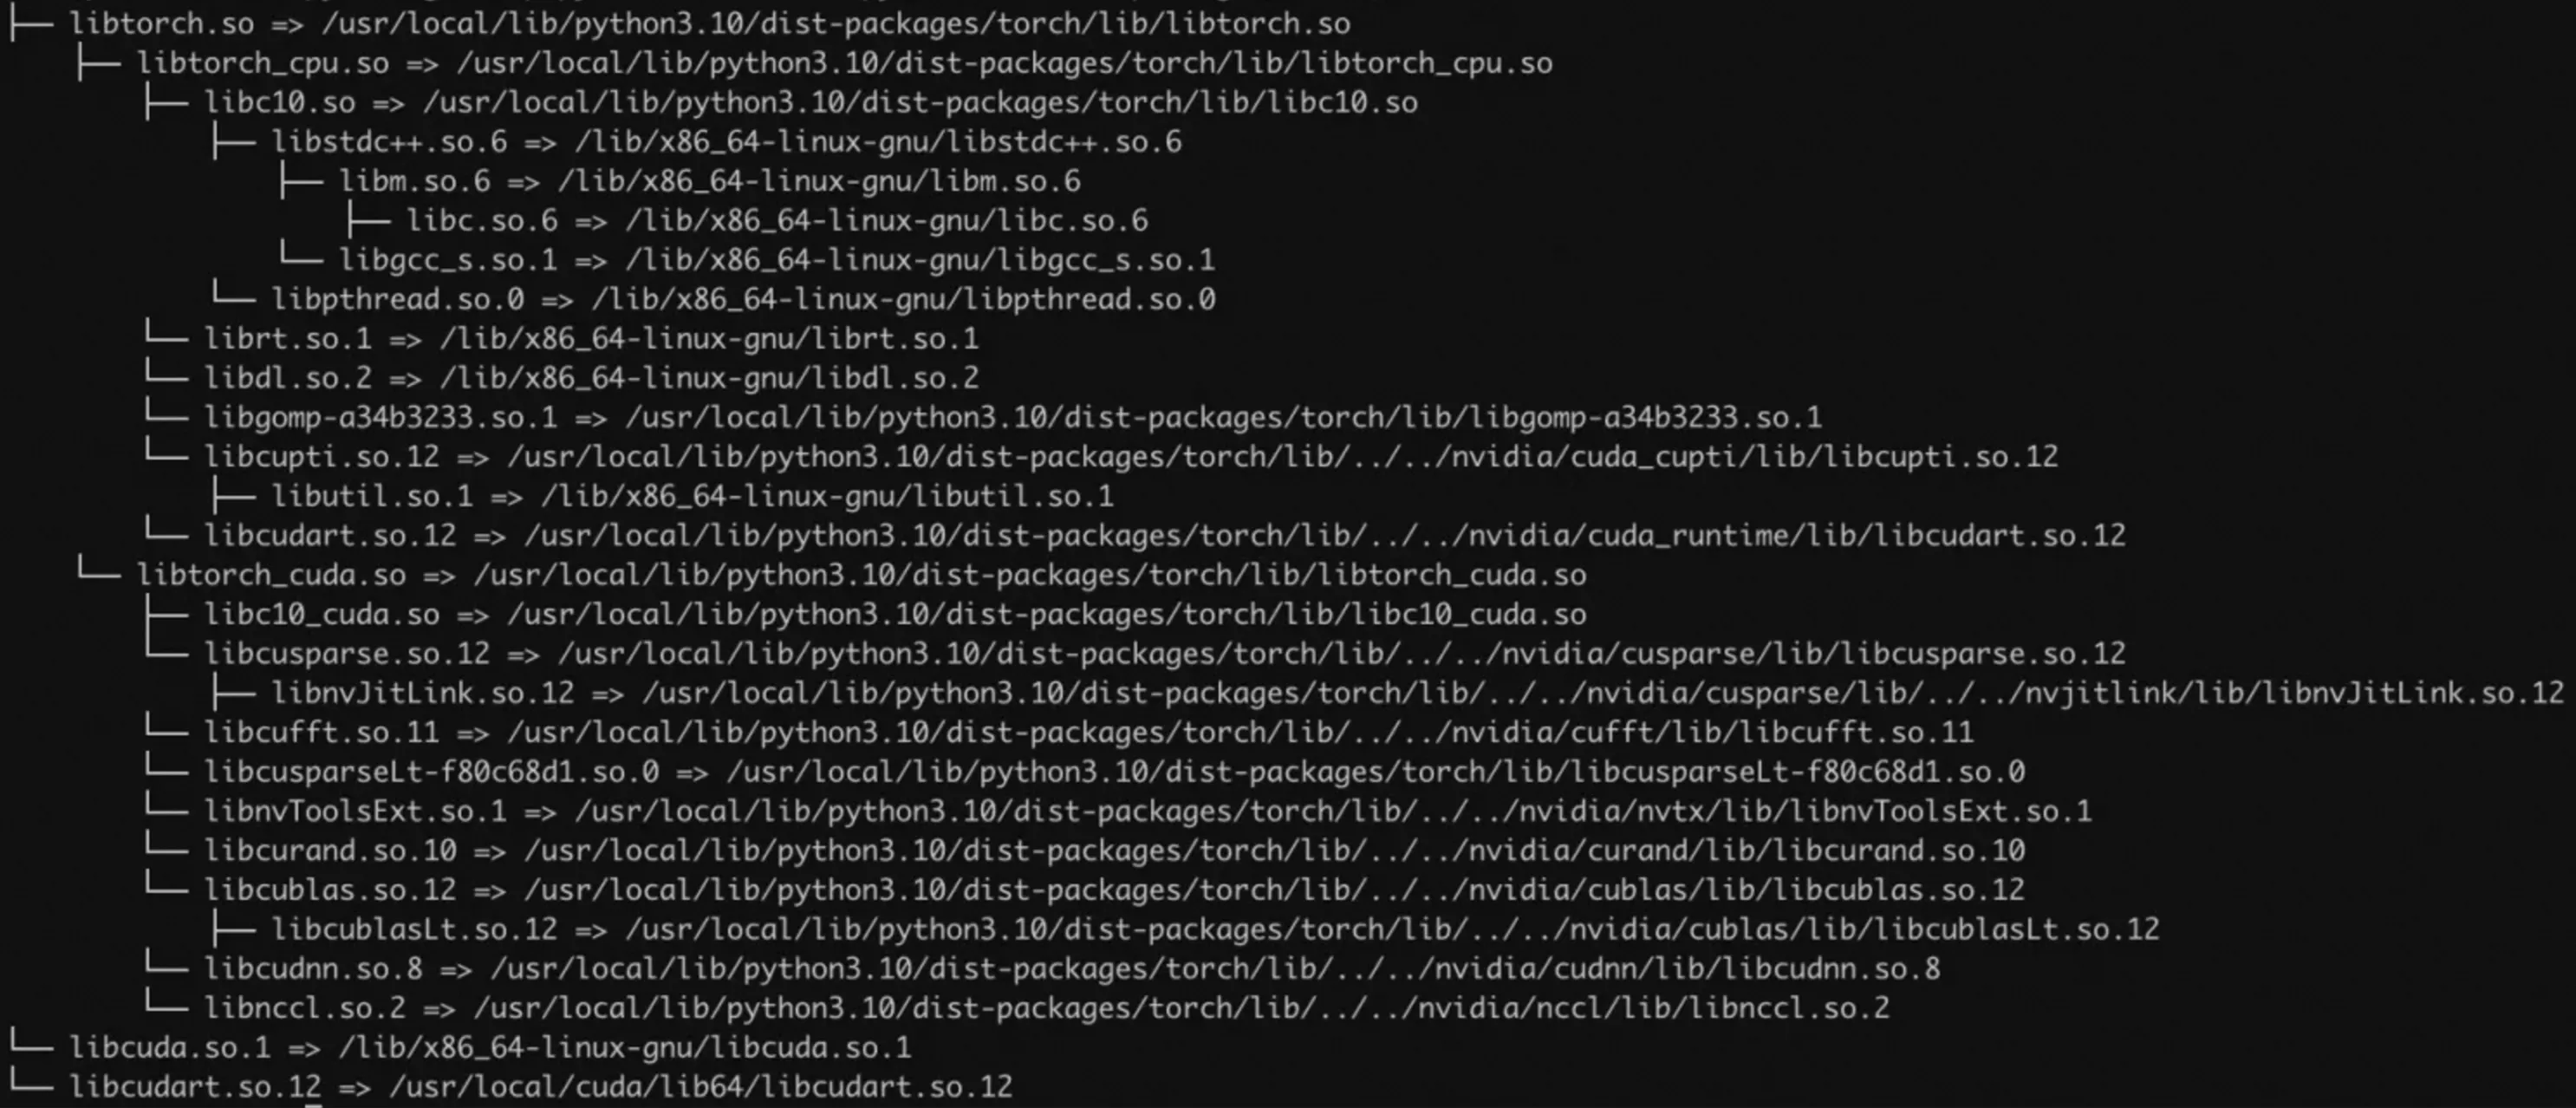
確定了目標庫檔案後,需要確認該庫中的模板符號。本步驟以libnccl.so為例,執行如下命令,擷取該庫中所有的符號資訊。
readelf -Ws libnccl.so.2 | grep pnccl預期輸出:
...
   223: 00000000000557d0   650 FUNC    GLOBAL DEFAULT   11 pncclGroupStart
   224: 0000000000050200   243 FUNC    GLOBAL DEFAULT   11 pncclRedOpDestroy
   225: 0000000000062081   656 FUNC    GLOBAL DEFAULT   11 pncclCommAbort
   227: 000000000006320c   721 FUNC    GLOBAL DEFAULT   11 pncclCommUserRank
   228: 0000000000064ee0    20 FUNC    GLOBAL DEFAULT   11 pncclGetVersion
   231: 0000000000045f60  1778 FUNC    GLOBAL DEFAULT   11 pncclAllGather
   232: 00000000000604f8  1578 FUNC    GLOBAL DEFAULT   11 pncclCommInitAll
   233: 000000000004ff20   728 FUNC    GLOBAL DEFAULT   11 pncclRedOpCreatePreMulSum
   238: 0000000000074520   653 FUNC    GLOBAL DEFAULT   11 pncclCommDeregister
   240: 00000000000474b0    30 FUNC    GLOBAL DEFAULT   11 pncclBcast
   243: 000000000006173d   789 FUNC    GLOBAL DEFAULT   11 pncclCommFinalize
   244: 00000000000483d0  2019 FUNC    GLOBAL DEFAULT   11 pncclSend
...
組裝Profiling所需的JSON設定檔,需要構建一個類似於以下格式的JSON檔案。該設定檔應定義Probe所需要的資訊,包括UProbe中目標庫檔案在容器中的相對路徑、庫檔案中期望監控方法的Symbol、KProbe中期望監控系統方法的Symbol,預設參考模板如下。