Simple Log Service Processing Language (SPL) は、時系列データを変換および可視化するためのコマンドを提供します。
SPL コマンド
|
コマンド |
説明 |
|
テーブルデータを系列に変換します。 |
|
|
SPL クエリの結果をグラフとしてレンダリングし、可視化します。 |
make-series
テーブルデータを系列構造に変換します。
構文
| make-series  <output> = <field-col> [default = <default-value>]
             [, ...]
             on <time-col>
             [from <time-begin> to <time-end>
              step <step-value>]
             [by <tag-col>,...]
コマンドブロック
|
コマンドブロック |
必須 |
説明 |
|
<output> = <field-col>, ... |
はい |
系列に変換する列。複数の列を指定できます。 |
|
on <time-col> |
はい |
時間列。 |
|
[default = <default-value>] & [from <time-begin> to <time-end> step <step-value>] |
いいえ |
時間列に基づいて、時間範囲、ステップ、および補完戦略を指定して、欠損値を補完します。 |
|
[by <tag-col>,...] |
いいえ |
指定された列でデータをグループ化し、集約します。 |
パラメーター
|
パラメーター |
タイプ |
説明 |
|
output |
列名 |
集約後の出力列。 |
|
field-col |
列名 |
入力列。 |
|
default-value |
文字列 |
欠損値を補完するためのメソッド。 有効値:
|
|
time-col |
列名 |
入力時間列。 |
|
time-begin |
文字列または列名 |
系列の時間範囲の開始時刻。 有効値:
|
|
time-end |
文字列または列名 |
系列の時間範囲の終了時刻。有効値:
|
|
step-value |
文字列 |
欠損値を補完するためのステップ。 サポートされている単位: |
|
tag-col |
列名 |
集約のためにグループ化する列。 |
例
生データからタイムラインを作成し、欠損値を補完します。
-
生データ
このクエリは、
Methodごとに、タイムスタンプを 60 秒のウィンドウに合わせ、集約されたメトリクスを計算します。-
SPL ステートメント
* | extend ts = second_to_nano(__time__ - __time__ % 60) | stats latency_avg = avg(cast(latency as double)), inflow_avg = avg(cast (inflow as double)) by ts, Method -
出力
このクエリは、
Method、ts、latency_avg、inflow_avgの 4 つの列を持つテーブルを返します。データはMethodでグループ化され、DeleteMachineGroup、GetCursor、GetConsumerGroupCheckPoint、PostProjectQuery、PullData、TagResources などの API メソッドの統計情報が表示されます。このテーブルには、ナノ秒単位のタイムスタンプ、平均レイテンシ、および平均流入値が含まれます。
-
-
SPL ステートメント
* | extend ts = second_to_nano(__time__ - __time__ % 60) | stats latency_max = max(cast(latency as double)), inflow_min = min(cast (inflow as double)) by ts, Method | make-series latency_max default = 'last', inflow_min default = 'last' on ts from 'min' to 'max' step '1m' by Method -
出力
結果テーブルには、
Method、__ts__、latency_arr、inflow_arrの 4 つの列があります。データはMethodでグループ化され、PullDataやUpdateMachineGroupMachineなどのメソッドの行と、それに対応する配列値が表示されます。latency_arr列とinflow_arr列には、時系列データが配列として含まれています。
render
SPL クエリの結果をグラフとしてレンダリングし、可視化します。
-
renderコマンドは、SPL クエリの最後の演算子である必要があります。 -
renderコマンドはデータを変更しません。クエリ結果の拡張プロパティに可視化パラメーターを追加します。
構文
render visualization [with ( propertyName = propertyValue [, ...])]コマンドブロック
|
コマンドブロック |
必須 |
説明 |
|
visualization |
はい |
可視化グラフのタイプ。サポートされているタイプについては、「可視化」をご参照ください。 |
|
propertyName = propertyValue |
いいえ |
キーと値のペアをコンマで区切ったリスト。サポートされているタイプについては、「プロパティ」をご参照ください。 |
パラメーター
可視化
|
可視化 |
説明 |
|
linechart |
折れ線グラフ |
プロパティ
オプションの PropertyName/PropertyValue キーと値のペアを使用して、追加のグラフレンダリングオプションを設定します。
時系列予測パラメーター
|
PropertyName |
PropertyValue |
|
xcolumn |
x 軸として使用するクエリ結果の列。 |
|
ycolumns |
y 軸として使用するクエリ結果の列名をコンマで区切ったリスト。 |
例:
... ...
| render linechart with (xcolumn = time_series,
                         ycolumns = metric_series, forecast_metric_series)
異常検出パラメーター
|
PropertyName |
PropertyValue |
|
xcolumn |
x 軸として使用するクエリ結果の列。 |
|
ycolumns |
y 軸として使用するクエリ結果の列名をコンマで区切ったリスト。 |
|
anomalyscore |
異常データポイントの異常スコアを表示します。 |
|
anomalytype |
異常データポイントの異常タイプを表示します。 |
例:
... ...
| render linechart with (xcolumn = ts,
                         ycolumns = mem_arr, cpu_arr,
                         anomalyscore = anomalies_score_series,
                         anomalytype = anomalies_type_series)
例
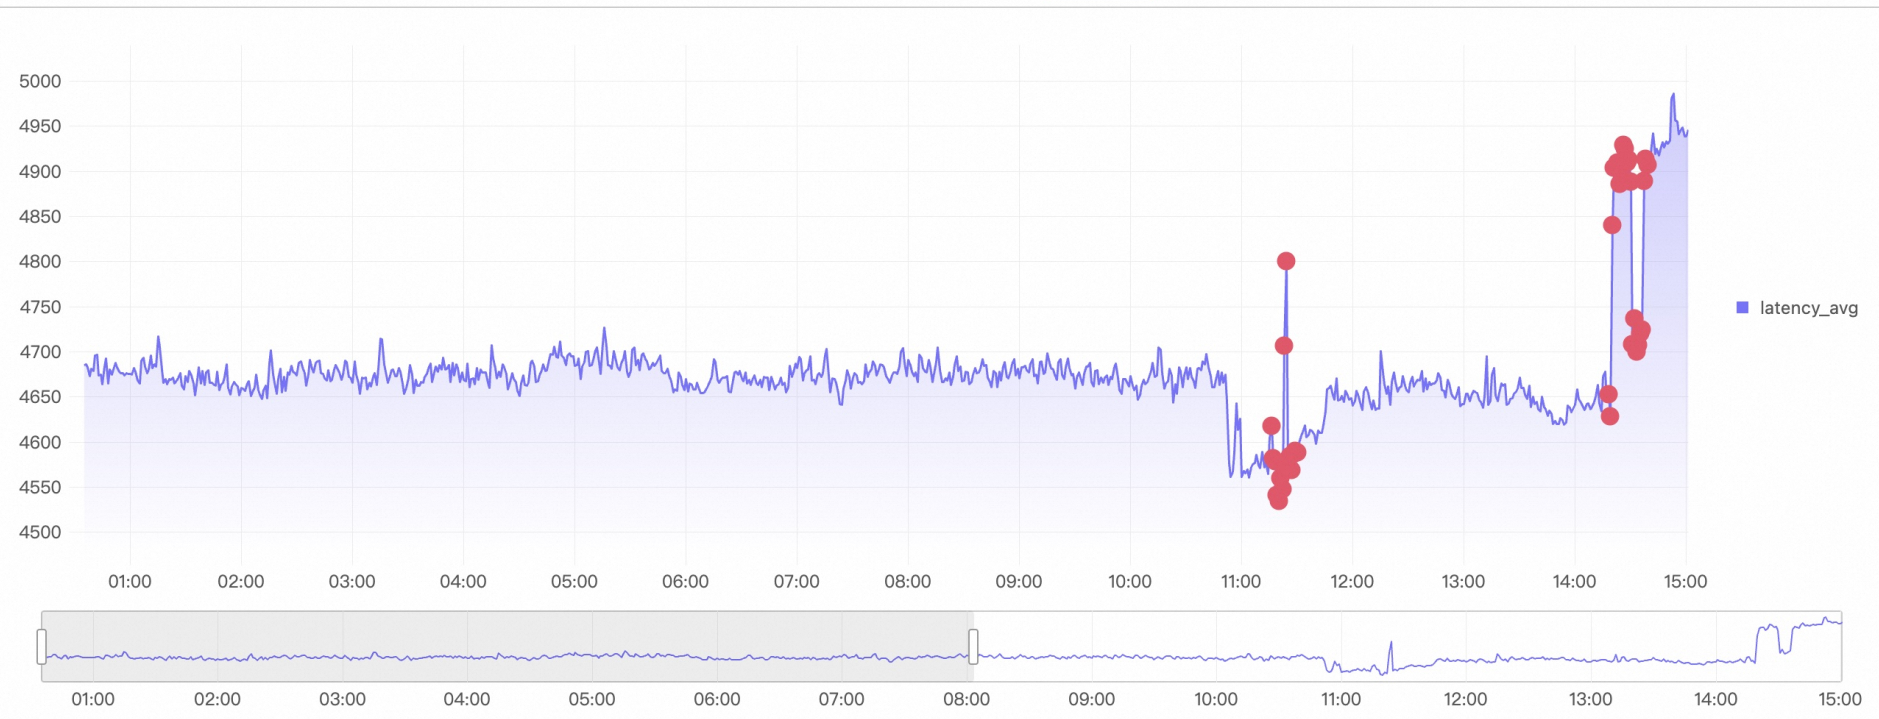
この例では、すべてのタイムラインで異常を検出し、過去 5 分間の異常スコアを保持し、結果を異常検出グラフとしてレンダリングします。
-
SPL ステートメント
* | extend ts = second_to_nano(__time__ - __time__ % 60) | where Method = 'PostLogStoreLogs' | stats latency_avg = avg(cast(latency as bigint)) by ts, Method | make-series latency_avg default = 'null' on ts from 'min' to 'max' step '1m' by Method | extend ret = series_decompose_anomalies(latency_avg) | extend anomalies_score_series = ret.anomalies_score_series, anomalies_type_series = ret.anomalies_type_series, error_msg = ret.error_msg | render linechart with (xcolumn = __ts__, ycolumns = latency_avg, anomalyscore = anomalies_score_series, anomalytype = anomalies_type_series) -
出力