APISIX が API リクエストを処理する際、リクエストの遅延、エラー伝搬、およびサービス間依存関係を可視化する必要があります。APISIX の OpenTelemetry プラグインは各リクエストに対して分散トレースを生成し、OpenTelemetry Collector を経由して OpenTelemetry 向けマネージドサービスに送信します。その後、コンソール上でトレースデータを可視化および分析できます。
APISIX の OpenTelemetry プラグインは、HTTP 経由でのみ Collector へデータを送信します。gRPC はサポートされていません。
仕組み

トレースデータは以下の 3 つのコンポーネントを経由して流れます:
APISIX が OpenTelemetry プラグインを使用して各リクエストごとにトレースを生成します。
OpenTelemetry Collector がトレースデータを受信・バッチ処理し、OTLP HTTP でエクスポートします。
OpenTelemetry 向けマネージドサービス がトレースを保存し、コンソール上で表示します。
前提条件
開始する前に、以下の条件を満たしていることを確認してください。
APISIX 2.13.0 以降
OpenTelemetry 向けマネージドサービスから取得した HTTP エンドポイント(「エンドポイントの取得」をご参照ください)
エンドポイントの取得
新規コンソール
OpenTelemetry 向けマネージドサービスコンソール にログインします。左側のナビゲーションウィンドウで、インテグレーションセンター をクリックします。
インテグレーションセンターのページで、OpenTelemetry カードを オープンソースフレームワーク セクション内からクリックします。
OpenTelemetry パネルで、統合の開始 タブをクリックし、リージョンを選択します。
リージョンへの初回アクセス時に、リソースが自動的に初期化されます。
接続タイプ および エクスポートプロトコル のパラメーターを設定し、エンドポイントをコピーします。
パラメーター 推奨値 使用タイミング 接続タイプ Alibaba Cloud VPC ネットワーク ご利用のサービスが Alibaba Cloud 上の同一リージョンで実行されている場合 接続タイプ パブリックネットワーク ご利用のサービスが Alibaba Cloud 外または異なるリージョンで実行されている場合 エクスポートプロトコル HTTP(推奨) ほとんどのクライアントでデフォルト エクスポートプロトコル gRPC クライアントが gRPC を必要とする場合 
旧コンソール
OpenTelemetry 向けマネージドサービスコンソール にログインします。
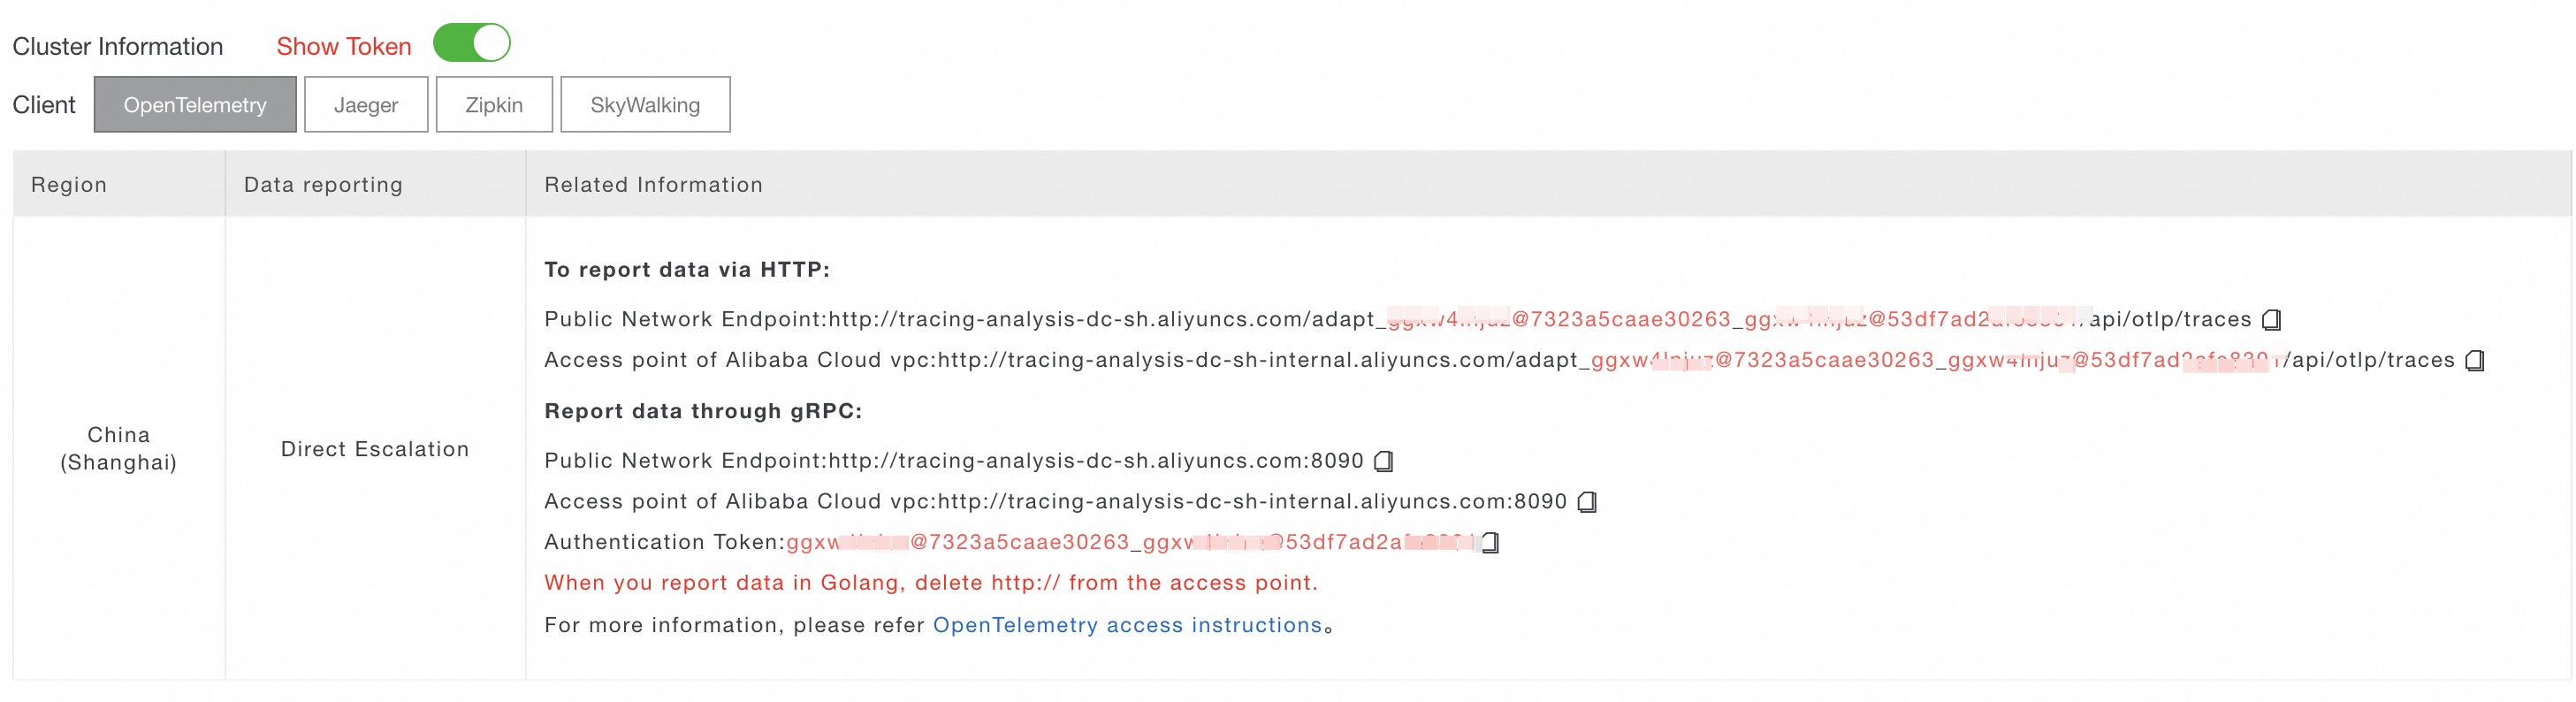
左側のナビゲーションウィンドウで、クラスタ構成 をクリックします。表示されたページで、アクセスポイント情報 タブをクリックします。
上部のナビゲーションバーでリージョンを選択します。クラスタ情報 セクションで、トークンを表示 を有効化します。
クライアント パラメーターを OpenTelemetry に設定します。関連情報 列からエンドポイントをコピーします。
アプリケーションが Alibaba Cloud の本番環境で実行される場合は、Virtual Private Cloud (VPC) エンドポイントを使用してください。それ以外の場合は、パブリックエンドポイントを使用します。
ステップ 1:OpenTelemetry Collector のデプロイメント
OpenTelemetry Collector は APISIX からトレースデータを受信し、OpenTelemetry 向けマネージドサービスへエクスポートします。ご利用の環境に応じて、以下のデプロイ方法を選択してください。
| 環境 | 方法 | 推奨 |
|---|---|---|
| ACK (Kubernetes) クラスター | ACK マーケットプレイスからインストール | Kubernetes ベースのデプロイメントに推奨 |
| Docker または VM | Docker を使用した手動インストール | Kubernetes 以外の環境向け |
オプション A:ACK マーケットプレイスからのインストール
ACK コンソール にログインします。左側のナビゲーションウィンドウで、マーケットプレイス > マーケットプレイス を選択します。
opentelemetry-collectorを検索してクリックします。表示されたパネルの右上隅にある デプロイ をクリックします。デプロイ パネルで、対象クラスターを選択し、次へ をクリックします。
パラメーター ステップで、以下の構成を追加し、OK をクリックします。
${HTTP Endpoint}を、「エンドポイントの取得」で取得したエンドポイントに置き換えてください。例:http://tracing-analysis-dc-hz.aliyuncs.com/adapt_xxxxx/api/otlp/traces。receivers: otlp: protocols: grpc: endpoint: 0.0.0.0:4317 http: cors: allowed_origins: - http://* - https://* endpoint: 0.0.0.0:4318 processors: batch: exporters: otlphttp: traces_endpoint: '${HTTP Endpoint}' tls: insecure: true service: pipelines: traces: receivers: [otlp] processors: [batch] exporters: [otlphttp]
オプション B:Docker を使用した手動インストール
その他のデプロイオプションについては、Collector のインストール をご参照ください。
以下の内容で
opentelemetry-config.yamlというファイルを作成します。このファイルでは、Collector によるトレースデータの受信・処理・エクスポート方法が定義されます。${HTTP Endpoint}を、「エンドポイントの取得」で取得したエンドポイントに置き換えてください。例:http://tracing-analysis-dc-hz.aliyuncs.com/adapt_xxxxx/api/otlp/traces。receivers: otlp: protocols: grpc: endpoint: 0.0.0.0:4317 http: cors: allowed_origins: - http://* - https://* endpoint: 0.0.0.0:4318 # OTLP HTTP Receiver processors: batch: exporters: otlphttp: traces_endpoint: '${HTTP Endpoint}' tls: insecure: true service: pipelines: traces: receivers: [otlp] processors: [batch] exporters: [otlphttp]Collector を起動します。
docker run -v $(pwd)/opentelemetry-config.yaml:/etc/otelcol-contrib/config.yaml otel/opentelemetry-collector-contrib:0.105.0
ステップ 2:APISIX における OpenTelemetry プラグインの有効化
構成方法は APISIX のバージョンによって異なります。
APISIX v3.12 以降
APISIX の
config.yamlファイルでプラグインを有効化します。... plugins: ... # その他の有効化済みプラグイン。 - opentelemetry # OpenTelemetry プラグインを有効化します。Admin API を通じてプラグインのメタデータを設定します。以下のプレースホルダーを実際の値に置き換えてください。OpenTelemetry プラグインの構成方法の詳細については、「opentelemetry」トピックの「Collector の構成」セクションをご参照ください。
プレースホルダー 説明 例 ${Service Name}コンソールの アプリケーション ページに表示されるアプリケーション名 APISIX${Host IP}コンソールの トレースの詳細 ページ内の スパンの詳細 セクションに表示されるホストの IP アドレス 10.0.0.1${OpenTelemetry Collector Address}OpenTelemetry Collector の IP アドレス 127.0.0.1${admin_key}APISIX Admin API の認証キー - curl http://127.0.0.1:9180/apisix/admin/plugin_metadata/opentelemetry -H "X-API-KEY: ${admin_key}" -X PUT -d ' { "trace_id_source": "x-request-id", "resource": { "service.name": "${Service Name}", "host.ip":"${Host IP}" }, "collector": { "address": "${OpenTelemetry Collector Address}:4318", "request_timeout": 3, "batch_span_processor": { "drop_on_queue_full": false, "max_queue_size": 1024, "batch_timeout": 2, "inactive_timeout": 1, "max_export_batch_size": 16 }, "set_ngx_var": false } }'
APISIX v3.12 より前のバージョン
APISIX の config.yaml ファイル内でプラグインを有効化し、Collector のアドレスを設定します。
以下のプレースホルダーを実際の値に置き換えてください:
| プレースホルダー | 説明 | 例 |
|---|---|---|
${Service Name} | コンソールの アプリケーション ページに表示されるアプリケーション名 | APISIX |
${Host IP} | コンソールの トレースの詳細 ページ内の スパンの詳細 セクションに表示されるホストの IP アドレス | 10.0.0.1 |
${OpenTelemetry Collector Address} | OpenTelemetry Collector の IP アドレス | 127.0.0.1 |
   ...
   plugins:
     ... # その他の有効化済みプラグイン。
     - opentelemetry # OpenTelemetry プラグインを有効化します。
plugin_attr:
...
opentelemetry: # OpenTelemetry プラグインの構成。
resource:
service.name: ${Service Name} # アプリケーション名。
host.ip: ${Host IP} # ホストの IP アドレス。
collector:
address: ${OpenTelemetry Collector Address}:4318 # Collector の OTLP HTTP 受信エンドポイント。
request_timeout: 3
batch_span_processor: # バッチ処理の構成。
drop_on_queue_full: false
max_queue_size: 6
batch_timeout: 2
inactive_timeout: 1
max_export_batch_size: 2OpenTelemetry プラグインの構成方法の詳細については、「opentelemetry」トピックの「Collector の構成」セクションをご参照ください。
ステップ 3:プラグインの適用範囲の設定
APISIX Admin API を使用して、OpenTelemetry プラグインをグローバルに適用するか、特定のルートに適用します。
グローバル適用
すべてのルートに対してプラグインを有効化します:
samplerパラメーターをalways_onに設定すると、すべてのリクエストがトレースされ、トレースが生成されます。
curl 'http://127.0.0.1:9080/apisix/admin/global_rules/1' \
-H 'X-API-KEY:  edd1c9f034335f136f87ad84b625c8f1' \
-X PUT -d '{
  "plugins": {
      "opentelemetry": {
          "sampler": {
              "name": "always_on"
          }
      }
  }
}'
特定ルートへの適用
/get に一致するリクエストのみでプラグインを有効化します:
curl http://127.0.0.1:9080/apisix/admin/routes/1 \
-H 'X-API-KEY: edd1c9f034335f136f87ad84b625c8f1' \
-X PUT -d '
{
  "uri": "/get",
  "plugins": {
      "opentelemetry": {
          "sampler": {
              "name": "always_on"
          }
      }
  },
  "upstream": {
      "type": "roundrobin",
      "nodes": {
          "httpbin.org:80": 1
      }
  }
}'
OpenTelemetry の属性の構成方法の詳細については、「opentelemetry」トピックの「属性」セクションをご参照ください。
ステップ 4:コンソールでのトレースの確認
プラグインの構成後に、APISIX を経由してリクエストを送信してトレースを生成し、OpenTelemetry 向けマネージドサービスコンソールで確認します。
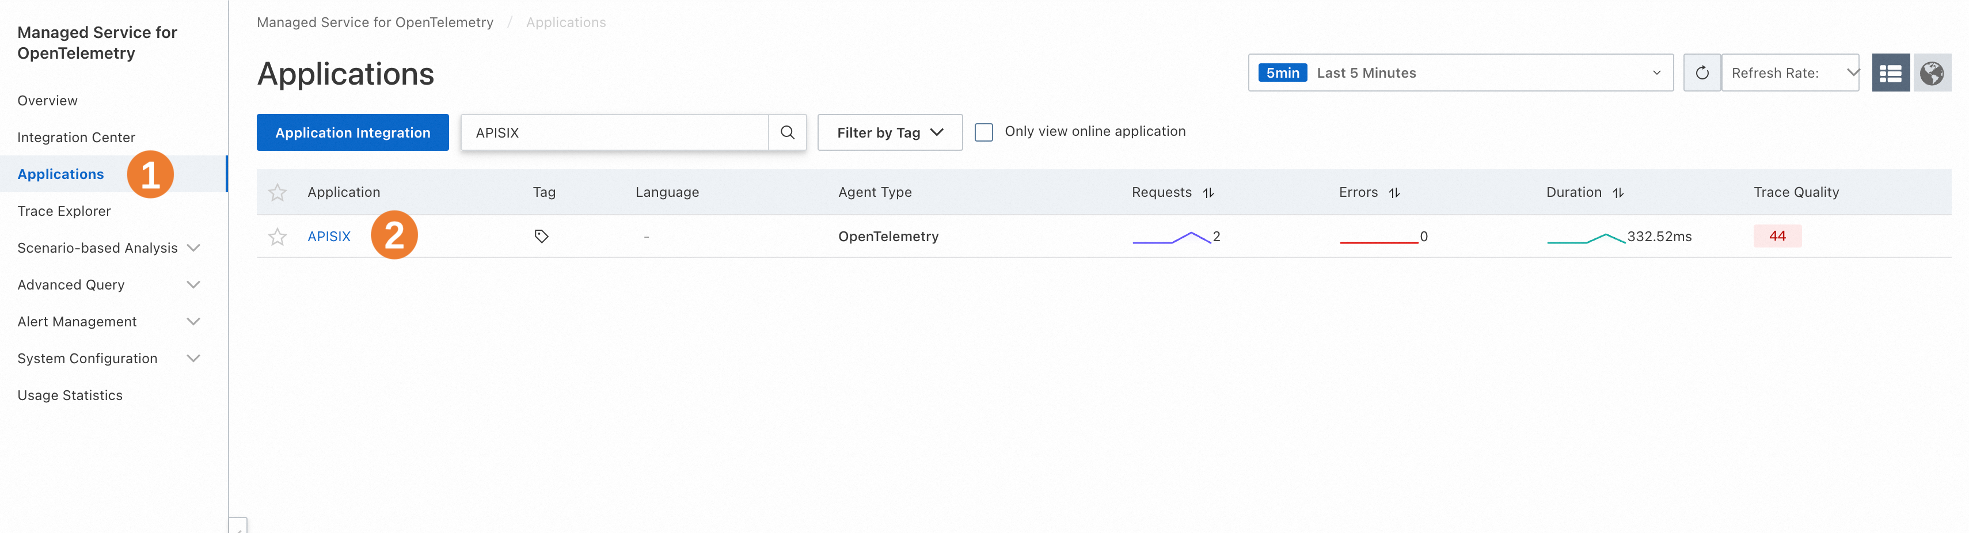
OpenTelemetry 向けマネージドサービスコンソール にログインします。アプリケーション ページで、APISIX アプリケーションの名前をクリックします。
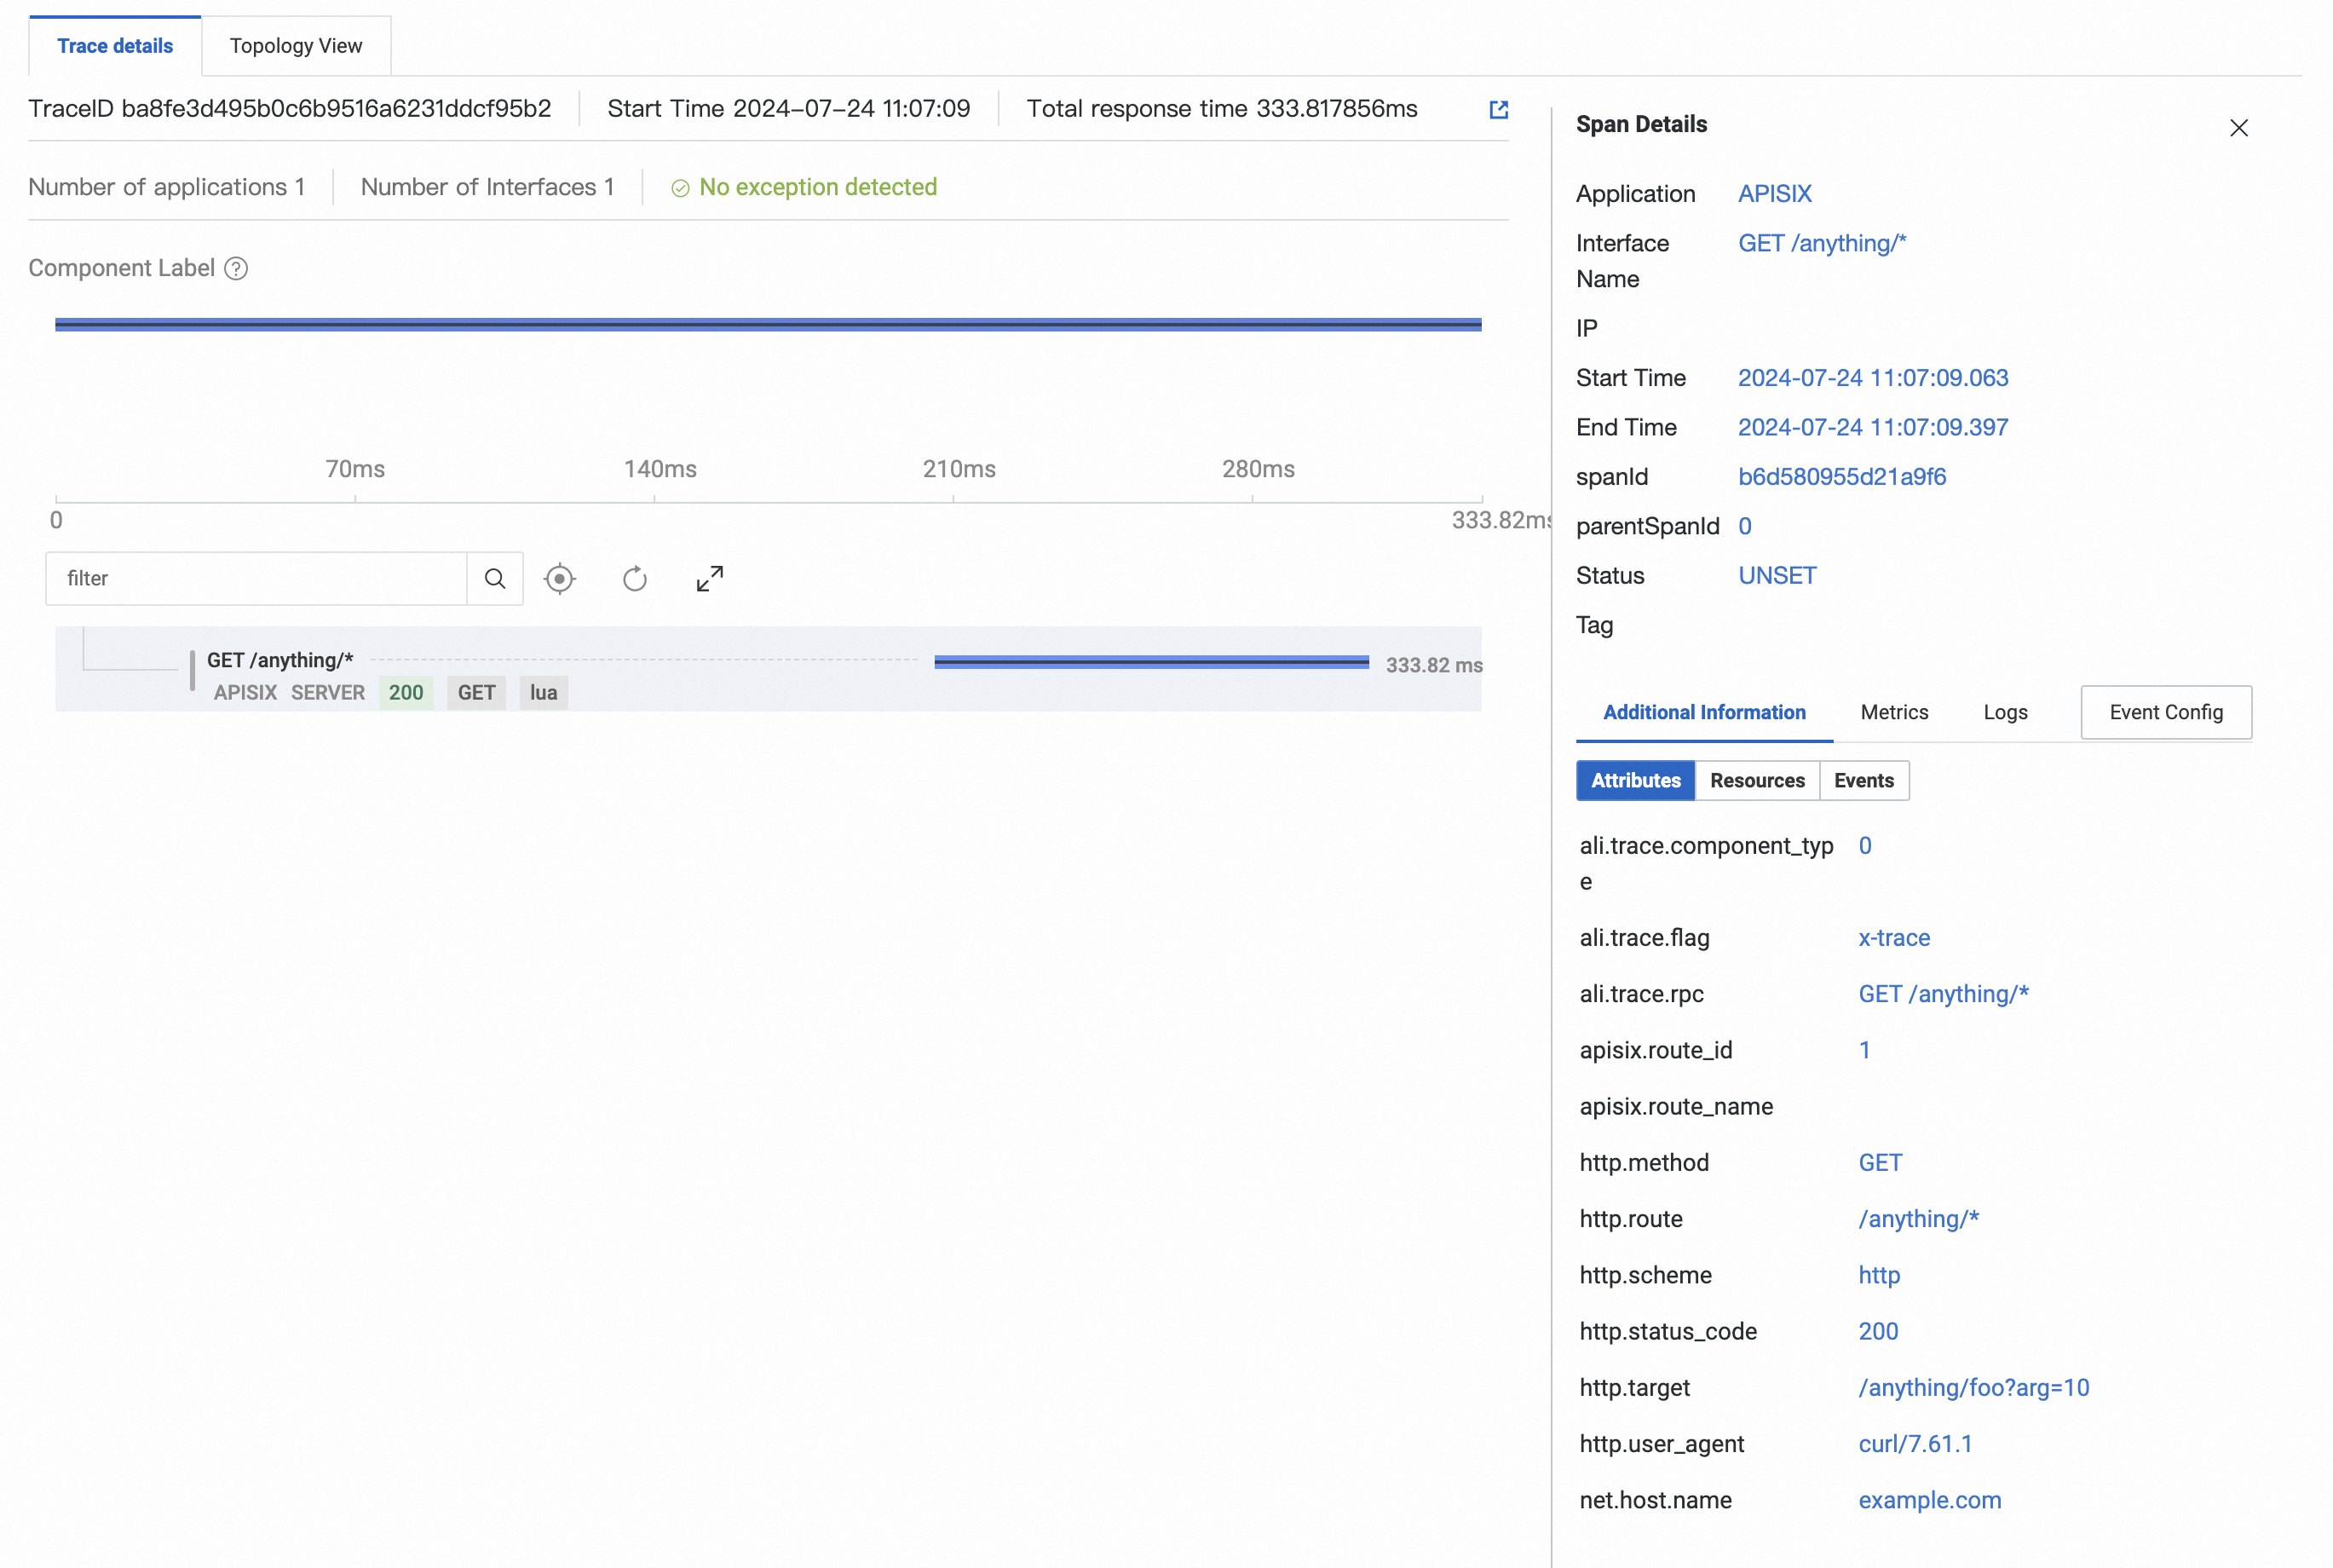
トレースの詳細 タブで、APISIX のトレース情報を確認します。
Docker Compose を使用したエンドツーエンドの例
この例では、公式の APISIX Docker Compose デモを使用して、OpenTelemetry Collector を含む完全な APISIX スタックをデプロイします。
前提条件
開始する前に、以下の条件を満たしていることを確認してください。
Git、Docker、および Docker Compose がインストール済みであること
APISIX 2.13.0 以降であること
OpenTelemetry 向けマネージドサービスから取得した HTTP エンドポイントがあること
手順
APISIX Docker デモをクローンします。
   git clone https://github.com/apache/apisix-docker.git
   cd apisix-docker/example
OpenTelemetry Collector の構成を追加します。
apisix-docker/exampleディレクトリ内にot_confというフォルダを作成し、その中にconfig.yamlというファイルを作成します。${HTTP Endpoint}を、「エンドポイントの取得」で取得したエンドポイントに置き換えてください。例:http://tracing-analysis-dc-hz.aliyuncs.com/adapt_xxxxx/api/otlp/traces。receivers: otlp: protocols: grpc: endpoint: 0.0.0.0:4317 http: cors: allowed_origins: - http://* - https://* endpoint: 0.0.0.0:4318 processors: batch: exporters: otlphttp: traces_endpoint: '${HTTP Endpoint}' tls: insecure: true service: pipelines: traces: receivers: [otlp] processors: [batch] exporters: [otlphttp]Docker Compose に Collector サービスを追加します。
apisix-docker/example/docker-compose.ymlファイルを編集し、以下のサービス定義を追加します:otel-collector: image: otel/opentelemetry-collector-contrib:0.105.0 volumes: - ./ot_conf/config.yaml:/etc/otelcol-contrib/config.yaml ports: - 4317:4317 # OTLP gRPC 受信エンドポイント - 4318:4318 # OTLP HTTP 受信エンドポイント networks: apisix:# # Licensed to the Apache Software Foundation (ASF) under one or more # contributor license agreements. See the NOTICE file distributed with # this work for additional information regarding copyright ownership. # The ASF licenses this file to You under the Apache License, Version 2.0 # (the "License"); you may not use this file except in compliance with # the License. You may obtain a copy of the License at # # http://www.apache.org/licenses/LICENSE-2.0 # # Unless required by applicable law or agreed to in writing, software # distributed under the License is distributed on an "AS IS" BASIS, # WITHOUT WARRANTIES OR CONDITIONS OF ANY KIND, either express or implied. # See the License for the specific language governing permissions and # limitations under the License. # version: "3" services: apisix: image: apache/apisix:${APISIX_IMAGE_TAG:-3.9.0-debian} restart: always volumes: - ./apisix_conf/config.yaml:/usr/local/apisix/conf/config.yaml:ro depends_on: - etcd ##network_mode: host ports: - "9180:9180/tcp" - "9080:9080/tcp" - "9091:9091/tcp" - "9443:9443/tcp" - "9092:9092/tcp" networks: apisix: etcd: image: bitnami/etcd:3.5.11 restart: always volumes: - etcd_data:/bitnami/etcd environment: ETCD_ENABLE_V2: "true" ALLOW_NONE_AUTHENTICATION: "yes" ETCD_ADVERTISE_CLIENT_URLS: "http://etcd:2379" ETCD_LISTEN_CLIENT_URLS: "http://0.0.0.0:2379" ports: - "2379:2379/tcp" networks: apisix: web1: image: nginx:1.19.0-alpine restart: always volumes: - ./upstream/web1.conf:/etc/nginx/nginx.conf ports: - "9081:80/tcp" environment: - NGINX_PORT=80 networks: apisix: web2: image: nginx:1.19.0-alpine restart: always volumes: - ./upstream/web2.conf:/etc/nginx/nginx.conf ports: - "9082:80/tcp" environment: - NGINX_PORT=80 networks: apisix: prometheus: image: prom/prometheus:v2.25.0 restart: always volumes: - ./prometheus_conf/prometheus.yml:/etc/prometheus/prometheus.yml ports: - "9090:9090" networks: apisix: grafana: image: grafana/grafana:7.3.7 restart: always ports: - "3000:3000" volumes: - "./grafana_conf/provisioning:/etc/grafana/provisioning" - "./grafana_conf/dashboards:/var/lib/grafana/dashboards" - "./grafana_conf/config/grafana.ini:/etc/grafana/grafana.ini" networks: apisix: otel-collector: image: otel/opentelemetry-collector-contrib:0.105.0 volumes: - ./ot_conf/config.yaml:/etc/otelcol-contrib/config.yaml ports: - 4317:4317 # OTLP gRPC 受信エンドポイント - 4318:4318 # OTLP HTTP 受信エンドポイント networks: apisix: networks: apisix: driver: bridge volumes: etcd_data: driver: localAPISIX で OpenTelemetry プラグインを有効化します。
apisix-docker/example/apisix_conf/config.yamlファイルに以下の内容を追加します:plugins: - opentelemetry plugin_attr: prometheus: export_addr: ip: "0.0.0.0" port: 9091 opentelemetry: resource: service.name: APISIX host.ip: 127.0.0.1 collector: address: docker-apisix-otel-collector-1:4318 # OTLP HTTP 受信アドレス request_timeout: 3 batch_span_processor: drop_on_queue_full: false max_queue_size: 6 batch_timeout: 2 inactive_timeout: 1 max_export_batch_size: 2すべてのサービスを起動します。
apisix-docker/exampleディレクトリから、以下のコマンドを実行します:docker compose -p docker-apisix up -dプラグインをグローバルに有効化します。
   curl 'http://127.0.0.1:9180/apisix/admin/global_rules/1' \
   -H 'X-API-KEY: edd1c9f034335f136f87ad84b625c8f1' \
   -X PUT -d '{
       "plugins": {
           "opentelemetry": {
               "sampler": {
                   "name": "always_on"
               }
           }
       }
   }'
テスト用ルートを作成し、リクエストを送信します。
ルートを作成します。
curl "http://127.0.0.1:9180/apisix/admin/routes/1" -H "X-API-KEY: edd1c9f034335f136f87ad84b625c8f1" -X PUT -d '
{
  "methods": ["GET"],
  "host": "example.com",
  "uri": "/anything/*",
  "upstream": {
    "type": "roundrobin",
    "nodes": {
      "httpbin.org:80": 1
    }
  }
}'
リクエストを送信します。プラグインがトレースを生成し、OpenTelemetry 向けマネージドサービスにレポートします。
curl -i -X GET "http://127.0.0.1:9080/anything/foo?arg=10" -H "Host: example.com"予期される出力:
HTTP/1.1 200 OK
Content-Type: application/json
Content-Length: 501
Connection: keep-alive
Date: Wed, 24 Jul 2024 03:26:11 GMT
Access-Control-Allow-Origin: *
Access-Control-Allow-Credentials: true
Server: APISIX/3.9.0

{
  "args": {
    "arg": "10"
  },
  "data": "",
  "files": {},
  "form": {},
  "headers": {
    "Accept": "*/*",
    "Host": "example.com",
    "Traceparent": "00-xxxxxx-xxxx-01",
    "User-Agent": "curl/7.61.1",
    "X-Amzn-Trace-Id": "Root=1-xxx-xxxx",
    "X-Forwarded-Host": "example.com"
  },
  "json": null,
  "method": "GET",
  "origin": "x.x.x.x, x.x.x.x",
  "url": "http://example.com/anything/foo?arg=10"
}
応答内の
Traceparentヘッダーにより、トレースコンテキストの伝搬が有効であることが確認できます。
コンソールでトレースを確認します。
OpenTelemetry 向けマネージドサービスコンソール にログインします。アプリケーション ページで、APISIX アプリケーションの名前をクリックします。
トレースの詳細 タブで、トレース情報を確認します。
参考文献
Apache APISIX — 動的構成、負荷分散、カナリアリリースをサポートする、オープンソースのクラウドネイティブ API ゲートウェイです。
APISIX OpenTelemetry プラグイン — サンプラーのオプションやスパンの属性を含む、APISIX OpenTelemetry プラグインの完全な構成リファレンスです。
OpenTelemetry Collector のインストール — OpenTelemetry Collector のその他のデプロイオプションについて説明しています。