Grafana は、アラート機能を使用するための GUI を備えています。 Grafana で通知チャネルを追加すると、Grafana から Log Service のアラートシステムにアラートを送信できます。 アラートシステムは、受信したアラートのノイズ除去やアラート通知の送信など、アラートの処理を行います。 Grafanaバージョンが8.0より前の場合は、このトピックの指示に従うことができます。
始める前に
アラート取り込みアプリケーションが作成済みである必要があります。 詳細については、「アラート取り込み用のwebhook URLの設定」をご参照ください。Grafana の設定
- Grafanaコンソールにログインします。
- 左側のナビゲーションウィンドウで、 を選択し、[チャンネルの追加] をクリックします。
- [新しい通知チャネル] ページで、次のパラメーターを設定し、[保存] をクリックします。
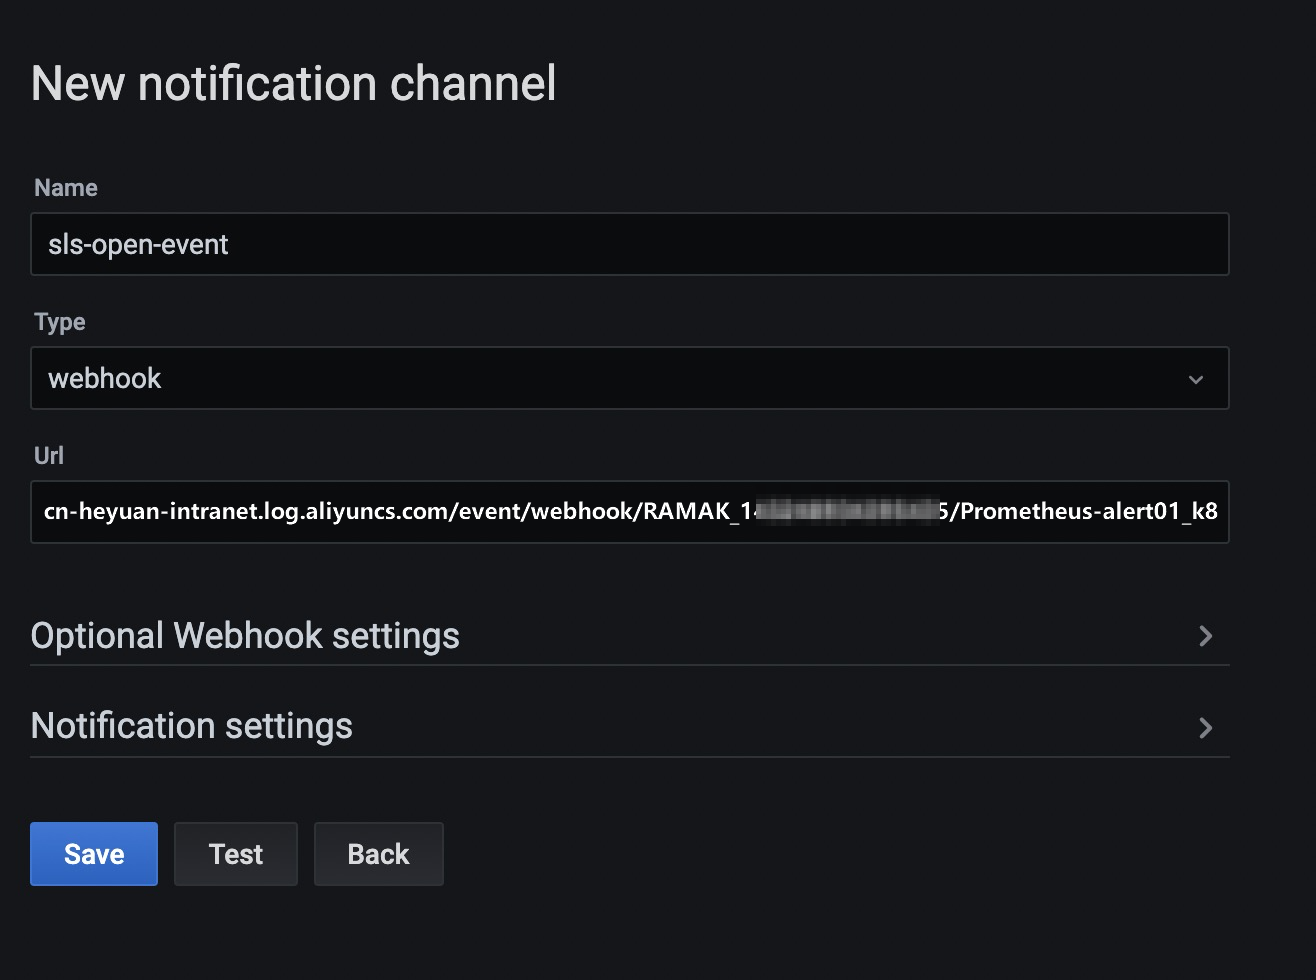
項目 説明 Name 通知チャネル名。 Type 通知チャネルのタイプ。 この例では、[webhook] を選択しています。 Url 通知チャネルの URL。 この例では、Log Service のアラート取り込みシステムでアラート取り込みサービスとアラート取り込みアプリケーションを作成すると生成される Webhook URL の完全な URL を入力しています。 詳細については、「Webhook URL の取得」をご参照ください。 説明 Grafana サーバーが Elastic Compute Service (ECS) インスタンスにデプロイされている場合は、ECS インスタンスが存在するリージョンを選択し、LAN または Virtual Private Cloud (VPC) 経由でアクセスできる内部エンドポイントを使用してリージョン情報を設定することを推奨します。 Grafana サーバーが ECS インスタンスにデプロイされていない場合は、インターネット経由でリージョンにアクセス可能なパブリックエンドポイントを使用できます。
Grafana アラート
以下に、Grafana アラートのサンプルコードを示します。
説明 Grafanaアラートに重大度フィールドが含まれている場合、GrafanaアラートがLog Serviceに取り込まれた後、Log ServiceはGrafanaアラートの重大度フィールドの値をLog Serviceアラートの重大度にマッピングします。 Grafana アラートに severity フィールドが存在しない場合、アラートの重大度はデフォルトで中レベルに設定されます。 詳細については、「重大度レベル」をご参照ください。
{
    "dashboardId": 1、
    "evalMatches": [
        {
            "value": 173.14285714285714、
            "metric": "go_gc_duration_seconds_count{instance=\" localhost: 9090\"、job=\" prometheus\"}" 、
            "tags": {
                "__name__": "go_gc_duration_seconds_count" 、
                "instance": "localhost:9090" 、
                "仕事": "プロメテウス"
            }
        }
    ],
    "message": "sadfasdf" 、
    "orgId": 1、
    "panelId": 4、
    "ruleId": 2、
    "ruleName": "fuxasdfasd" 、
    "ruleUrl": "http:// localhost:3000/d/biSKHC8Mz/new-dashboard-copy?tab=alert&viewPanel=4&orgId=1" 、
    "state": "アラート" 、
    "tags": {
        "severity" : "crit",
        "xasdfasdf": "mveonasdf"
    },
    "title": "[警告] fuxasdfasd"
}
フィールドマッピング
GrafanaアラートがLog Serviceに取り込まれると、フィールドマッピングに基づいてアラートがLog Serviceアラートに変換されます。 以下に、Log Service アラートのサンプルコードを示します。
{
    "aliuid": "{アラート取り込みアプリケーションが属するAlibaba CloudアカウントのID}" 、
    "alert_instance_id": "{自動生成されるアラートインスタンスID}" 、
    "project": "{アラートセンターが属するプロジェクト}" 、
    "region": "{アラートセンターが属するプロジェクトのリージョン}" 、
    "alert_id": "2" 、
    "alert_type": "sls_pub" 、
    "alert_name": "sadfasdf" 、
    "next_eval_interval": 0、
    "alert_time": 1603859020、
    "fire_time": 1603859020、
    "resolve_time": 0,
    "status": "firing" 、
    "labels": {
        "xasdfasdf": "mveonasdf"
    },
    "annotations": {
        "__pub_alert_region__": "{アラートの送信先のエンドポイントのリージョン}" 、
        "__config_app__": "sls_pub_alert" 、
        "__pub_alert_service__": "{アラート取り込みサービスのID}" 、
        "__pub_alert_app__": "{アラート取り込みアプリケーションのID}" 、
        "__pub_alert_protocol__": "grafana" 、
        "severity" : "crit",
        "orgId": "1" 、
        "dashboardId": "1" 、
        "panelId": "4" 、
        "ruleUrl": "http:// localhost:3000/d/biSKHC8Mz/new-dashboard-copy?tab=alert&viewPanel=4&orgId=1" 、
        "imageUrl": "" 、
        "desc": "sadfasdf" 、
        "title": "[警告] fuxasdfasd"
    },
    "severity": 10、
    "policy": {
        "alert_policy_id": "{アラート取り込みアプリケーションに指定されたアラートポリシー}" 、
        "action_policy_id": "{アラート取り込みアプリケーションに指定されているアクションポリシー}" 、
        "repeat_interval": "{アラート取り込みアプリケーションに指定された繰り返し間隔}"
    },
    "drill_down_query": "http:// localhost:3000/d/biSKHC8Mz/new-dashboard-copy?tab=alert&viewPanel=4&orgId=1" 、
    "results": [{
        "query": "go_gc_duration_seconds_count{instance=\" localhost: 9090\"、job=\" prometheus\"}" 、
        "fire_result": {
            "__name__": "go_gc_duration_seconds_count" 、
            "instance": "localhost:9090" 、
            "仕事": "プロメテウス" 、
            "value": "173.142" 、
        }
    }]
}
下表に、Log Service と Grafana 間のフィールドマッピングを示します。
| Log Service のフィールド | Grafana のフィールド | 説明 |
|---|---|---|
| aliuid | なし | アラート取り込みアプリケーションが属する Alibaba Cloud アカウントの ID。 |
| alert_id | ruleId | アラートモニタリングルールの ID。 |
| alert_type | なし | アラートのタイプ。 値は sls_pub に固定されています。 |
| alert_name | ruleName | アラートモニタリングルールのルール名。 |
| status | state | アラートのステータス。
|
| next_eval_interval | なし | アラートが評価される間隔。 値は 0 に固定されています。 |
| alert_time | なし | Log Service が Grafana アラートを受信する時刻。 |
| fire_time | なし | Log Service が Grafana アラートを受信する時刻。 |
| resolve_time | なし | アラートが作成された時刻。 値は 0 に固定されています。 |
| labels | tags | アラートのラベル。
|
| annotations | なし | GrafanaアラートがLog Serviceに取り込まれると、Log Serviceアラートのannotationsフィールドに次のフィールドが追加されます。
アラート取り込みアプリケーションの作成時に [エンリッチメント] タブで注釈を追加した場合、注釈は annotations フィールドに追加されます。
説明 [エンリッチメント] タブで指定した注釈のキーがGrafanaアラートのtagsフィールドのフィールドと同じである場合、[エンリッチメント] タブの注釈が優先されます。 |
| severity | severity | アラートの重大度レベル。 詳細については、「重大度レベル」をご参照ください。 |
| policy | なし | アラート取り込みアプリケーションに指定されているアラートポリシー。 詳細については、「ポリシー変数の説明」をご参照ください。 |
| project | なし | アラートセンターが属するプロジェクト。 詳細については、「プロジェクト」をご参照ください。 |
| drill_down_query | ruleUrl | Log Service アラートの drill_down_query フィールドには、Grafana アラートの ruleUrl フィールドの値が表示されます。 |
| results | evalMatches | 結果セット。 evalMatchesの各要素は、resultsフィールドのQueryData構造体にマップされます。 マッピングの詳細については、「結果セットのマッピング」をご参照ください。 results フィールドの詳細については、「結果変数の説明」をご参照ください。 |
| QueryData 構造 | evalMatches フィールド | 説明 |
|---|---|---|
| query | metric | クエリ 文。 |
| fire_result | tags および value | Grafana アラートの tags フィールドはキーと値のペアに展開され、 fire_result フィールド格納されます。 value フィールドは fire_result フィールドに格納されます。
value フィールドの値は小数第 3 位に四捨五入されます。 |