ダッシュボードで例外が特定された場合は、ドリルダウン分析を効率的に実行するようにインタラクションの発生を構成できます。 たとえば、[イベントの追加] ドロップダウンリストから [ログストアを開く] 、[トレース分析を開く] 、または [ダッシュボードを開く] を選択して、インタラクションの発生を設定し、例外の根本原因を特定できます。 このトピックでは、サポートされるインタラクションの種類について説明します。 このトピックでは、ダッシュボードのインタラクション発生を設定する方法についても説明します。
説明
ダッシュボードで例外が特定された場合は、ドリルダウン分析を効率的に実行するようにインタラクションの発生を構成できます。 ログストアを開く、ダッシュボードを開く、保存された検索を開く、カスタムHTTP URLを作成する、トレースの詳細を開く、フルスタックの観察可能性トレースの詳細を開くなど、インタラクションの発生の種類を設定できます。
この例では、NGINXアクセスログがサンプルログとして使用され、HTTPステータスコードという名前のダッシュボードが追加されています。 ダッシュボードの円グラフでHTTPステータスコード200に対応する部分をクリックすると、関連するLogstoreに移動し、HTTPステータスコード200が返されるリクエストのログを表示できます。 Logstoreのクエリ時間範囲は、ダッシュボードのクエリ時間範囲と同じです。
円グラフの追加: グラフのクエリ時間範囲、Logstore、およびクエリステートメントを設定します。
インタラクション発生の設定: ダッシュボードの円グラフのpvフィールドにOpen Logstoreインタラクション発生を設定し、インタラクション発生の設定時に
${{ status}}変数を追加します。 ${{ status} 変数は、指定されたクエリステートメントの関連パラメーターを動的に変更するために使用されます。 これにより、${{ status} 変数で指定されたステータスコードが指定されたLogstoreで返されたリクエストのログを表示できます。 詳細については、「変数を使用してクエリ文のパラメーターを動的に変更する」をご参照ください。
Simple Log Serviceは、次のタイプのインタラクションの発生をサポートしています。 インタラクションの発生を設定する方法の詳細については、このトピックの「手順」セクションを参照してください。
Logstoreを開く
ダッシュボードを開く
カスタムHTTP URLの作成
保存した検索を開く
オープントレース分析
オープントレースの詳細
Open Full-stack Observability Trace Analysis
フルスタックの観察可能性トレースの詳細を開く
手順
例1: Open Logstoreインタラクションの発生を設定する
1. 円グラフを追加する
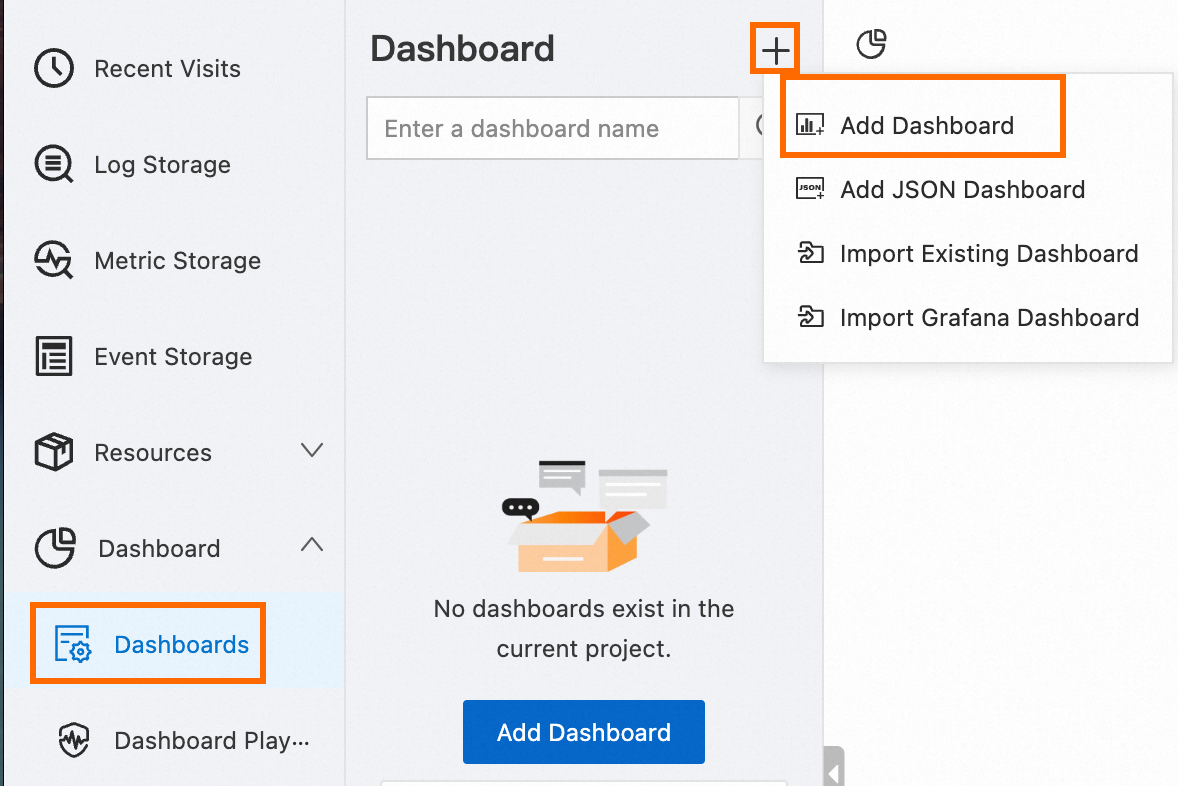
1.1 ダッシュボードの追加
ダッシュボードの追加: Simple Log Serviceコンソールにログインし、管理するプロジェクトを選択します。 [ダッシュボード]> [ダッシュボード] ページで、[HTTPステータスコード] という名前のダッシュボードを追加します。
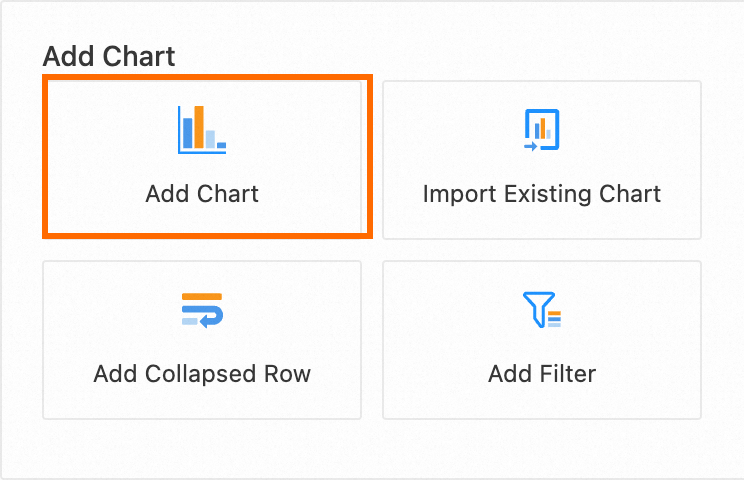
1.2 グラフの追加
[グラフの追加] をクリックします。
チャートを設定して保存します。
表示されるページの左側で、グラフのクエリ時間範囲、Logstore、およびクエリステートメントを設定します。
表示されるページの右側で、[グラフの種類] セクションでグラフの種類を選択し、[クエリと分析の設定] セクションで [カテゴリと値の列] パラメーターを設定します。 設定が完了したら、ページの上部にある [適用] をクリックして、チャートの設定効果を表示します。 次に、ページの右上隅にある [OK] をクリックしてグラフを保存します。
* |
select
  count(1) as pv ,status
group by
  status
2. インタラクション発生の設定
この例では、Open Logstoreインタラクションの発生が設定されています。 ダッシュボードの円グラフでHTTPステータスコード200に対応する部分をクリックすると、関連するLogstoreに移動し、HTTPステータスコード200が返されるリクエストのログを表示できます。 Logstoreのクエリ時間範囲は、ダッシュボードのクエリ時間範囲と同じです。
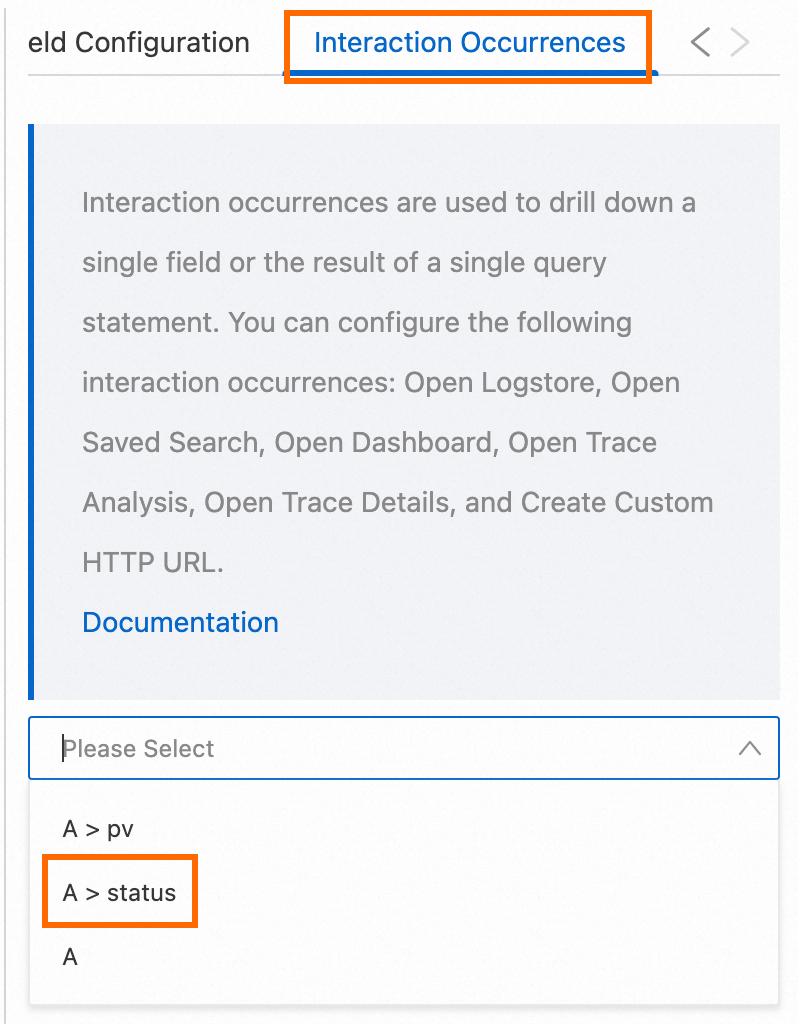
2.1 フィールドのインタラクション発生を設定する
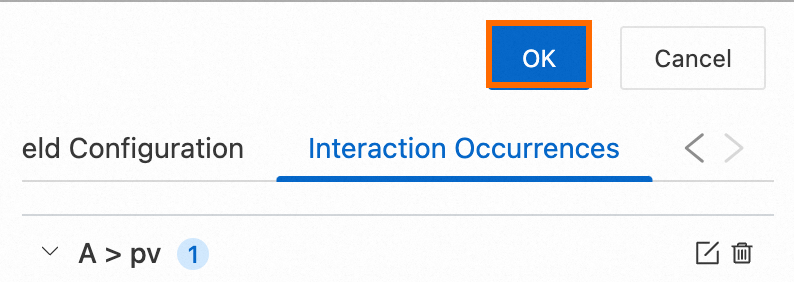
ページの右側にある [インタラクション発生] タブをクリックします。 次に、[フィールドの追加] をクリックし、ドロップダウンリストから管理するフィールドを選択します。
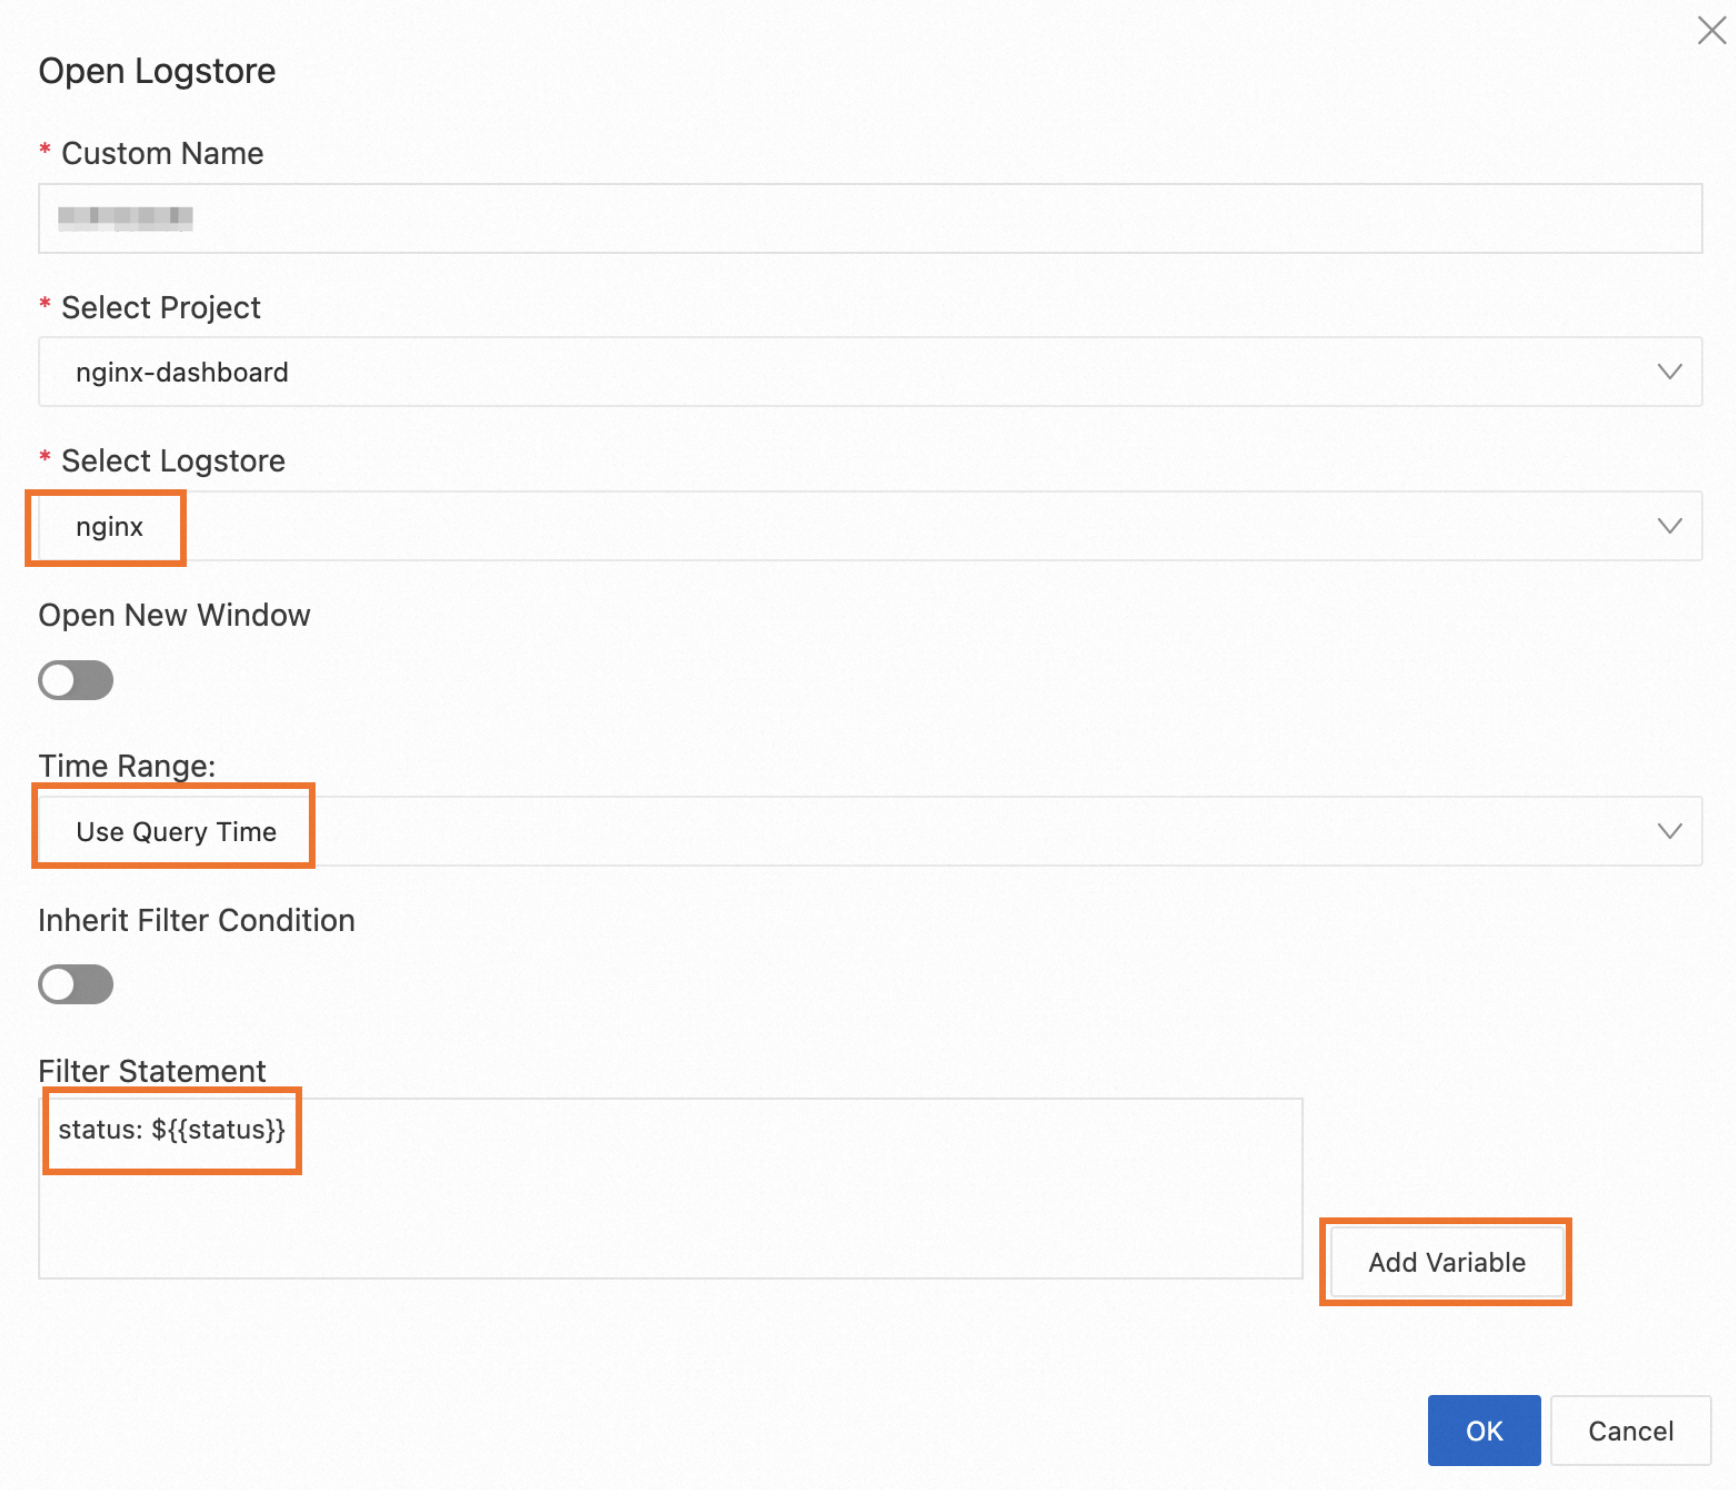
[イベントの追加] をクリックし、ドロップダウンリストから [ログストアを開く] を選択します。 [Open Logstore] ダイアログボックスで、Select Logstoreパラメーターと [Filter Statement] フィールドの動的変数を設定します。
Select Logstoreパラメーターは、データを照会するLogstoreを指定します。 Time Rangeパラメーターは、クエリ文の時間範囲を指定します。 Filter Statementパラメーターは、Logstoreのクエリと分析ページに表示されるクエリ文を指定します。
2.2 グラフとダッシュボードを保存する
グラフの編集ページの右上隅にある [OK] をクリックします。
ダッシュボードページの右上隅にある [保存] をクリックします。
2.3 インタラクションの発生を確認する
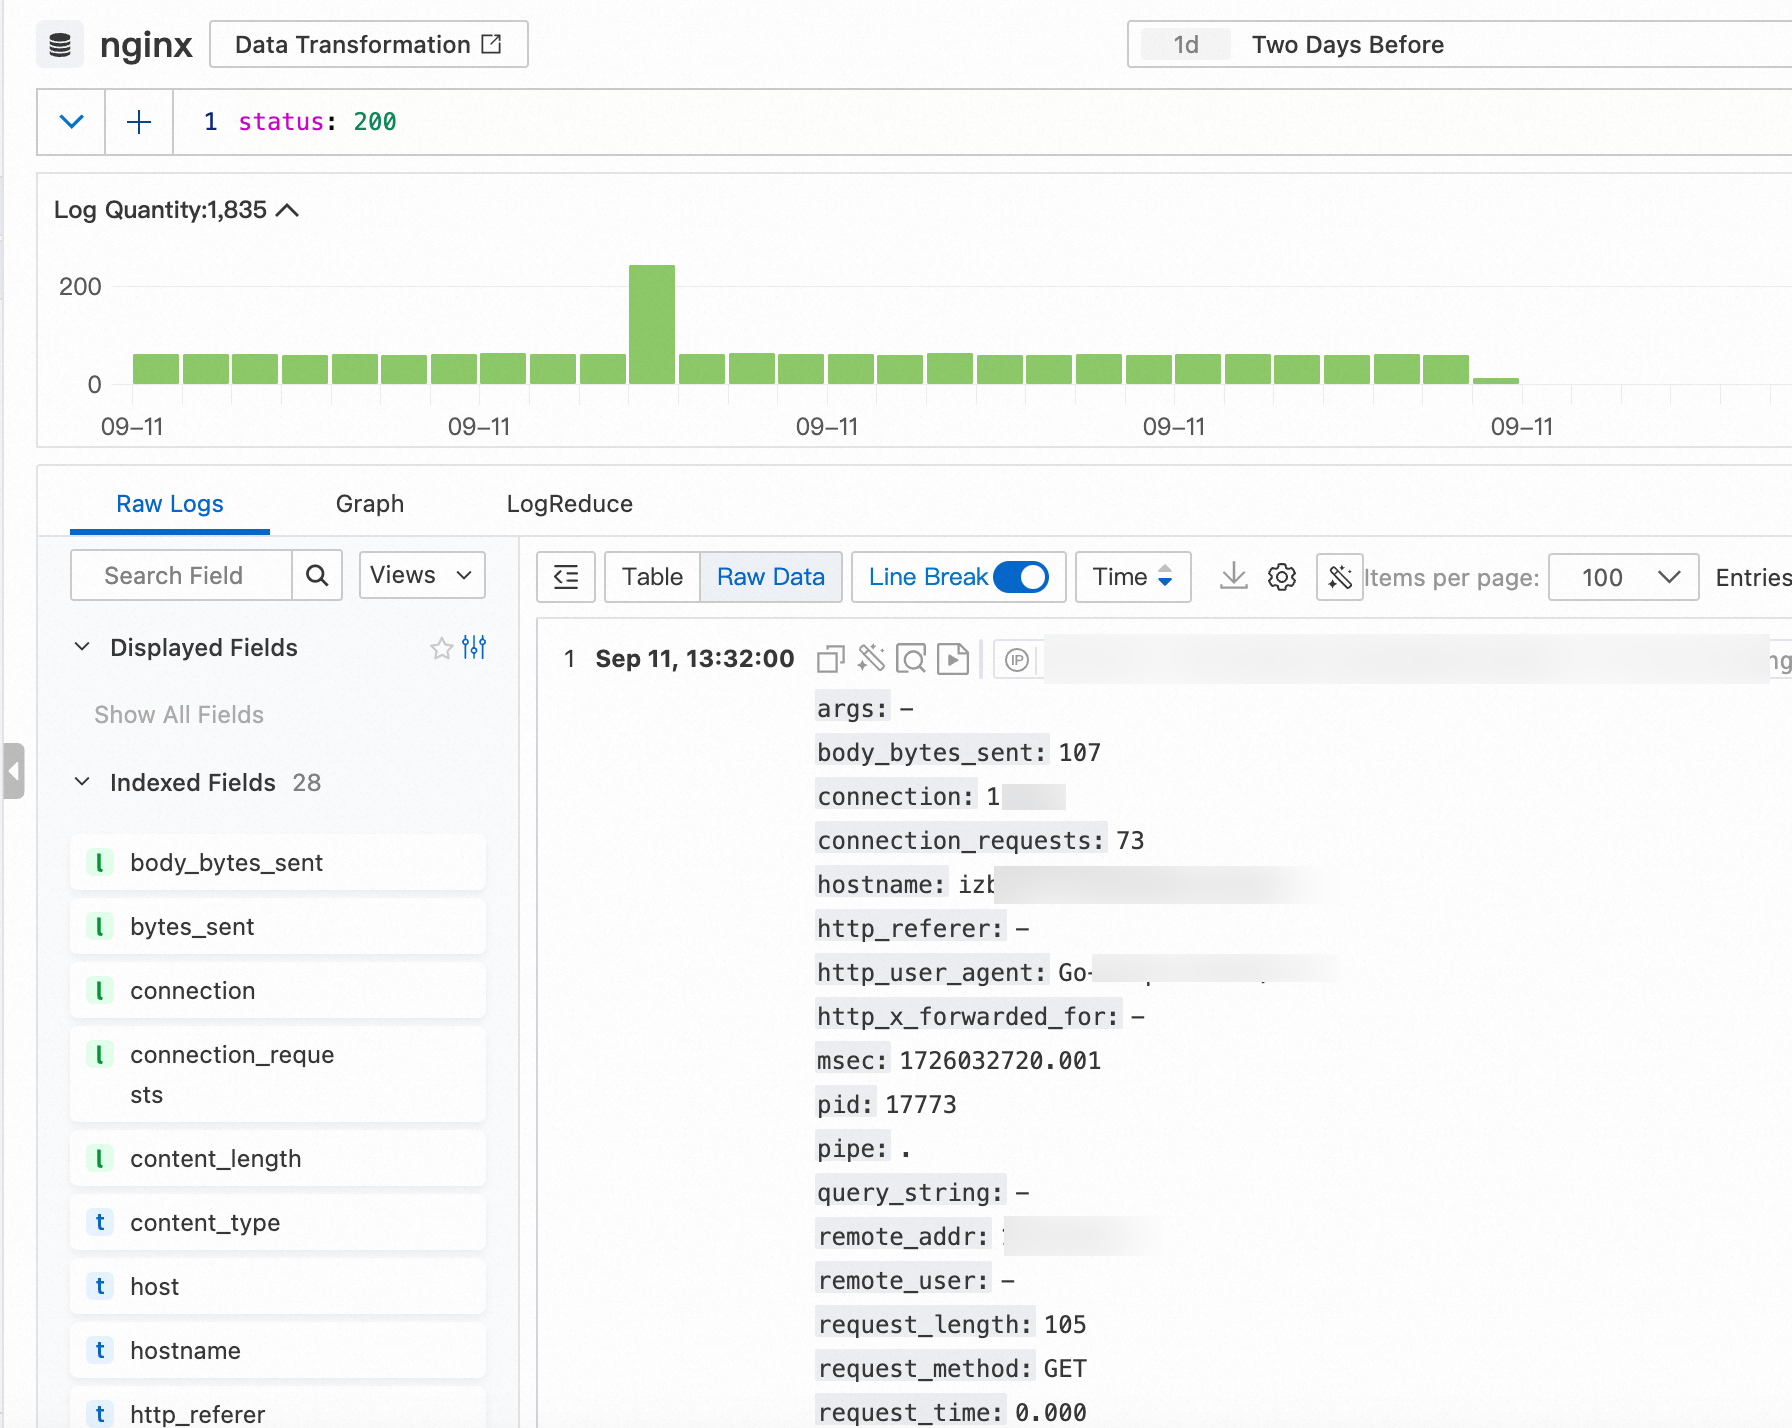
ダッシュボードの円グラフでHTTPステータスコード200に対応する部分をクリックします。 表示されるポップオーバーで、[Logstoreを開く] をクリックします。 次に、Logstoreのクエリと分析ページに移動し、ページのクエリステートメントがstatus: 200になります。 クエリ時間範囲は2日前で、ダッシュボードのクエリ時間範囲と同じです。
例1: Open Dashboardインタラクションの発生を構成する
このセクションでは、NGINXアクセスログを格納するwebsite_logという名前のLogstoreと、RequestMethodとdestination_drilldownという名前の2つのダッシュボードを使用してインタラクションの発生を設定する方法の例を示します。
RequestMethodダッシュボードにリクエストメソッドのテーブルを追加し、テーブルの相互作用の発生を設定してdestination_drilldownダッシュボードを開きます。
destination_drilldownダッシュボードに、ページビュー (PV) の経時的な傾向を表示する折れ線グラフを追加します。
設定が完了したら、RequestMethodダッシュボードでリクエストメソッドをクリックして、destination_drilldownダッシュボードにアクセスできます。 次に、destination_drilldownダッシュボードで、PVの経時的なトレンドを表示できます。 次の操作を実行して、インタラクションの発生を設定できます。
destination_drilldownダッシュボードに、PVの経時的な傾向を表示する折れ線グラフを追加します。
次のクエリ文を入力します。
${{ method | PUT}}は変数を指定します。 詳細については、「ダッシュボードへのグラフの追加」をご参照ください。request_method: ${{method|PUT}} | SELECT __time__ - __time__ %60 AS time, COUNT(1) AS PV GROUP BY time ORDER BY time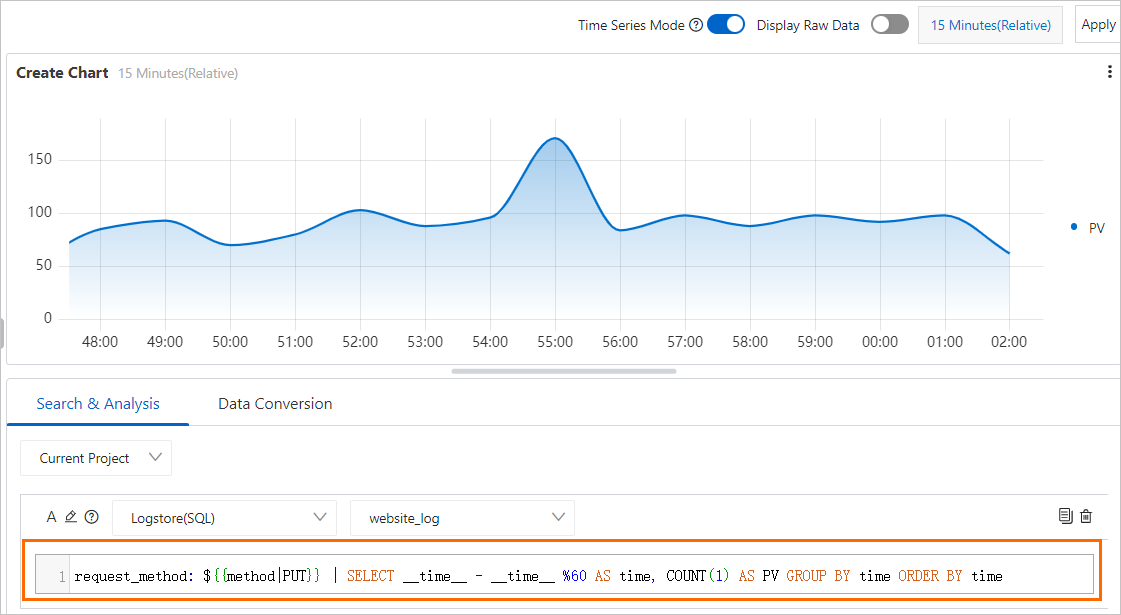
RequestMethodダッシュボードにリクエストメソッドのテーブルを追加し、テーブルのインタラクションの発生を構成します。
次の図に示すクエリ文を入力します。 詳細については、「ダッシュボードへのグラフの追加」をご参照ください。
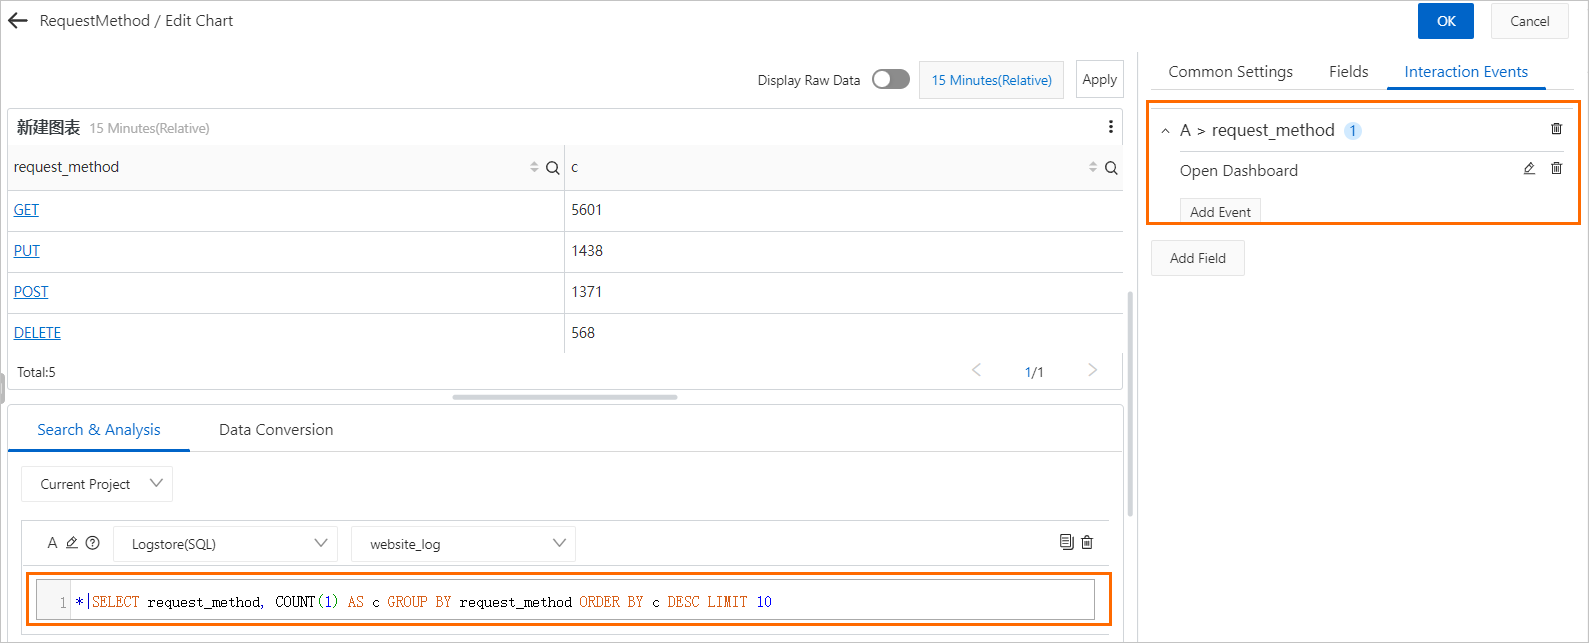
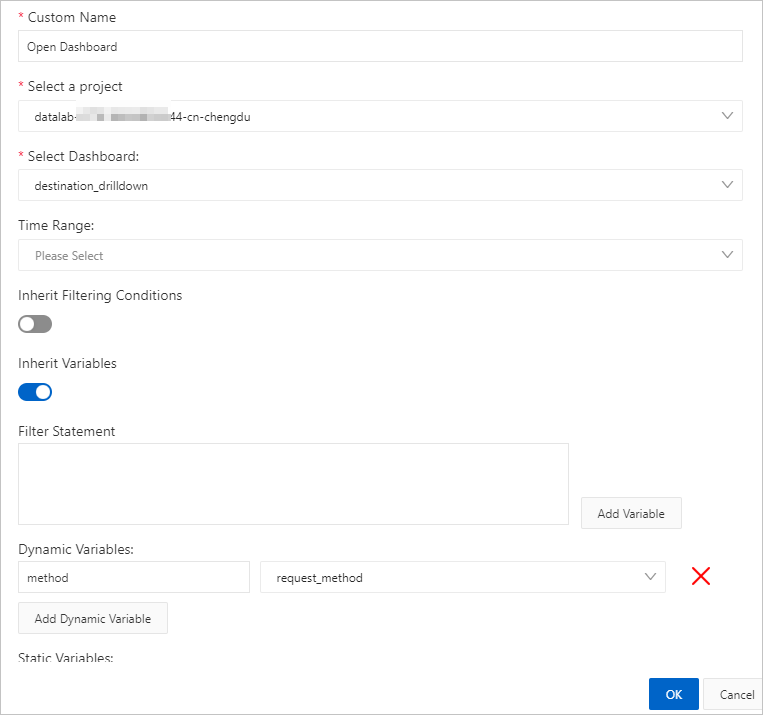
次の図に基づいて、インタラクションの発生を設定します。
Select Dashboardパラメーターをdestination_drilldownに設定します。
methodという名前の動的変数を追加し、request_method列を選択します。
インタラクションの発生を確認します。
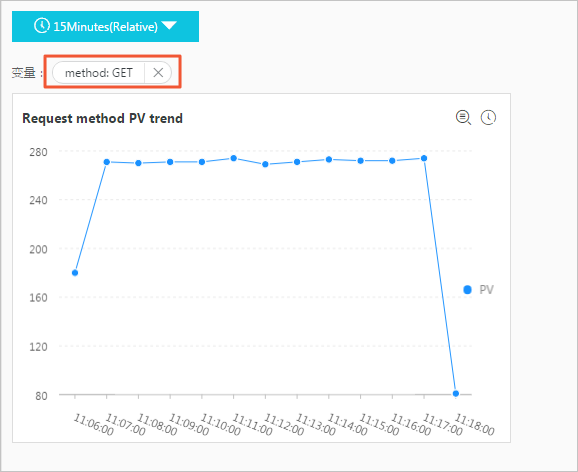
RequestMethodダッシュボードで、[GET] をクリックし、[ダッシュボードを開く] をクリックします。 destination_drilldownダッシュボードに移動します。
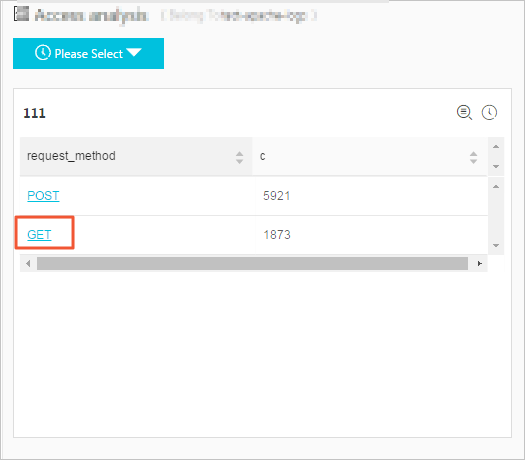
GETリクエストのPVの経時的な傾向は、折れ線グラフで表示されます。