Alibaba Cloudは、ECSインスタンスの起動、停止、有効期限、ECSインスタンスでのタスクの実行など、リソース情報を記録および通信するためのElastic Compute Service (ECS) システムイベントを提供します。 大規模なクラスターが関与し、リソースがリアルタイムでスケジュールされるシナリオでは、Cloud AssistantのECS-tool-eventプラグインを使用してecsシステムイベントを監視および対応し、トラブルシューティングや動的スケジューリングなどのO&M操作を自動化できます。
ECSシステムイベントは、O&Mタスクの実行ステータス、リソース例外、リソースステータスの変更などのリソース情報を記録および通信するためにAlibaba Cloudによって定義されています。 ECSシステムイベントのカテゴリと詳細については、「ECSシステムイベントの概要」をご参照ください。
Cloud Assistantは、簡単なコマンドを実行して複雑な設定を実行し、O&M効率を向上させるプラグインを提供します。 詳細については、「Cloud Assistantの概要」および「Cloud Assistantプラグインの使用」をご参照ください。
メカニズム
ECSコンソールで、またはECS API操作を呼び出すことで、ECSシステムイベントを監視および応答できます。 しかし、両方の方法には限界がある。
ECSコンソールでECSシステムイベントを監視または応答する場合、イベントへの応答を自動化することはできません。 手動で操作を実行する必要があります。 その結果、複数のECSインスタンスに対してECSシステムイベントが生成されると、イベントを見落とす可能性があります。
ECS APIを呼び出してECSシステムイベントを監視または応答する場合、API操作を統合するプログラムを開発する必要があります。 これには財政的および技術的サポートが必要です。
上記の問題を解決するために、Alibaba Cloudは、ecsシステムイベントをMetaServerに1分ごとに要求し、イベントをログとしてオペレーティングシステムに保存するCloud AssistantのECS-tool-eventプラグインを提供しています。 これにより、オペレーティングシステムからシステムイベントログを収集し、追加のプログラムを開発する必要なく、ログに基づいてECSシステムイベントを監視および応答できます。 たとえば、Kubernetesの自動O&M機能がある場合、host_event.logファイルからログストリームを収集して、O&Mシステムに適合させることができます。
手順
Cloud Assistant AgentがECSインスタンスにインストールされていることを確認します。 詳細については、「Cloud Assistant Agentのインストール」をご参照ください。
Cloud Assistantプラグインの開始、停止、およびステータスの確認に必要なroot権限があること。
ECSインスタンスにログインし、
ecs-tool-eventプラグインを起動します。ecs-tool-eventプラグインを起動すると、プラグインは毎分MetaServerにECSシステムイベントを要求し、イベントをログとしてECSインスタンスのオペレーティングシステムに保存します。
sudo acs-plugin-manager --exec --plugin=ecs-tool-event --params --start説明ecs-tool-eventプラグインを起動した後、
ls /var/logディレクトリに移動して、自動的に生成されるhost_event.logファイルを表示できます。ログパス: /var /Log /host_event.log
ログ形式:
% Y-% m-% d % H:% M:% S - WARNING - Ecsイベントタイプは: ${イベントタイプ} 、イベントステータスは: ${イベントステータス} 、アクションISO 8601時間は ${ISO 8601の実行時間} です。
例:
2024-01-08 17:02:01-警告-Ecsイベントタイプは: InstanceFailure.Reboot、イベントステータスは: Executed、アクションISO 8601時間は2023-12-27T11:49:28Z
ecs-tool-event部品の状態を確認してください。
sudo acs-plugin-manager --statushost_event.logファイルからログストリームを収集し、ビジネスシナリオに基づいてO&Mシステムを調整します。
例: ECSインスタンスがKubernetesクラスターのノードとして使用されている場合のECSシステムイベントへの自動応答
(オプション) ECSシステムイベントに応答しない場合は、
ecs-tool-eventプラグインを停止します。sudo acs-plugin-manager --remove --plugin ecs-tool-event
例: ECSインスタンスがKubernetesクラスターのノードとして使用されている場合のECSシステムイベントへの自動応答
シナリオ
Kubernetesクラスターのノードとして使用されているECSインスタンスのいずれかで例外が発生した場合 (ECSインスタンスの再起動、メモリ不足、オペレーティングシステムエラーなど) 、オンラインサービスの安定性に影響を与える可能性があります。 例外イベントを監視して応答し、できるだけ早い機会に例外を特定してトラブルシューティングする必要があります。 ECS-tool-eventプラグインを使用してecsシステムイベントをオペレーティングシステムログに変換し、Kubernetesコミュニティが提供するオープンソースのNode Problem Detector (NPD) 、Draino、Autoscalerを使用して、追加のプログラムを開発することなく、イベントを便利かつ効率的に監視および応答できます。 これにより、Kubernetesクラスターの安定性と信頼性を向上させることができます。
アーキテクチャ
次のワークフローでは、ecsインスタンスがKubernetesクラスターのノードとして使用されている場合に、ECS-tool-eventプラグインを使用してECSシステムイベントに自動的に応答する方法について説明します。 次の図はアーキテクチャを示しています。
Cloud Assistantのecs-tool-eventプラグインは、MetaServerにECSシステムイベントを1分ごとに要求し、オペレーティングシステムの次のパス
/var/log/host_event.logにイベントをログとして保存します。NPDはシステムイベントログを収集し、問題をAPIサーバーに報告します。
Drainoは、APIサーバーからKubernetesイベント (ECSシステムイベント) を受信し、異常なノードからポッドを削除し、ポッドを正常なノードに移行します。
異常なノードからポッドが追い出された後、ビジネスシナリオに基づいてノードを停止するか、Autoscalerを使用してノードを自動的にリリースし、新しいECSインスタンスをKubernetesクラスターのノードとして追加します。

手順
手順1: ノードでecs-tool-eventプラグインを起動する
Kubernetesクラスターのノード (ECSインスタンス) にログインし、ecs-tool-eventプラグインを起動します。
実際のシナリオでは、Kubernetesクラスター内のすべてのノードでecs-tool-eventプラグインを起動する必要があります。 Cloud Assistantを使用して、複数のECSインスタンスで次のコマンドをバッチ実行し、ecs-tool-eventプラグインを起動できます。 詳細については、「コマンドの作成と実行」をご参照ください。
sudo acs-plugin-manager --exec --plugin=ecs-tool-event --params --startecs-tool-eventプラグインを起動すると、プラグインは自動的にECSシステムイベントをログに変換し、そのログをノードのオペレーティングシステムに保存します。
手順2: KubernetesクラスターのNPDとDrainoの設定
Kubernetesクラスター内の任意のノードにログインします。
Kubernetesクラスター全体で有効になるNPDを設定します。
次のNPDファイルを設定します。
説明NPDファイルの設定方法については、NPDの公式ドキュメントをご参照ください。
node-problem-detector-config.yaml: システムログなど、NPDが監視するメトリックを定義するために使用されます。node-problem-detector.yaml: KubernetesクラスターでのNPDの動作を定義するために使用されます。rbac.yaml: KubernetesクラスターのNPDに付与される権限を定義するために使用されます。NPDが設定されていないECSインスタンスにNPDファイルを追加
上記のNPDファイルをECSインスタンスに追加します。
NPDが設定されているECSインスタンスのNPDファイルの変更
host_event.jsonファイルのログ監視設定を
node-problem-detector-config.yamlファイルに追加します。 次のサンプルコードは、ログモニタリング設定の例を示しています。... host_event.json: | { "plugin": "filelog", # Specify the plug-in that is used to collect logs. Set this parameter to filelog. "pluginConfig": { "timestamp": "^.{19}", "message": "Ecs event type is: .*", "timestampFormat": "2006-01-02 15:04:05" }, "logPath": "/var/log/host_event.log", # Specify the path in which you want to store system event logs. Set this parameter to /var/log/host_event.log. "lookback": "5m", "bufferSize": 10, "source": "host-event", "conditions": [ { "type": "HostEventRebootAfter48", # Specify an event name, which is used in the Draino configuration. "reason": "HostEventWillRebootAfter48", "message": "The Host Is Running In Good Condition" } ], "rules": [ { "type": "temporary", "reason": "HostEventRebootAfter48temporary", "pattern": "Ecs event type is: SystemMaintenance.Reboot,event status is: Scheduled.*|Ecs event type is: SystemMaintenance.Reboot,event status is: Inquiring.*" }, { "type": "permanent", "condition": "HostEventRebootAfter48", "reason": "HostEventRebootAfter48Permanent", "pattern": "Ecs event type is: SystemMaintenance.Reboot,event status is: Scheduled.*|Ecs event type is: SystemMaintenance.Reboot,event status is: Inquiring.*" } ] } ...node-problem-detector.yamlファイルを設定します。/config/host_event.json設定を- -- config.system-log-monitor行に追加して、NPDがシステムイベントログを監視できるようにします。 次のサンプルコードは、設定の例を示しています。containers: - name: node-problem-detector command: ... - --config.system-log-monitor=/config/kernel-monitor.json,/config/docker-monitor.json,/config/host_event.json次のサンプルコードに示すように、
- name: configセクションのitems:行の下に行を追加します。... - name: config configMap: name: node-problem-detector-config items: - key: kernel-monitor.json path: kernel-monitor.json - key: docker-monitor.json path: docker-monitor.json -key: host_event.json # Add this line. path: host_event.json # Add this line. ...
ファイルを有効にするには、次のコマンドを実行します。
sudo kubectl create -f rbac.yaml
sudo kubectl create -f node-problem-detector-config.yaml
sudo kubectl create -f node-problem-detector.yaml
次のコマンドを実行して、NPD設定が有効かどうかを確認します。
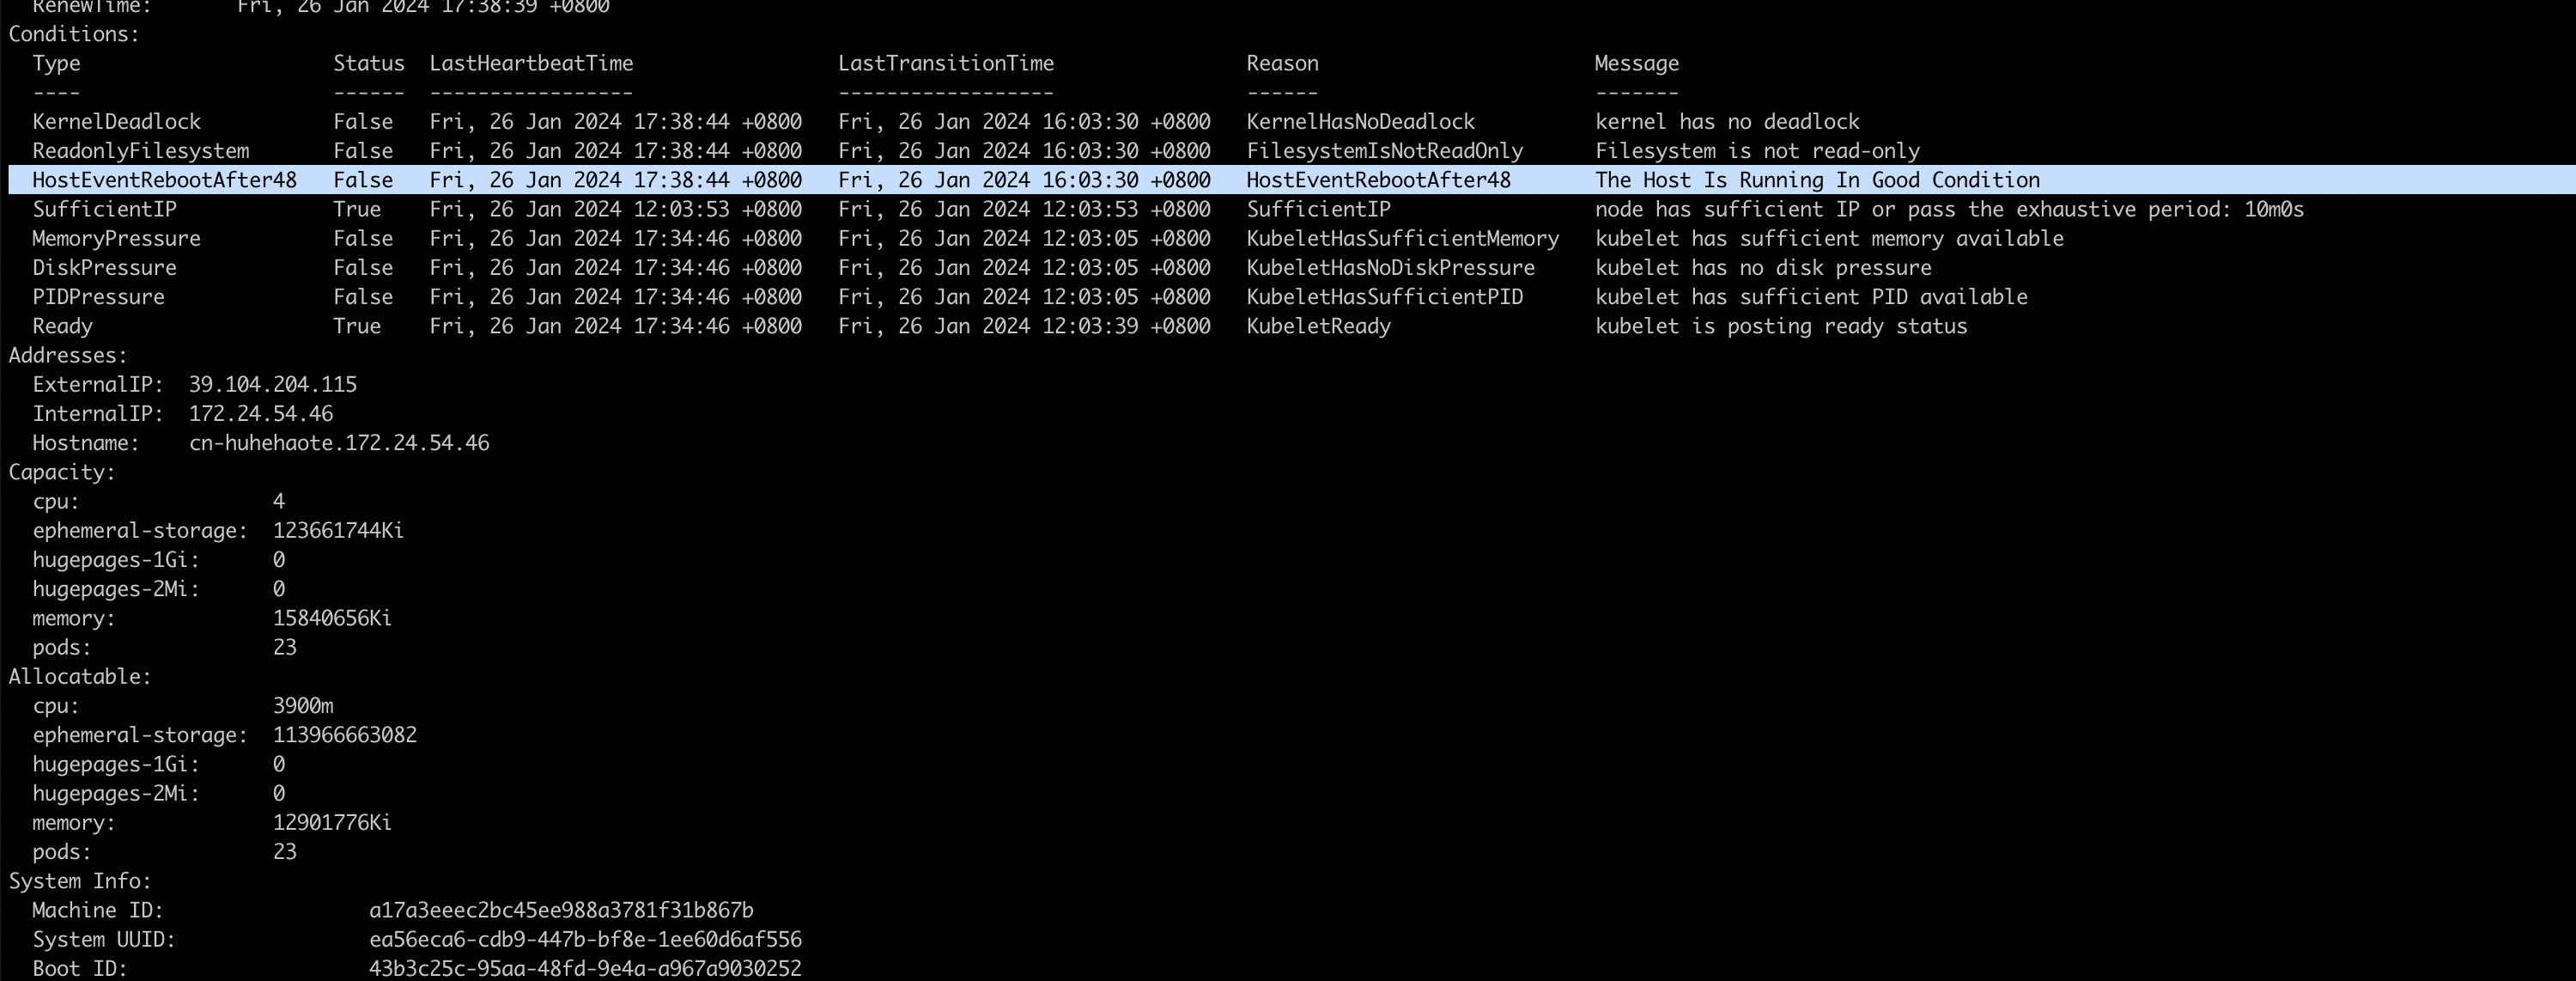
sudo kubectl describe nodes -n kube-systemHostEventRebootAfter48エントリが [Conditions] セクションに追加された次のコマンド出力が返されると、NPD設定は完了し、期待どおりに動作します。 HostEventRebootAfter48エントリが [条件] セクションに表示されない場合は、3分から5分待ちます。
Kubernetesクラスター全体で有効になるDrainoを設定します。
Drainoをインストールするか、Draino構成を変更します。
Draino構成を有効にするには、次のコマンドを実行します。
DrainoがインストールされていないECSインスタンスにDrainoをインストール
次のYAMLファイルをECSインスタンスに追加します。
DrainoがインストールされているECSインスタンスのDraino設定の変更
Draino設定ファイルを開き、
containers:セクションを見つけて、次のコードに示すように、手順2「Kubernetesクラスター全体で有効になるNPDを設定する」のnode-problem-detector-config.yamlファイルで指定したイベント名を追加します。 この例では、イベント名はHostEventRebootAfter48です。containers: - name: draino image: planetlabs/draino:dbadb44 # You'll want to change these labels and conditions to suit your deployment. command: - /draino - --debug ...... - KernelDeadlock - OutOfDisk - HostEventRebootAfter48 # Add this line.sudo kubectl create -f draino.yaml
手順3: 異常なノードを停止し、新しいノードを追加
異常なノードからポッドが追い出された後、ビジネスシナリオに基づいてノードを停止するか、Autoscalerを使用してノードを自動的にリリースし、新しいECSインスタンスをKubernetesクラスターのノードとして追加します。 Autoscalerの使用方法については、Autoscalerの公式ドキュメントをご参照ください。
結果の検証
ノードにログインし、次のコマンドを実行してECSシステムイベントのログをシミュレートします。
重要コマンドの時刻を現在のシステム時刻に置き換えます。
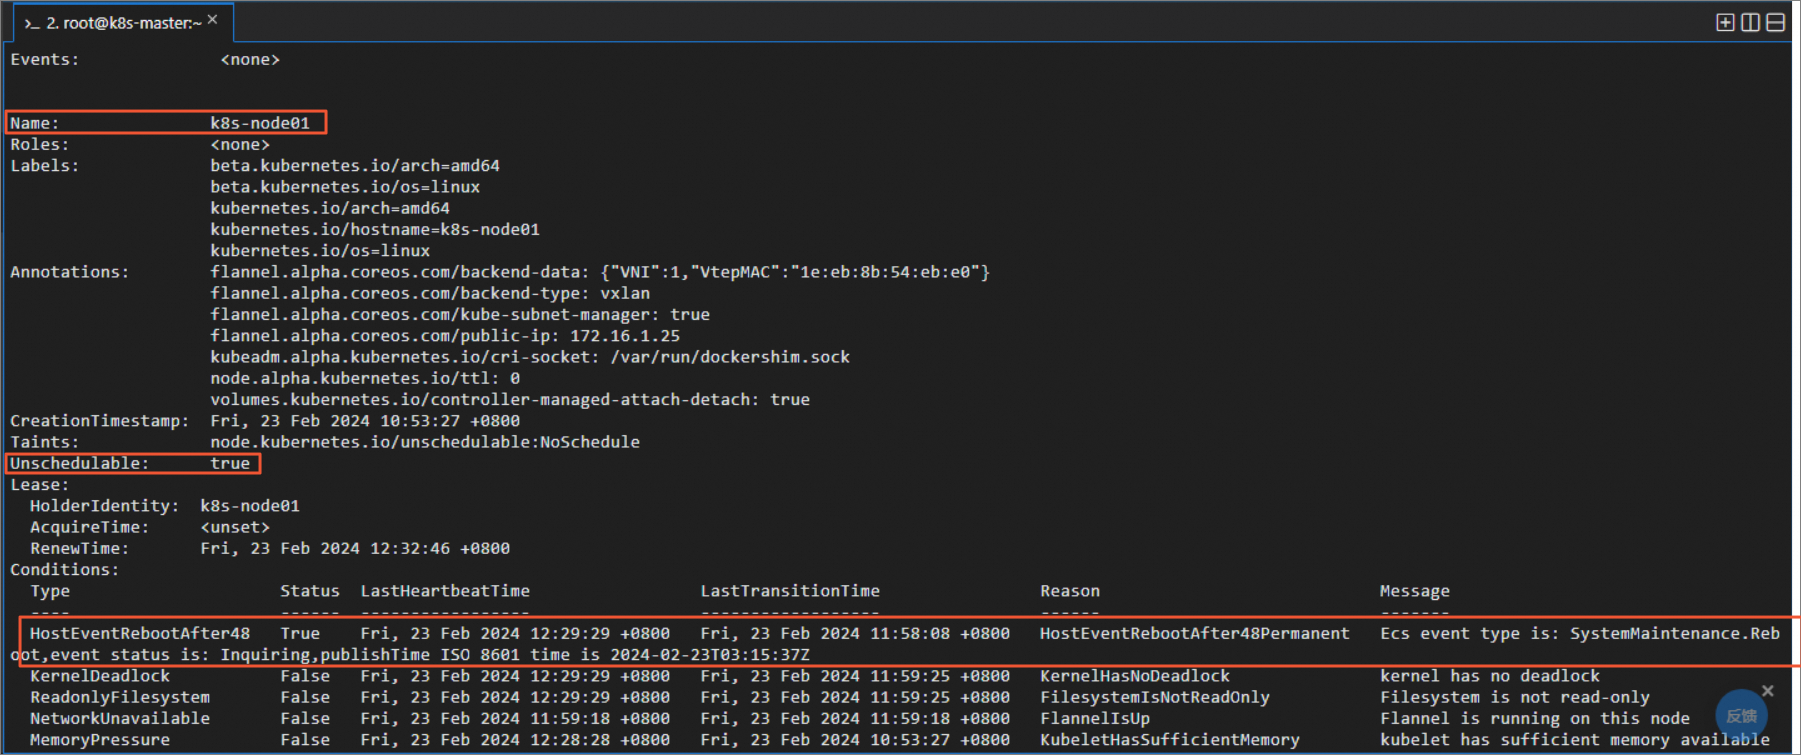
sudo echo '2024-02-23 12:29:29 - WARNING - Ecs event type is: InstanceFailure.Reboot,event status is: Executed,action ISO 8601 time is 2023-12-27T11:49:28Z' > /var/log/host_event.log次のコマンドを実行して、ノードを確認します。 次のコマンド出力は、Cloud AssistantプラグインがECSシステムイベントを検出し、イベントに基づいてKubernetesイベントを生成し、ノードのステータスをUnschedulableに設定することを示しています。
sudo kubectl describe nodes -n kube-system