データ分析は、データをダウンロードすることなく可視化・分析できる、可視化カードとレポート機能を提供します。パーソナライズされた可視化を簡単に作成し、データストーリーを伝え、データに基づいたインサイトを表現できます。
課金
可視化カードとレポートの課金については、「拡張分析の課金」をご参照ください。
制限事項
リージョン制限:この機能は、中国 (杭州)、中国 (上海)、中国 (北京)、中国 (深セン)、中国 (張家口)、中国 (成都)、中国 (ウランチャブ) でのみ利用可能です。
クォータ制限:最大 2,000 件のレポートと 10,000 枚の可視化カードを作成できます。
可視化カード
可視化カードは、SQL クエリの結果を表示します。クエリ結果を可視化カードとして保存し、さまざまなスタイルを使用してカスタムナレッジベースを構築できます。
可視化カードの作成
データ分析ページで、[データ分析へ] をクリックします。左側のナビゲーションウィンドウで、
 アイコンをクリックします。
クエリ結果エリアで、
 アイコンをクリックして、自動生成された可視化を表示します。その後、可視化に対して次の操作を実行できます。
データ詳細の表示:右上隅の
 アイコンをクリックし、[チャート/データの表示] を選択して、可視化カードとデータ詳細を切り替えます。
カードの編集:
 アイコンをクリックして、生成された可視化のデータ設定、スタイル設定、カスタムカードタイトルを構成します。
設定項目
説明
タイトルと説明の設定
カードのタイトルまたは説明にカーソルを合わせ、ダブルクリックしてタイトルをカスタマイズするか、説明を追加します。
データ設定
左側の Data Column ディレクトリで、データ列を選択またはドラッグして、対応する設定フィールドに移動します。 ソート、集約、およびグループ化の粒度を手動で設定できます。
Screening エリアで、フィルターするデータ列を選択してフィルター条件を設定します。また、各列に個別のフィルター範囲を設定することもできます。
[アノテーション] エリアで、平均値や中央値などの特別なアノテーションを追加します。
スタイル設定
ページの右側で [スタイル設定] をクリックして、スタイル設定パネルを開きます。パネルには、[グローバル設定]、[チャートの変更]、[チャートスタイル] の 3 つのタブがあります。
[グローバル設定] タブで、カードテーマを選択し、チャートテキストとチャート情報を構成します。
[チャートの変更] タブで、棒グラフ、横棒グラフ、円グラフ、折れ線グラフ、レーダーチャートなど、切り替えたいチャートタイプを選択します。
[チャートスタイル] タブで、チャートの X 軸と Y 軸の表示形式、色、スタイルを構成します。
ページの右上隅にある Save をクリックして構成を保存し、クエリ結果エリアに戻ります。
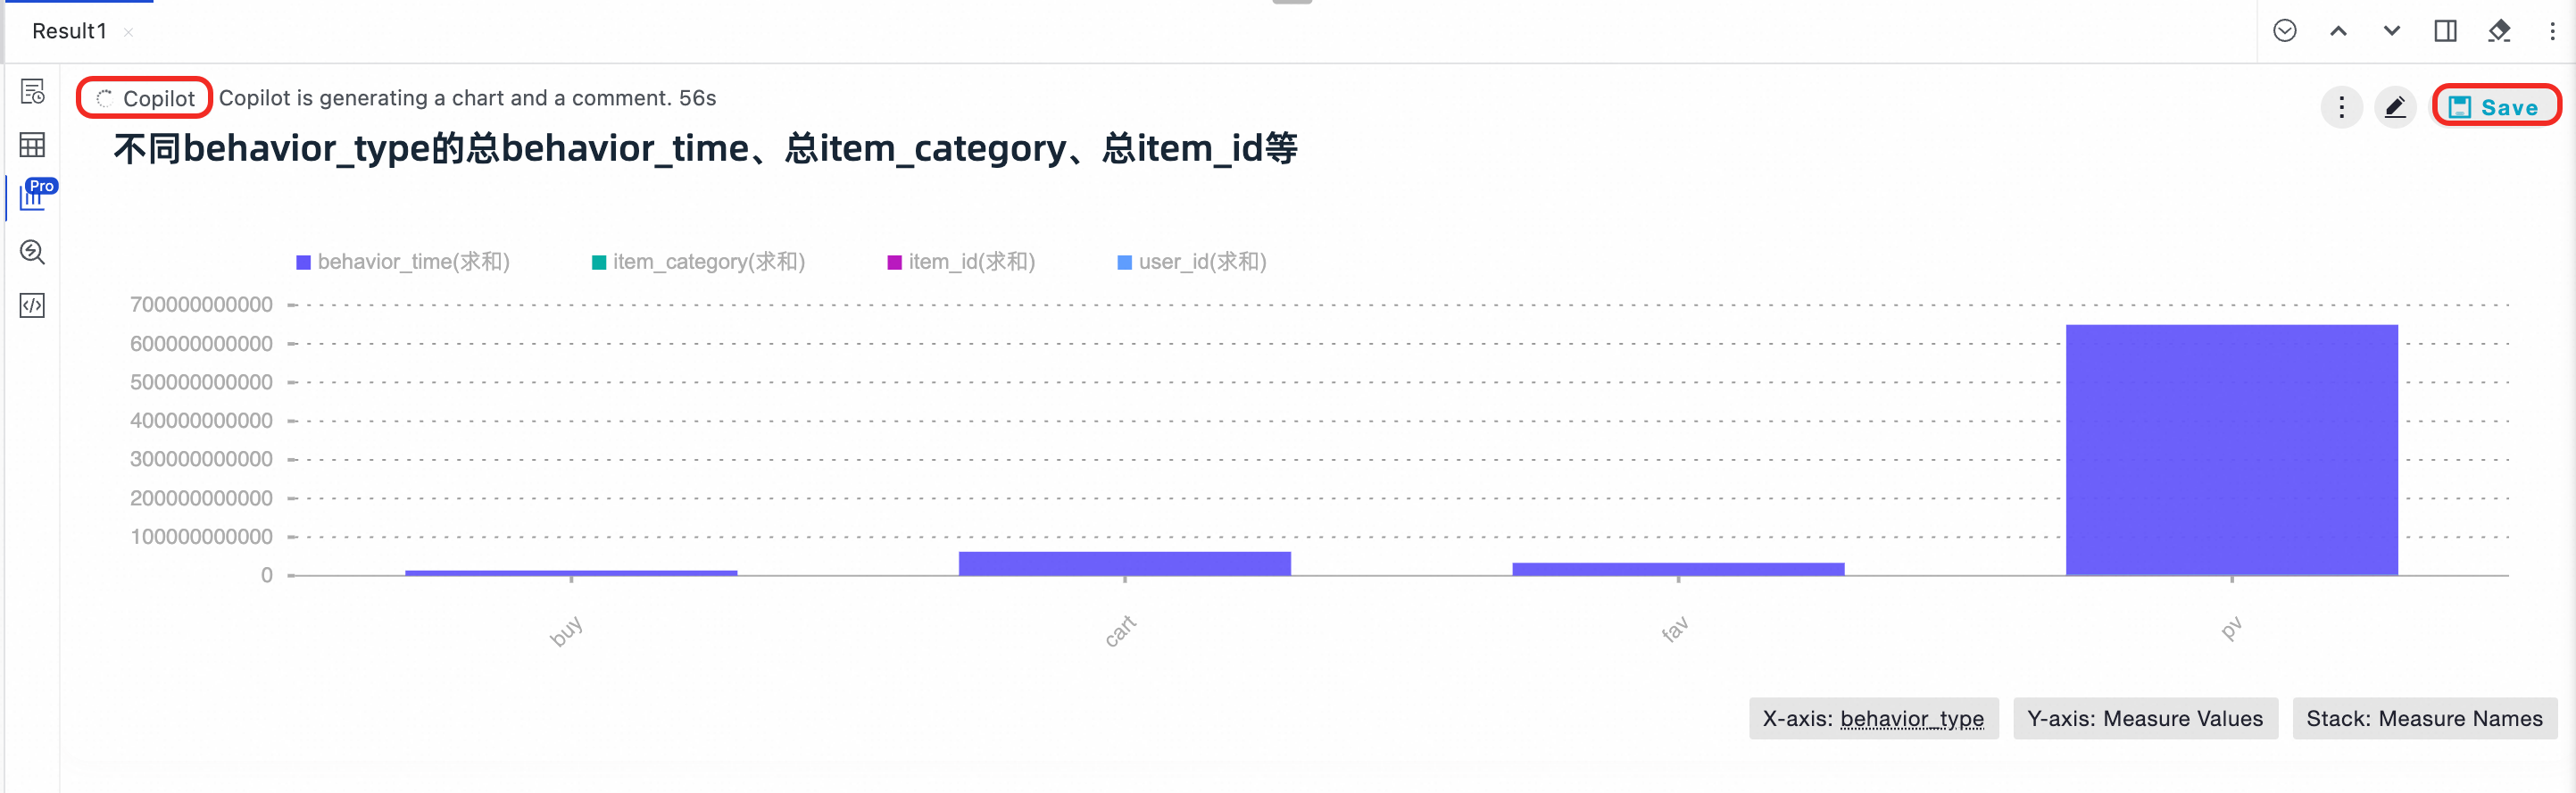
クエリ結果エリアで、右上隅にあるSaveをクリックして、可視化をカードとして保存します。
左上隅の [Copilot] ボタンをクリックして、インテリジェントにチャートを生成し、カードとして保存することもできます。
可視化カードの管理
左側のナビゲーションウィンドウで、カードの
 アイコンをクリックして、[カード] ページに移動します。
[カード] ページで、保存されているすべてのカードを表示します。
カードの右上隅にある
アイコンをクリックして、カードの編集、チャート/データの表示、データ更新設定の構成、コピー、または削除を行います。カードの右上隅にある [共有] ボタンをクリックして、リンク経由で DingTalk または WeChat にカードを共有します。パスワード保護アクセスを有効にすることもできます。デフォルトでは、パスワードは不要です。
重要権限エラーが発生した場合は、テナント管理者に連絡して に移動し、[カード] の [共有を許可] と [ダウンロードを許可] を有効にしてください。詳細については、「クエリ結果コントロール」をご参照ください。
レポート
カードライブラリから可視化カードを選択して、データレポートを迅速に作成します。複数のテーマを切り替えることができます。カードの順序を調整し、タイトルテキストを編集するだけで、パーソナライズされたレポートを作成できます。
レポートの作成
データ分析の左側のナビゲーションウィンドウで、レポートの
 アイコンをクリックしてレポートページに移動します。
右上隅で、[レポートの作成] をクリックします。表示されるダイアログで、追加するカードを選択し、OK をクリックします。
レポート作成ページで、データレポートを作成します。
順序の調整:左側の [カード順序] エリアで、カードをドラッグアンドドロップして、レポート内の表示順序を調整します。
レイアウトとテーマの調整:右側の [レポート設定] エリアで、レポートのレイアウトとテーマを構成します。
構成が完了したら、右上隅の [作成] をクリックしてレポートを作成します。
レポートの管理
作成後、[レポート] ページで作成されたすべてのレポートを表示できます。
レポートの右上隅にある
アイコンをクリックして、レポートの編集、コピー、または削除を行います。レポートの右上隅にある [共有] ボタンをクリックして、リンク経由で DingTalk または WeChat にレポートを共有します。パスワード保護アクセスを有効にすることもできます。デフォルトでは、パスワードは不要です。
重要権限エラーが発生した場合は、テナント管理者に連絡して に移動し、[レポート] の [共有を許可] と [ダウンロードを許可] を有効にしてください。詳細については、「クエリ結果コントロール」をご参照ください。