OpenTelemetry でアプリケーションをイベントトラッキングし、そのトレースデータを Cloud Monitor 2.0 に報告すると、Cloud Monitor 2.0 はアプリケーションの監視を開始します。アプリケーショントポロジー、呼び出しトレース、異常なトランザクション、遅いトランザクション、SQL 分析など、さまざまなモニタリングデータを表示できます。このトピックでは、OpenTelemetry Java Agent またはソフトウェア開発キット (SDK) を使用して、自動または手動でイベントトラッキングとデータ報告を行う方法について説明します。
背景情報
OpenTelemetry Java Agent は、多くの Java フレームワークの自動イベントトラッキングをサポートしています。完全なリストについては、「サポートされているライブラリとバージョン」をご参照ください。
ステップ 1: エンドポイント情報を取得する
Cloud Monitor 2.0 コンソールにログインし、ワークスペースを選択します。左側のナビゲーションウィンドウで、[統合センター] をクリックします。
[サーバーサイドアプリケーション] セクションで、[Java] カードをクリックします。次に、[ランタイム環境タイプ] を [手動インストール] に、[プロトコルタイプ] を [Opentelemetry] に設定します。
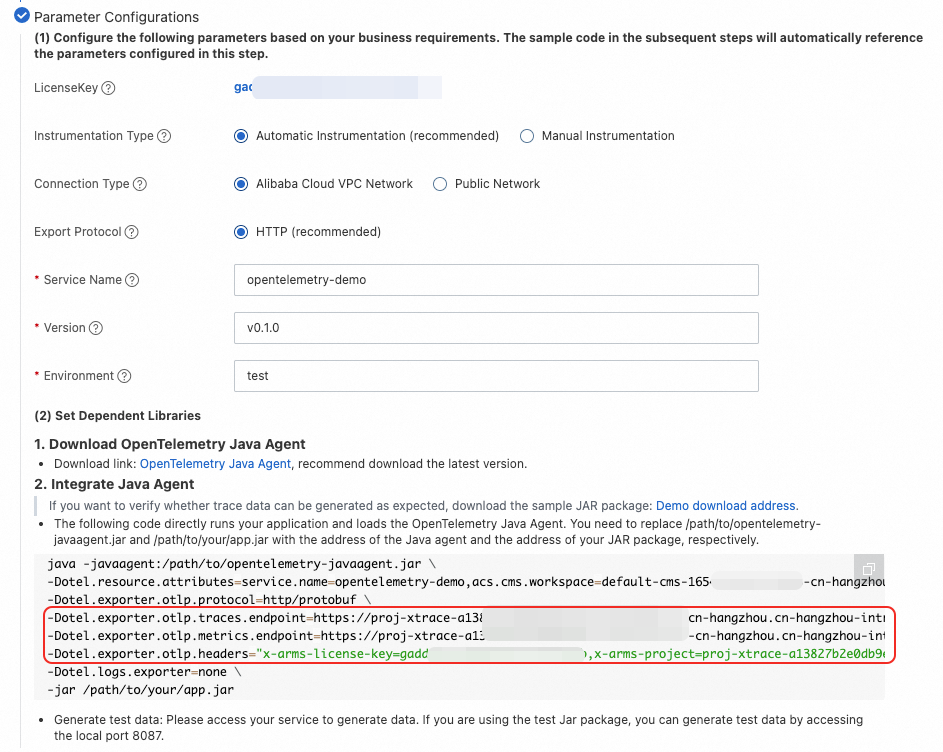
[パラメーター構成] セクションで、[LicenseKey] の横にある [取得] をクリックします。次に、必要に応じて [イベントトラッキング方法]、[接続方法]、[報告方法] を選択します。[アプリケーション名]、[バージョン番号]、[デプロイメント環境] を入力します。
構成されたパラメーターに基づいて、対応する統合コードがページの下部に生成されます。コードには、Endpoint や LicenseKey などのエンドポイント情報が含まれています。
ステップ 2: 依存関係ライブラリをセットアップする
自動イベントトラッキング (推奨)
OpenTelemetry Java Agent は、非侵入型の統合方法を提供します。数百の Java フレームワークの自動トレースデータ報告をサポートしています。サポートされている Java フレームワークの完全なリストについては、「サポートされているライブラリとバージョン」をご参照ください。
Java Agent をダウンロードします。最新バージョンを推奨します。
Java 起動の VM パラメーターを変更して、トレースデータを報告します。
次のコードは、アプリケーションを実行し、OpenTelemetry Java Agent をロードします。次のコードのプレースホルダーを、ステップ 1 で取得したエンドポイント情報に置き換えます。
/path/to/opentelemetry-javaagent.jarと/path/to/your/app.jarを、Java Agent と JAR パッケージへの実際のパスに置き換えます。java -javaagent:/path/to/opentelemetry-javaagent.jar \ -Dotel.resource.attributes=service.name=<service name>,acs.cms.workspace=<workspace>,service.version=<service version>,deployment.environment=<environment> \ -Dotel.exporter.otlp.protocol=http/protobuf \ -Dotel.exporter.otlp.traces.endpoint=<traces.endpoint> \ -Dotel.exporter.otlp.metrics.endpoint=<metrics.endpoint> \ -Dotel.exporter.otlp.headers="x-arms-license-key=<license-key>,x-arms-project=<arms-project>,x-cms-workspace=<workspace>" \ -Dotel.logs.exporter=none \ -jar /path/to/your/app.jar説明テストデータを生成するには、サービスにアクセスします。テスト JAR パッケージを使用している場合は、ローカルマシンのポート 8087 にアクセスしてテストデータを生成できます。
プログラムを実行して、トレースデータを生成および報告します。
手動イベントトラッキング
OpenTelemetry Java SDK は OpenTelemetry Java Agent の基盤であり、広範なカスタマイズ機能を提供します。OpenTelemetry Java Agent が提供する自動イベントトラッキングがニーズを満たさない場合、またはカスタムビジネスイベントトラッキングを追加したい場合は、この方法を使用します。
Maven POM の依存関係をインポートします。
<dependencies>
    <dependency>
        <groupId>io.opentelemetry</groupId>
        <artifactId>opentelemetry-api</artifactId>
    </dependency>
    <dependency>
        <groupId>io.opentelemetry</groupId>
        <artifactId>opentelemetry-sdk-trace</artifactId>
    </dependency>
    <dependency>
        <groupId>io.opentelemetry</groupId>
        <artifactId>opentelemetry-exporter-otlp</artifactId>
    </dependency>
    <dependency>
        <groupId>io.opentelemetry</groupId>
        <artifactId>opentelemetry-sdk</artifactId>
    </dependency>
    <dependency>
        <groupId>io.opentelemetry</groupId>
        <artifactId>opentelemetry-semconv</artifactId>
        <version>1.30.0-alpha</version>
    </dependency>
</dependencies>

<dependencyManagement>
<dependencies>
    <dependency>
        <groupId>io.opentelemetry</groupId>
        <artifactId>opentelemetry-bom</artifactId>
        <version>1.30.0</version>
        <type>pom</type>
        <scope>import</scope>
    </dependency>
</dependencies>
</dependencyManagement>
OpenTelemetry Tracer を取得します。
import io.opentelemetry.api.OpenTelemetry;
import io.opentelemetry.api.common.Attributes;
import io.opentelemetry.api.trace.Tracer;
import io.opentelemetry.api.trace.propagation.W3CTraceContextPropagator;
import io.opentelemetry.context.propagation.ContextPropagators;
import io.opentelemetry.exporter.otlp.http.trace.OtlpHttpSpanExporter;
import io.opentelemetry.sdk.OpenTelemetrySdk;
import io.opentelemetry.sdk.resources.Resource;
import io.opentelemetry.sdk.trace.SdkTracerProvider;
import io.opentelemetry.sdk.trace.export.BatchSpanProcessor;
import io.opentelemetry.semconv.resource.attributes.ResourceAttributes;

public class OpenTelemetrySupport {

    static {
        // OpenTelemetry Tracer を取得します。
        Resource resource = Resource.getDefault()
                .merge(Resource.create(Attributes.of(
                        ResourceAttributes.SERVICE_NAME, "<service name>",  // アプリケーション名。
                        ResourceAttributes.SERVICE_VERSION, "<service version>",  // バージョン番号。
                        ResourceAttributes.DEPLOYMENT_ENVIRONMENT, "<environment>", // デプロイメント環境。
                        ResourceAttributes.HOST_NAME, "${host-name}", // ${host-name} をホスト名に置き換えます。
                        AttributeKey.stringKey("acs.cms.workspace"), "<workspace>"  // <workspace> をワークスペース名に置き換えます。
                )));

        SdkTracerProvider sdkTracerProvider = SdkTracerProvider.builder()
                .addSpanProcessor(BatchSpanProcessor.builder(OtlpHttpSpanExporter.builder()
                        .setEndpoint("<endpoint>")  // <endpoint> をステップ 1 で取得したエンドポイント情報に置き換えます。
                        .addHeader("x-arms-license-key", "<license-key>")  // <license-key> をステップ 1 で取得した情報に置き換えます。
                        .addHeader("x-arms-project", "<arms-project>")  // <arms-project> をステップ 1 で取得した情報に置き換えます。
                        .addHeader("x-cms-workspace", "<workspace>") // <workspace> をワークスペース名に置き換えます。
                        .build()).build())
                .setResource(resource)
                .build();

        OpenTelemetry openTelemetry = OpenTelemetrySdk.builder()
                .setTracerProvider(sdkTracerProvider)
                .setPropagators(ContextPropagators.create(W3CTraceContextPropagator.getInstance()))
                .buildAndRegisterGlobal();

        tracer = openTelemetry.getTracer("OpenTelemetry Tracer", "1.0.0");
    }

    private static Tracer tracer;

    public static Tracer getTracer() {
        return tracer;
    }
}
Span を作成します。
import io.opentelemetry.api.trace.Span;
import io.opentelemetry.api.trace.StatusCode;
import io.opentelemetry.context.Scope;

public class Main {

    public static void parentMethod() {
        Span span = OpenTelemetrySupport.getTracer().spanBuilder("parent span").startSpan();
        try (Scope scope = span.makeCurrent()) {
            span.setAttribute("good", "job");
            childMethod();
        } catch (Throwable t) {
            span.setStatus(StatusCode.ERROR, "handle parent span error");
        } finally {
            span.end();
        }
    }

    public static void childMethod() {
        Span span = OpenTelemetrySupport.getTracer().spanBuilder("child span").startSpan();
        try (Scope scope = span.makeCurrent()) {
            span.setAttribute("hello", "world");
        } catch (Throwable t) {
            span.setStatus(StatusCode.ERROR, "handle child span error");
        } finally {
            span.end();
        }
    }

    public static void main(String[] args) {
        parentMethod();
    }
}
プログラムを実行して、トレースデータを生成および報告します。
自動および手動イベントトラッキング
Java Agent を使用して自動イベントトラッキングを行い、同時に Java SDK を使用してカスタムビジネスイベントトラッキングを追加できます。
Java Agent をダウンロードします。最新バージョンを推奨します。
手動イベントトラッキング の Maven 依存関係に次の依存関係を追加します。
<dependency> <groupId>io.opentelemetry</groupId> <artifactId>opentelemetry-extension-annotations</artifactId> </dependency> <dependency> <groupId>io.opentelemetry</groupId> <artifactId>opentelemetry-sdk-extension-autoconfigure</artifactId> <version>1.23.0-alpha</version> </dependency>説明opentelemetry-sdk-extension-autoconfigure依存関係は、SDK を自動的に構成し、Java Agent の構成を Java SDK に渡します。OpenTelemetry Tracer を取得します。
Java Agent と Java SDK の両方を使用してイベントトラッキングを行う場合、手動イベントトラッキング セクションの OpenTelemetrySupport クラスを使用して Tracer を取得する必要はありません。
OpenTelemetry openTelemetry = GlobalOpenTelemetry.get();
Tracer tracer = openTelemetry.getTracer("instrumentation-library-name", "1.0.0");
次のように Controller と Service のコードを変更します。
以下は Controller のコードです。コードに示されている最初の方法と 2 番目の方法が推奨されます。
package com.alibaba.arms.brightroar.console.controller;

import com.alibaba.arms.brightroar.console.service.UserService;
import io.opentelemetry.api.GlobalOpenTelemetry;
import io.opentelemetry.api.OpenTelemetry;
import io.opentelemetry.api.trace.Span;
import io.opentelemetry.api.trace.StatusCode;
import io.opentelemetry.api.trace.Tracer;
import io.opentelemetry.context.Context;
import io.opentelemetry.context.Scope;
import io.opentelemetry.extension.annotations.SpanAttribute;
import io.opentelemetry.extension.annotations.WithSpan;
import org.springframework.beans.factory.annotation.Autowired;
import org.springframework.web.bind.annotation.RequestMapping;
import org.springframework.web.bind.annotation.RestController;

import java.util.concurrent.ExecutorService;
import java.util.concurrent.Executors;

/**
* リファレンス:
* 1. https://opentelemetry.io/docs/java/manual_instrumentation/
*/
@RestController
    @RequestMapping("/user")
    public class UserController {

        @Autowired
        private UserService userService;

        private ExecutorService es = Executors.newFixedThreadPool(5);

        // 方法 1: API を使用して手動で情報を追加した自動イベントトラッキング。
        @RequestMapping("/async")
        public String async() {
            System.out.println("UserController.async -- " + Thread.currentThread().getId());
            Span span = Span.current();
            span.setAttribute("user.id", "123456");
            userService.async();
            child("vip");
            return "async";
        }

        // 方法 2: アノテーションを使用してイベントトラッキングを作成する。
        @WithSpan
        private void child(@SpanAttribute("user.type") String userType) {
            System.out.println(userType);
            biz();
        }

        // 方法 3: 純粋な手動イベントトラッキングのために Tracer を取得する。
        private void biz() {
            Tracer tracer = GlobalOpenTelemetry.get().getTracer("tracer");
            Span span = tracer.spanBuilder("biz (manual)")
                .setParent(Context.current().with(Span.current())) // オプション。自動的に設定されます。
                .startSpan();

            try (Scope scope = span.makeCurrent()) {
                span.setAttribute("biz-id", "111");

                es.submit(new Runnable() {
                    @Override
                    public void run() {
                        Span asyncSpan = tracer.spanBuilder("async")
                            .setParent(Context.current().with(span))
                            .startSpan();
                        try {
                            Thread.sleep(1000L); // いくつかの非同期ジョブ
                        } catch (Throwable e) {
                        }
                        asyncSpan.end();
                    }
                });

                Thread.sleep(1000); // 偽のビジネスロジック
                System.out.println("biz done");
                OpenTelemetry openTelemetry = GlobalOpenTelemetry.get();
                openTelemetry.getPropagators();
            } catch (Throwable t) {
                span.setStatus(StatusCode.ERROR, "handle biz error");
            } finally {
                span.end();
            }
        }

    }
Service コード:
package com.alibaba.arms.brightroar.console.service;

import org.springframework.scheduling.annotation.Async;
import org.springframework.stereotype.Service;

@Service
public class UserService {

    @Async
    public void async() {
        System.out.println("UserService.async -- " + Thread.currentThread().getId());
        System.out.println("my name is async");
        System.out.println("UserService.async -- ");
    }
}
Java 起動の VM パラメーターを変更して、トレースデータを報告します。
次のコードのプレースホルダーを、ステップ 1 で取得したエンドポイント情報に置き換えます。
/path/to/opentelemetry-javaagent.jarと/path/to/your/app.jarを、Java Agent と JAR パッケージへの実際のパスに置き換えます。java -javaagent:/path/to/opentelemetry-javaagent.jar \ -Dotel.resource.attributes=service.name=<service name>,acs.cms.workspace=<workspace>,service.version=<service version>,deployment.environment=<environment> \ -Dotel.exporter.otlp.protocol=http/protobuf \ -Dotel.exporter.otlp.traces.endpoint=<traces.endpoint> \ -Dotel.exporter.otlp.metrics.endpoint=<metrics.endpoint> \ -Dotel.exporter.otlp.headers="x-arms-license-key=<license-key>,x-arms-project=<arms-project>,x-cms-workspace=<workspace>" \ -Dotel.logs.exporter=none \ -jar /path/to/your/app.jarプログラムを実行して、トレースデータを生成および報告します。
モニタリングデータを表示する
Cloud Monitor 2.0 コンソールにログインし、ワークスペースを選択します。左側のナビゲーションウィンドウで、 を選択します。
[アプリケーションリスト] ページで、アプリケーションの名前をクリックして、その監視詳細を表示します。詳細については、「アプリケーション監視」をご参照ください。