All Products
Search
Document Center

Alibaba Cloud Service Mesh:Gunakan ConcurrencySchedulingPolicy untuk menerapkan penjadwalan permintaan berdasarkan prioritas di bawah kontrol konkurensi

Last Updated:Jul 02, 2025

Topik ini menjelaskan cara menggunakan ConcurrencySchedulingPolicy yang disediakan oleh suite penjadwalan lalu lintas untuk menerapkan penjadwalan permintaan berdasarkan prioritas di bawah kontrol konkurensi.

Informasi latar belakang

ConcurrencySchedulingPolicy menentukan apakah lalu lintas kelebihan beban berdasarkan batasan pada permintaan konkuren. Ketika jumlah permintaan konkuren melebihi batas atas yang ditentukan, permintaan berikutnya akan dimasukkan ke dalam antrian dan dijadwalkan berdasarkan prioritas mereka. ConcurrencySchedulingPolicy bekerja dengan cara berikut:

  • ConcurrencySchedulingPolicy menggunakan pembatas konkurensi untuk mencatat jumlah permintaan konkuren yang sedang diproses dan menentukan apakah jumlah tersebut mencapai batas atas.

  • Ketika jumlah permintaan konkuren mencapai batas atas, permintaan berikutnya dimasukkan ke dalam antrian dan dikirim ke layanan tujuan setelah permintaan sebelumnya diproses. Ini memastikan bahwa sejumlah tertentu permintaan konkuren dipertahankan. Selain itu, permintaan dengan prioritas tinggi memiliki peluang lebih besar untuk dikeluarkan dari antrian dan dikirim ke layanan tujuan.

Ketika jumlah permintaan konkuren melebihi batas atas permintaan yang dapat diproses oleh sistem, ConcurrencySchedulingPolicy tidak langsung menolak permintaan tetapi memasukkannya ke dalam antrian prioritas. Ini berbeda dari ConcurrencyLimitingPolicy yang menolak permintaan ketika ambang batas yang ditentukan tercapai. ConcurrencySchedulingPolicy menjadwalkan permintaan berdasarkan prioritas mereka sambil memastikan bahwa jumlah permintaan konkuren berada dalam batas atas.

Prasyarat

Langkah 1: Buat ConcurrencySchedulingPolicy

  1. Gunakan kubectl untuk terhubung ke instance ASM Anda. Untuk informasi lebih lanjut, lihat Gunakan kubectl di bidang kontrol untuk mengakses sumber daya Istio.

  2. Buat file concurrencyschedulingpolicy.yaml yang berisi konten berikut:

    apiVersion: istio.alibabacloud.com/v1
    kind: ConcurrencySchedulingPolicy
    metadata:
      name: concurrencyscheduling
      namespace: istio-system
    spec:
      concurrency_scheduler:
        max_concurrency: 10
        concurrency_limiter:
          max_inflight_duration: 60s
        scheduler:
          workloads:
            - label_matcher:
                match_labels:
                  http.request.header.user_type: guest
              parameters:
                priority: 50.0
              name: guest
            - label_matcher:
                match_labels:
                  http.request.header.user_type: subscriber
              parameters:
                priority: 200.0
              name: subscriber
        selectors:
        - service: httpbin.default.svc.cluster.local

    Tabel berikut menjelaskan beberapa parameter. Untuk informasi lebih lanjut tentang item konfigurasi, lihat Deskripsi bidang ConcurrencySchedulingPolicy.

    Bidang

    Deskripsi

    max_concurrency

    Jumlah maksimum permintaan konkuren. Dalam contoh ini, bidang ini diatur ke 10, yang menunjukkan bahwa layanan diizinkan memproses 10 permintaan pada satu waktu.

    max_inflight_duration

    Periode timeout untuk pemrosesan permintaan. Karena kejadian tak terduga seperti restart pod di kluster, suite penjadwalan lalu lintas ASM mungkin gagal mencatat peristiwa terminasi permintaan. Untuk mencegah permintaan tersebut memengaruhi penilaian algoritma pembatasan konkurensi, Anda perlu menentukan periode timeout untuk pemrosesan permintaan. Jika permintaan belum direspons sebelum periode timeout ini, sistem menganggap bahwa permintaan tersebut telah diproses. Anda dapat mengatur bidang ini dengan mengevaluasi waktu respons maksimum yang diharapkan dari sebuah permintaan. Dalam contoh ini, bidang ini diatur ke 60s.

    workloads

    Dua jenis permintaan didefinisikan berdasarkan user_type di header permintaan: guest dan subscriber. Prioritas permintaan tipe guest adalah 50, dan prioritas permintaan tipe subscriber adalah 200.

    selectors

    Layanan tempat kebijakan throttling diterapkan. Dalam contoh ini, service: httpbin.default.svc.cluster.local digunakan, yang menunjukkan bahwa kebijakan pembatasan konkurensi diterapkan ke layanan httpbin.default.svc.cluster.local.

  3. Jalankan perintah berikut untuk membuat ConcurrencySchedulingPolicy:

    kubectl apply -f concurrencyschedulingpoilcy.yaml

Langkah 2: Verifikasi hasil penjadwalan permintaan berdasarkan prioritas dalam skenario di mana permintaan konkuren dikendalikan

Dalam contoh ini, alat uji stres Fortio digunakan. Untuk informasi lebih lanjut, lihat bagian Instalasi Fortio di situs web GitHub.

  1. Buka dua terminal dan jalankan dua perintah uji stres berikut secara bersamaan untuk memulai pengujian. Selama pengujian keseluruhan, pastikan kedua terminal bekerja sesuai harapan. Dalam pengujian pada dua terminal, 10 permintaan konkuren dikirim ke layanan dan laju permintaan per detik (QPS) adalah 10.000, yang secara signifikan melebihi permintaan konkuren yang dapat ditangani layanan.

    fortio load -c 10 -qps 10000  -H "user_type:guest" -t 30s -timeout 60s -a http://${IP address of the ASM ingress gateway}/status/201
    fortio load -c 10 -qps 10000  -H "user_type:subscriber" -t 30s -timeout 60s -a http://${IP address of the ASM ingress gateway}/status/202
    Catatan

    Ganti ${IP address of the ASM gateway} dalam perintah di atas dengan alamat IP gateway ingress ASM Anda. Untuk informasi lebih lanjut tentang cara mendapatkan alamat IP gateway ingress ASM, lihat sublangkah 1 dari Langkah 3 dalam topik Gunakan sumber daya Istio untuk merutekan lalu lintas ke versi layanan yang berbeda.

    Output yang diharapkan dari tes 1:

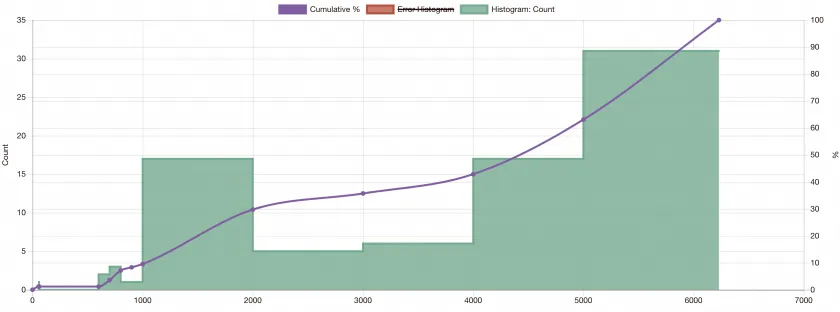
    ...
    # target 50% 4.35294
    # target 75% 5.39689
    # target 90% 5.89697
    # target 99% 6.19701
    # target 99.9% 6.22702
    Sockets used: 10 (for perfect keepalive, would be 10)
    Uniform: false, Jitter: false
    Code 201 : 84 (100.0 %)
    Response Header Sizes : count 84 avg 249.88095 +/- 0.3587 min 248 max 250 sum 20990
    Response Body/Total Sizes : count 84 avg 249.88095 +/- 0.3587 min 248 max 250 sum 20990
    All done 84 calls (plus 10 warmup) 3802.559 ms avg, 2.6 qps
    Successfully wrote 5186 bytes of Json data to xxxxxx.json

    Catat nama file JSON yang dihasilkan oleh tes 1, misalnya, xxxxxx.json.

    Output yang diharapkan dari tes 2:

    ...
    # target 50% 1.18121
    # target 75% 1.63423
    # target 90% 1.90604
    # target 99% 2.22941
    # target 99.9% 2.28353
    Sockets used: 10 (for perfect keepalive, would be 10)
    Uniform: false, Jitter: false
    Code 202 : 270 (100.0 %)
    Response Header Sizes : count 270 avg 250.52963 +/- 0.5418 min 249 max 251 sum 67643
    Response Body/Total Sizes : count 270 avg 250.52963 +/- 0.5418 min 249 max 251 sum 67643
    All done 270 calls (plus 10 warmup) 1117.614 ms avg, 8.8 qps
    Successfully wrote 5305 bytes of Json data to yyyyyy.json

    Catat nama file JSON yang dihasilkan oleh tes 2, misalnya, yyyyyy.json.

    Output di atas menunjukkan bahwa latensi permintaan rata-rata tes 2 sekitar 1/4 kali dari tes 1, dan QPS sekitar empat kali lipat dari tes 1. Hal ini karena dalam kebijakan yang didefinisikan sebelumnya, prioritas permintaan tipe subscriber adalah empat kali lipat dari permintaan tipe guest.

  2. (Opsional) Lihat hasil dalam cara visual.

    1. Jalankan perintah berikut di direktori lokal tempat dua perintah dijalankan pada langkah sebelumnya untuk membuka server Fortio lokal:

      fortio server
    2. Gunakan browser untuk mengakses http://localhost:8080/fortio/browse, dan klik nama file JSON yang sesuai yang Anda catat di sublangkah 1 untuk melihat hasil tes dalam bentuk visual.

      Contoh hasil visual untuk tes 1:

      image

      Contoh hasil visualisasi untuk tes 2:

      image

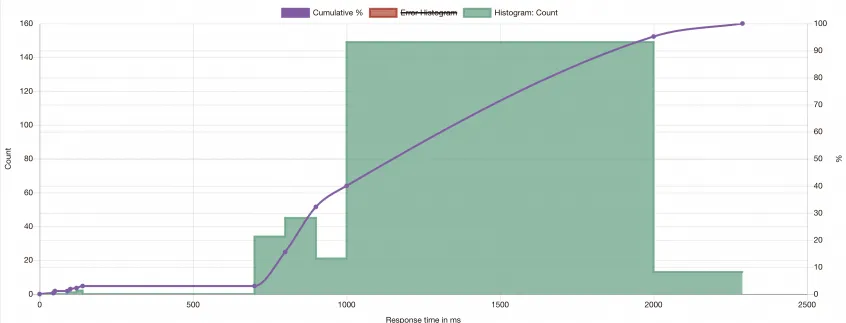
      Hasil visual di atas menunjukkan bahwa kecuali beberapa permintaan yang tidak dibatasi, sebagian besar permintaan tipe guest memiliki latensi 4.000-6.000 ms. Namun, sebagian besar permintaan tipe subscriber memiliki latensi 1.000-2.000 ms. Ketika permintaan ke layanan melebihi batas atas, permintaan tipe subscriber direspons terlebih dahulu. Selain itu, permintaan konkuren yang dikirim ke layanan dibatasi pada nilai tertentu.

Referensi

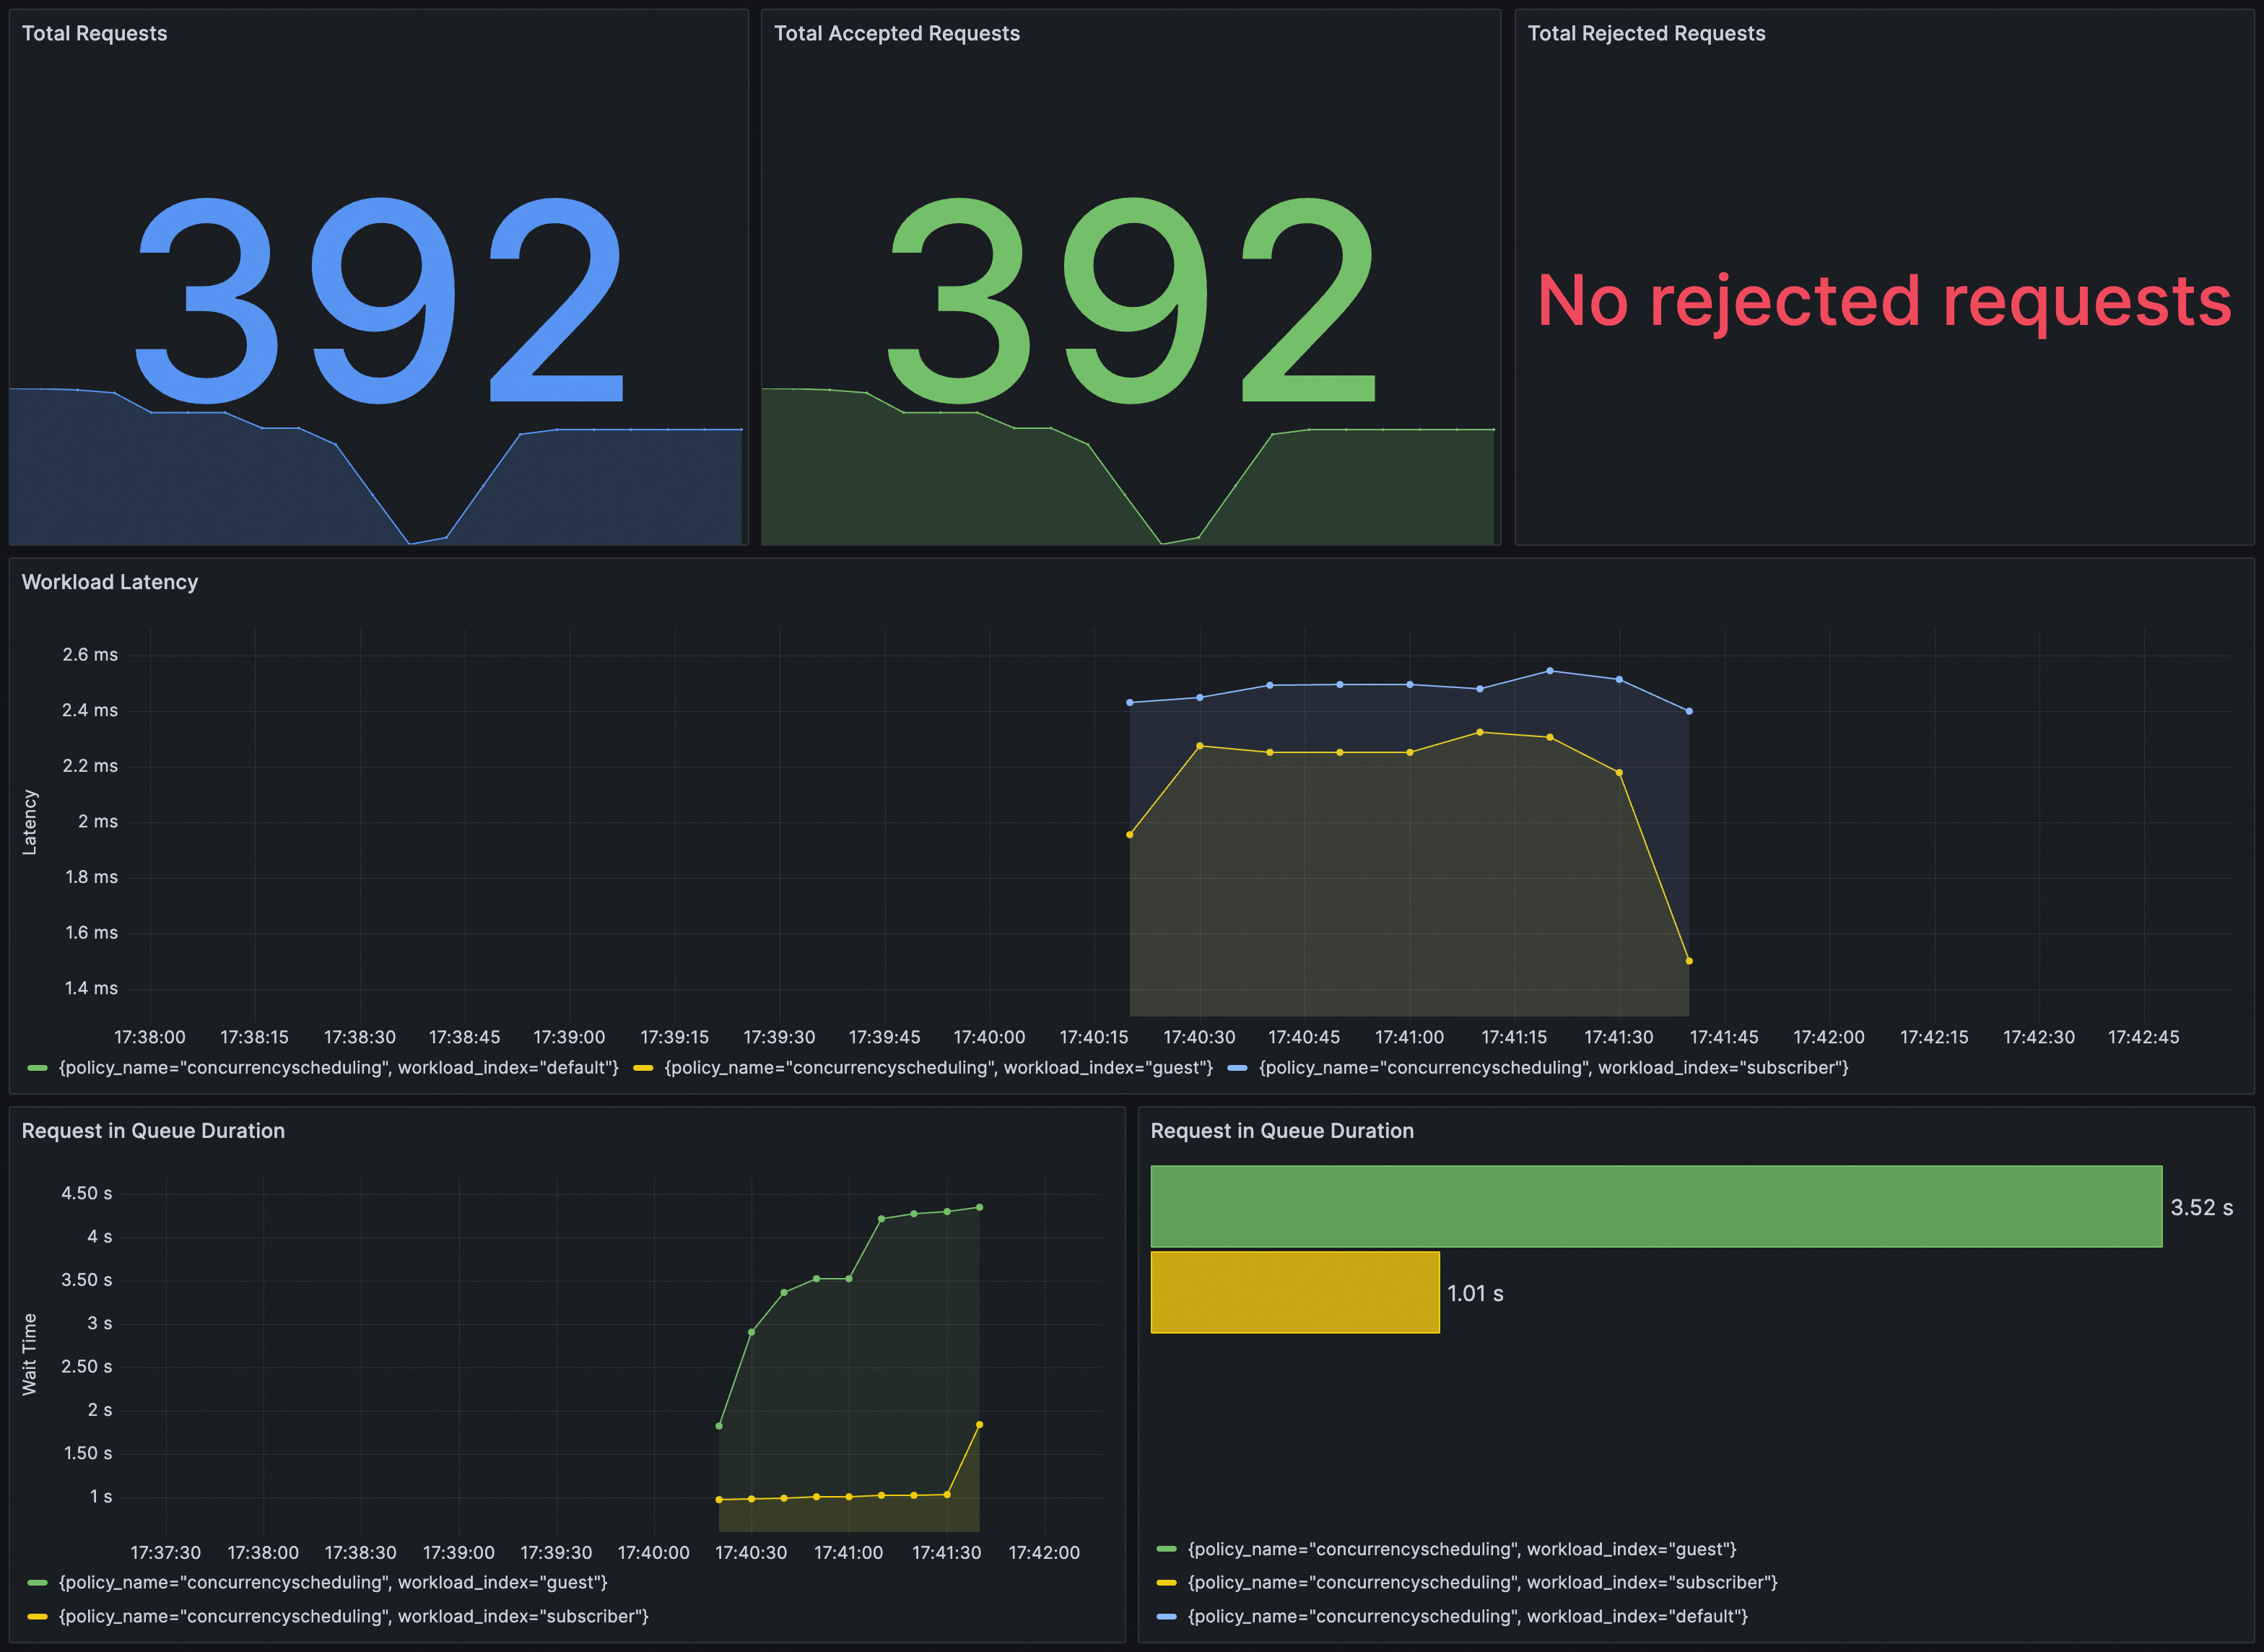
Anda dapat memverifikasi apakah ConcurrencySchedulingPolicy berlaku di Grafana. Anda perlu memastikan bahwa instance Prometheus untuk Grafana telah dikonfigurasi dengan suite penjadwalan lalu lintas ASM.

Anda dapat mengimpor konten berikut ke Grafana untuk membuat dasbor untuk ConcurrencySchedulingPolicy.

Klik untuk melihat detail

{
  "annotations": {
    "list": [
      {
        "builtIn": 1,
        "datasource": {
          "type": "grafana",
          "uid": "-- Grafana --"
        },
        "enable": true,
        "hide": true,
        "iconColor": "rgba(0, 211, 255, 1)",
        "name": "Annotations & Alerts",
        "type": "dashboard"
      }
    ]
  },
  "editable": true,
  "fiscalYearStartMonth": 0,
  "graphTooltip": 0,
  "id": 42,
  "links": [],
  "liveNow": false,
  "panels": [
    {
      "datasource": {
        "type": "prometheus",
        "uid": "${datasource}"
      },
      "description": "Sinyal yang berasal dari eksekusi berkala query: (sum(rate(workload_requests_total{policy_name=\"concurrencyscheduling\",component_id=\"root.0\",decision_type=\"DECISION_TYPE_ACCEPTED\"}[30s])) / sum(rate(workload_requests_total{policy_name=\"concurrencyscheduling\",component_id=\"root.0\"}[30s]))) * 100",
      "fieldConfig": {
        "defaults": {
          "color": {
            "mode": "palette-classic"
          },
          "custom": {
            "axisCenteredZero": false,
            "axisColorMode": "text",
            "axisLabel": "",
            "axisPlacement": "auto",
            "barAlignment": 0,
            "drawStyle": "line",
            "fillOpacity": 10,
            "gradientMode": "none",
            "hideFrom": {
              "legend": false,
              "tooltip": false,
              "viz": false
            },
            "lineInterpolation": "linear",
            "lineWidth": 1,
            "pointSize": 5,
            "scaleDistribution": {
              "type": "linear"
            },
            "showPoints": "auto",
            "spanNulls": false,
            "stacking": {
              "group": "A",
              "mode": "none"
            },
            "thresholdsStyle": {
              "mode": "off"
            }
          },
          "mappings": [],
          "thresholds": {
            "mode": "absolute",
            "steps": [
              {
                "color": "green",
                "value": null
              },
              {
                "color": "red",
                "value": 80
              }
            ]
          },
          "unit": ""
        },
        "overrides": []
      },
      "gridPos": {
        "h": 10,
        "w": 24,
        "x": 0,
        "y": 0
      },
      "id": 1,
      "interval": "10s",
      "options": {
        "legend": {
          "calcs": [],
          "displayMode": "list",
          "placement": "bottom",
          "showLegend": true
        },
        "tooltip": {
          "mode": "single",
          "sort": "none"
        }
      },
      "pluginVersion": "v10.1.0",
      "targets": [
        {
          "datasource": {
            "type": "prometheus",
            "uid": "${datasource}"
          },
          "editorMode": "code",
          "expr": "(sum by (policy_name)(rate(workload_requests_total{component_id=\"root.0\",decision_type=\"DECISION_TYPE_ACCEPTED\"}[30s])) / sum by (policy_name)(rate(workload_requests_total{component_id=\"root.0\"}[30s]))) * 100",
          "intervalFactor": 1,
          "legendFormat": "policy={{policy_name}}",
          "range": true,
          "refId": "A"
        }
      ],
      "title": "Persentase Penerimaan",
      "type": "timeseries"
    },
    {
      "datasource": {
        "type": "prometheus",
        "uid": "${datasource}"
      },
      "description": "",
      "fieldConfig": {
        "defaults": {
          "color": {
            "mode": "palette-classic"
          },
          "custom": {
            "axisCenteredZero": false,
            "axisColorMode": "text",
            "axisLabel": "Keputusan",
            "axisPlacement": "auto",
            "barAlignment": 0,
            "drawStyle": "line",
            "fillOpacity": 10,
            "gradientMode": "none",
            "hideFrom": {
              "legend": false,
              "tooltip": false,
              "viz": false
            },
            "lineInterpolation": "linear",
            "lineWidth": 1,
            "pointSize": 5,
            "scaleDistribution": {
              "type": "linear"
            },
            "showPoints": "auto",
            "spanNulls": false,
            "stacking": {
              "group": "A",
              "mode": "none"
            },
            "thresholdsStyle": {
              "mode": "off"
            }
          },
          "mappings": [],
          "thresholds": {
            "mode": "absolute",
            "steps": [
              {
                "color": "green",
                "value": null
              },
              {
                "color": "red",
                "value": 80
              }
            ]
          },
          "unit": "reqps"
        },
        "overrides": []
      },
      "gridPos": {
        "h": 10,
        "w": 24,
        "x": 0,
        "y": 10
      },
      "id": 2,
      "interval": "10s",
      "options": {
        "legend": {
          "calcs": [],
          "displayMode": "list",
          "placement": "bottom",
          "showLegend": true
        },
        "tooltip": {
          "mode": "single",
          "sort": "none"
        }
      },
      "pluginVersion": "v10.1.0",
      "targets": [
        {
          "datasource": {
            "type": "prometheus",
            "uid": "${datasource}"
          },
          "editorMode": "code",
          "expr": "sum by(decision_type, policy_name) (rate(workload_requests_total{component_id=\"root.0\"}[$__rate_interval]))",
          "intervalFactor": 1,
          "range": true,
          "refId": "A"
        }
      ],
      "title": "Keputusan Beban Kerja",
      "type": "timeseries"
    },
    {
      "datasource": {
        "type": "prometheus",
        "uid": "${datasource}"
      },
      "description": "",
      "fieldConfig": {
        "defaults": {
          "color": {
            "mode": "palette-classic"
          },
          "custom": {
            "axisCenteredZero": false,
            "axisColorMode": "text",
            "axisLabel": "Keputusan",
            "axisPlacement": "auto",
            "barAlignment": 0,
            "drawStyle": "line",
            "fillOpacity": 10,
            "gradientMode": "none",
            "hideFrom": {
              "legend": false,
              "tooltip": false,
              "viz": false
            },
            "lineInterpolation": "linear",
            "lineWidth": 1,
            "pointSize": 5,
            "scaleDistribution": {
              "type": "linear"
            },
            "showPoints": "auto",
            "spanNulls": false,
            "stacking": {
              "group": "A",
              "mode": "none"
            },
            "thresholdsStyle": {
              "mode": "off"
            }
          },
          "mappings": [],
          "thresholds": {
            "mode": "absolute",
            "steps": [
              {
                "color": "green",
                "value": null
              },
              {
                "color": "red",
                "value": 80
              }
            ]
          },
          "unit": "reqps"
        },
        "overrides": []
      },
      "gridPos": {
        "h": 10,
        "w": 24,
        "x": 0,
        "y": 20
      },
      "id": 3,
      "interval": "10s",
      "options": {
        "legend": {
          "calcs": [],
          "displayMode": "list",
          "placement": "bottom",
          "showLegend": true
        },
        "tooltip": {
          "mode": "single",
          "sort": "none"
        }
      },
      "pluginVersion": "v10.1.0",
      "targets": [
        {
          "datasource": {
            "type": "prometheus",
            "uid": "${datasource}"
          },
          "editorMode": "code",
          "expr": "sum by(workload_index, decision_type, policy_name) (rate(workload_requests_total{component_id=\"root.0\",decision_type=\"DECISION_TYPE_ACCEPTED\"}[$__rate_interval]))",
          "intervalFactor": 1,
          "range": true,
          "refId": "A"
        }
      ],
      "title": "Keputusan Beban Kerja (diterima)",
      "type": "timeseries"
    },
    {
      "datasource": {
        "type": "prometheus",
        "uid": "${datasource}"
      },
      "fieldConfig": {
        "defaults": {
          "color": {
            "mode": "palette-classic"
          },
          "custom": {
            "axisCenteredZero": false,
            "axisColorMode": "text",
            "axisLabel": "Keputusan",
            "axisPlacement": "auto",
            "barAlignment": 0,
            "drawStyle": "line",
            "fillOpacity": 10,
            "gradientMode": "none",
            "hideFrom": {
              "legend": false,
              "tooltip": false,
              "viz": false
            },
            "lineInterpolation": "linear",
            "lineWidth": 1,
            "pointSize": 5,
            "scaleDistribution": {
              "type": "linear"
            },
            "showPoints": "auto",
            "spanNulls": false,
            "stacking": {
              "group": "A",
              "mode": "none"
            },
            "thresholdsStyle": {
              "mode": "off"
            }
          },
          "mappings": [],
          "thresholds": {
            "mode": "absolute",
            "steps": [
              {
                "color": "green",
                "value": null
              },
              {
                "color": "red",
                "value": 80
              }
            ]
          },
          "unit": "reqps"
        },
        "overrides": []
      },
      "gridPos": {
        "h": 10,
        "w": 24,
        "x": 0,
        "y": 30
      },
      "id": 4,
      "interval": "10s",
      "options": {
        "legend": {
          "calcs": [],
          "displayMode": "list",
          "placement": "bottom",
          "showLegend": true
        },
        "tooltip": {
          "mode": "single",
          "sort": "none"
        }
      },
      "pluginVersion": "v10.1.0",
      "targets": [
        {
          "datasource": {
            "type": "prometheus",
            "uid": "${datasource}"
          },
          "editorMode": "code",
          "expr": "sum by(workload_index, decision_type, policy_name) (rate(workload_requests_total{component_id=\"root.0\",decision_type=\"DECISION_TYPE_REJECTED\"}[$__rate_interval]))",
          "intervalFactor": 1,
          "range": true,
          "refId": "A"
        }
      ],
      "title": "Keputusan Beban Kerja (ditolak)",
      "type": "timeseries"
    },
    {
      "datasource": {
        "type": "prometheus",
        "uid": "${datasource}"
      },
      "fieldConfig": {
        "defaults": {
          "color": {
            "mode": "thresholds"
          },
          "mappings": [],
          "noValue": "Tidak ada data",
          "thresholds": {
            "mode": "absolute",
            "steps": [
              {
                "color": "blue",
                "value": null
              }
            ]
          },
          "unit": "short"
        },
        "overrides": []
      },
      "gridPos": {
        "h": 10,
        "w": 8,
        "x": 0,
        "y": 40
      },
      "id": 5,
      "options": {
        "colorMode": "value",
        "graphMode": "area",
        "justifyMode": "center",
        "orientation": "horizontal",
        "reduceOptions": {
          "calcs": [
            "lastNotNull"
          ],
          "fields": "",
          "values": false
        },
        "textMode": "auto"
      },
      "pluginVersion": "10.0.9",
      "targets": [
        {
          "datasource": {
            "type": "prometheus",
            "uid": "${datasource}"
          },
          "editorMode": "code",
          "expr": "sum by (policy_name)(increase(workload_requests_total{component_id=\"root.0\"}[$__range]))",
          "instant": false,
          "intervalFactor": 1,
          "legendFormat": "{{ policy_name }}",
          "range": true,
          "refId": "A"
        }
      ],
      "title": "Total Permintaan",
      "type": "stat"
    },
    {
      "datasource": {
        "type": "prometheus",
        "uid": "${datasource}"
      },
      "fieldConfig": {
        "defaults": {
          "color": {
            "mode": "thresholds"
          },
          "mappings": [],
          "noValue": "Tidak ada data",
          "thresholds": {
            "mode": "absolute",
            "steps": [
              {
                "color": "green",
                "value": null
              }
            ]
          },
          "unit": "short"
        },
        "overrides": []
      },
      "gridPos": {
        "h": 10,
        "w": 8,
        "x": 8,
        "y": 40
      },
      "id": 6,
      "options": {
        "colorMode": "value",
        "graphMode": "area",
        "justifyMode": "center",
        "orientation": "horizontal",
        "reduceOptions": {
          "calcs": [
            "lastNotNull"
          ],
          "fields": "",
          "values": false
        },
        "textMode": "auto"
      },
      "pluginVersion": "10.0.9",
      "targets": [
        {
          "datasource": {
            "type": "prometheus",
            "uid": "${datasource}"
          },
          "editorMode": "code",
          "expr": "sum by (policy_name)(increase(workload_requests_total{component_id=\"root.0\",decision_type=\"DECISION_TYPE_ACCEPTED\"}[$__range]))",
          "instant": false,
          "intervalFactor": 1,
          "legendFormat": "{{ policy_name }}",
          "range": true,
          "refId": "A"
        }
      ],
      "title": "Total Permintaan Diterima",
      "type": "stat"
    },
    {
      "datasource": {
        "type": "prometheus",
        "uid": "${datasource}"
      },
      "fieldConfig": {
        "defaults": {
          "color": {
            "mode": "thresholds"
          },
          "mappings": [],
          "noValue": "Tidak ada permintaan yang ditolak",
          "thresholds": {
            "mode": "absolute",
            "steps": [
              {
                "color": "red",
                "value": null
              }
            ]
          },
          "unit": "short"
        },
        "overrides": []
      },
      "gridPos": {
        "h": 10,
        "w": 8,
        "x": 16,
        "y": 40
      },
      "id": 7,
      "options": {
        "colorMode": "value",
        "graphMode": "area",
        "justifyMode": "center",
        "orientation": "horizontal",
        "reduceOptions": {
          "calcs": [
            "lastNotNull"
          ],
          "fields": "",
          "values": false
        },
        "textMode": "auto"
      },
      "pluginVersion": "10.0.9",
      "targets": [
        {
          "datasource": {
            "type": "prometheus",
            "uid": "${datasource}"
          },
          "editorMode": "code",
          "expr": "sum by (policy_name)(increase(workload_requests_total{component_id=\"root.0\",decision_type=\"DECISION_TYPE_REJECTED\"}[$__range]))",
          "instant": false,
          "intervalFactor": 1,
          "legendFormat": "{{ policy_name }}",
          "range": true,
          "refId": "A"
        }
      ],
      "title": "Total Permintaan Ditolak",
      "type": "stat"
    },
    {
      "datasource": {
        "type": "prometheus",
        "uid": "${datasource}"
      },
      "description": "",
      "fieldConfig": {
        "defaults": {
          "color": {
            "mode": "palette-classic"
          },
          "custom": {
            "axisCenteredZero": false,
            "axisColorMode": "text",
            "axisLabel": "Latensi",
            "axisPlacement": "auto",
            "barAlignment": 0,
            "drawStyle": "line",
            "fillOpacity": 10,
            "gradientMode": "none",
            "hideFrom": {
              "legend": false,
              "tooltip": false,
              "viz": false
            },
            "lineInterpolation": "linear",
            "lineWidth": 1,
            "pointSize": 5,
            "scaleDistribution": {
              "type": "linear"
            },
            "showPoints": "auto",
            "spanNulls": false,
            "stacking": {
              "group": "A",
              "mode": "none"
            },
            "thresholdsStyle": {
              "mode": "off"
            }
          },
          "mappings": [],
          "thresholds": {
            "mode": "absolute",
            "steps": [
              {
                "color": "green",
                "value": null
              },
              {
                "color": "red",
                "value": 80
              }
            ]
          },
          "unit": "ms"
        },
        "overrides": []
      },
      "gridPos": {
        "h": 10,
        "w": 24,
        "x": 0,
        "y": 50
      },
      "id": 8,
      "interval": "10s",
      "options": {
        "legend": {
          "calcs": [],
          "displayMode": "list",
          "placement": "bottom",
          "showLegend": true
        },
        "tooltip": {
          "mode": "single",
          "sort": "none"
        }
      },
      "pluginVersion": "v10.1.0",
      "targets": [
        {
          "datasource": {
            "type": "prometheus",
            "uid": "${datasource}"
          },
          "editorMode": "code",
          "expr": "(sum by (workload_index, policy_name) (increase(workload_latency_ms_sum{component_id=\"root.0\"}[$__rate_interval])))/(sum by (workload_index, policy_name) (increase(workload_latency_ms_count{component_id=\"root.0\"}[$__rate_interval])))",
          "intervalFactor": 1,
          "range": true,
          "refId": "A"
        }
      ],
      "title": "Latensi Beban Kerja",
      "type": "timeseries"
    },
    {
      "datasource": {
        "type": "prometheus",
        "uid": "${datasource}"
      },
      "description": "",
      "fieldConfig": {
        "defaults": {
          "color": {
            "mode": "palette-classic"
          },
          "custom": {
            "axisCenteredZero": false,
            "axisColorMode": "text",
            "axisLabel": "Waktu Tunggu",
            "axisPlacement": "auto",
            "barAlignment": 0,
            "drawStyle": "line",
            "fillOpacity": 10,
            "gradientMode": "none",
            "hideFrom": {
              "legend": false,
              "tooltip": false,
              "viz": false
            },
            "lineInterpolation": "linear",
            "lineWidth": 1,
            "pointSize": 5,
            "scaleDistribution": {
              "type": "linear"
            },
            "showPoints": "auto",
            "spanNulls": false,
            "stacking": {
              "group": "A",
              "mode": "none"
            },
            "thresholdsStyle": {
              "mode": "off"
            }
          },
          "mappings": [],
          "thresholds": {
            "mode": "absolute",
            "steps": [
              {
                "color": "green",
                "value": null
              },
              {
                "color": "red",
                "value": 80
              }
            ]
          },
          "unit": "ms"
        },
        "overrides": []
      },
      "gridPos": {
        "h": 10,
        "w": 12,
        "x": 0,
        "y": 60
      },
      "id": 9,
      "interval": "10s",
      "options": {
        "legend": {
          "calcs": [],
          "displayMode": "list",
          "placement": "bottom",
          "showLegend": true
        },
        "tooltip": {
          "mode": "single",
          "sort": "none"
        }
      },
      "pluginVersion": "v10.1.0",
      "targets": [
        {
          "datasource": {
            "type": "prometheus",
            "uid": "${datasource}"
          },
          "editorMode": "code",
          "expr": "(sum by (workload_index, policy_name) (increase(request_in_queue_duration_ms_sum{component_id=\"root.0\"}[$__rate_interval])))/ ((sum by (workload_index, policy_name) (increase(request_in_queue_duration_ms_count{component_id=\"root.0\"}[$__rate_interval]))) != 0)",
          "intervalFactor": 1,
          "range": true,
          "refId": "A"
        }
      ],
      "title": "Durasi Permintaan dalam Antrian",
      "type": "timeseries"
    },
    {
      "datasource": {
        "type": "prometheus",
        "uid": "${datasource}"
      },
      "fieldConfig": {
        "defaults": {
          "color": {
            "mode": "palette-classic"
          },
          "custom": {
            "axisCenteredZero": false,
            "axisColorMode": "text",
            "axisGridShow": true,
            "axisLabel": "",
            "axisPlacement": "hidden",
            "fillOpacity": 80,
            "gradientMode": "none",
            "hideFrom": {
              "legend": false,
              "tooltip": false,
              "viz": false
            },
            "lineWidth": 1,
            "scaleDistribution": {
              "type": "linear"
            },
            "thresholdsStyle": {
              "mode": "off"
            }
          },
          "mappings": [],
          "thresholds": {
            "mode": "absolute",
            "steps": [
              {
                "color": "green",
                "value": null
              },
              {
                "color": "red",
                "value": 80
              }
            ]
          },
          "unit": "ms"
        },
        "overrides": []
      },
      "gridPos": {
        "h": 10,
        "w": 12,
        "x": 12,
        "y": 60
      },
      "id": 10,
      "options": {
        "barRadius": 0,
        "barWidth": 0.97,
        "colorByField": "",
        "fullHighlight": false,
        "groupWidth": 0.7,
        "legend": {
          "calcs": [],
          "displayMode": "list",
          "placement": "bottom",
          "showLegend": true
        },
        "orientation": "horizontal",
        "showValue": "auto",
        "stacking": "none",
        "tooltip": {
          "mode": "single",
          "sort": "sort"
        },
        "xTickLabelRotation": 0,
        "xTickLabelSpacing": 0
      },
      "pluginVersion": "v10.1.0",
      "targets": [
        {
          "datasource": {
            "type": "prometheus",
            "uid": "${datasource}"
          },
          "editorMode": "code",
          "expr": "topk(10, (sum by(workload_index, policy_name) (increase(request_in_queue_duration_ms_sum{component_id=\"root.0\"}[$__range])) ) / ((sum by(workload_index, policy_name) (increase(request_in_queue_duration_ms_count{component_id=\"root.0\"}[$__range])) )) != 0)",
          "format": "time_series",
          "instant": true,
          "intervalFactor": 1,
          "legendFormat": "",
          "range": false,
          "refId": "A"
        }
      ],
      "title": "Durasi Permintaan dalam Antrian",
      "type": "barchart"
    },
    {
      "datasource": {
        "type": "prometheus",
        "uid": "${datasource}"
      },
      "description": "",
      "fieldConfig": {
        "defaults": {
          "color": {
            "mode": "palette-classic"
          },
          "custom": {
            "axisCenteredZero": false,
            "axisColorMode": "text",
            "axisLabel": "Laju Token",
            "axisPlacement": "auto",
            "barAlignment": 0,
            "drawStyle": "line",
            "fillOpacity": 10,
            "gradientMode": "none",
            "hideFrom": {
              "legend": false,
              "tooltip": false,
              "viz": false
            },
            "lineInterpolation": "linear",
            "lineWidth": 1,
            "pointSize": 5,
            "scaleDistribution": {
              "type": "linear"
            },
            "showPoints": "auto",
            "spanNulls": false,
            "stacking": {
              "group": "A",
              "mode": "none"
            },
            "thresholdsStyle": {
              "mode": "off"
            }
          },
          "mappings": [],
          "thresholds": {
            "mode": "absolute",
            "steps": [
              {
                "color": "green",
                "value": null
              },
              {
                "color": "red",
                "value": 80
              }
            ]
          },
          "unit": ""
        },
        "overrides": []
      },
      "gridPos": {
        "h": 8,
        "w": 12,
        "x": 0,
        "y": 70
      },
      "id": 13,
      "interval": "10s",
      "options": {
        "legend": {
          "calcs": [],
          "displayMode": "list",
          "placement": "bottom",
          "showLegend": true
        },
        "tooltip": {
          "mode": "single",
          "sort": "none"
        }
      },
      "pluginVersion": "v10.1.0",
      "targets": [
        {
          "datasource": {
            "type": "prometheus",
            "uid": "${datasource}"
          },
          "editorMode": "code",
          "expr": "sum by (policy_name)(rate(incoming_tokens_total{component_id=\"root.0\"}[$__rate_interval]))",
          "intervalFactor": 1,
          "range": true,
          "refId": "A"
        }
      ],
      "title": "Laju Token Masuk",
      "type": "timeseries"
    },
    {
      "datasource": {
        "type": "prometheus",
        "uid": "${datasource}"
      },
      "description": "",
      "fieldConfig": {
        "defaults": {
          "color": {
            "mode": "palette-classic"
          },
          "custom": {
            "axisCenteredZero": false,
            "axisColorMode": "text",
            "axisLabel": "Laju Token",
            "axisPlacement": "auto",
            "barAlignment": 0,
            "drawStyle": "line",
            "fillOpacity": 10,
            "gradientMode": "none",
            "hideFrom": {
              "legend": false,
              "tooltip": false,
              "viz": false
            },
            "lineInterpolation": "linear",
            "lineWidth": 1,
            "pointSize": 5,
            "scaleDistribution": {
              "type": "linear"
            },
            "showPoints": "auto",
            "spanNulls": false,
            "stacking": {
              "group": "A",
              "mode": "none"
            },
            "thresholdsStyle": {
              "mode": "off"
            }
          },
          "mappings": [],
          "thresholds": {
            "mode": "absolute",
            "steps": [
              {
                "color": "green",
                "value": null
              },
              {
                "color": "red",
                "value": 80
              }
            ]
          },
          "unit": ""
        },
        "overrides": []
      },
      "gridPos": {
        "h": 8,
        "w": 12,
        "x": 12,
        "y": 70
      },
      "id": 14,
      "interval": "10s",
      "options": {
        "legend": {
          "calcs": [],
          "displayMode": "list",
          "placement": "bottom",
          "showLegend": true
        },
        "tooltip": {
          "mode": "single",
          "sort": "none"
        }
      },
      "pluginVersion": "v10.1.0",
      "targets": [
        {
          "datasource": {
            "type": "prometheus",
            "uid": "${datasource}"
          },
          "editorMode": "code",
          "expr": "sum by (policy_name)(rate(accepted_tokens_total{component_id=\"root.0\"}[$__rate_interval]))",
          "intervalFactor": 1,
          "legendFormat": "Laju Token Diterima",
          "range": true,
          "refId": "A"
        },
        {
          "datasource": {
            "type": "prometheus",
            "uid": "${datasource}"
          },
          "editorMode": "code",
          "expr": "sum by (policy_name)(rate(rejected_tokens_total{component_id=\"root.0\"}[$__rate_interval]))",
          "intervalFactor": 1,
          "legendFormat": "Laju Token Ditolak",
          "range": true,
          "refId": "B"
        }
      ],
      "title": "Laju Token Diterima vs Laju Token Ditolak",
      "type": "timeseries"
    },
    {
      "datasource": {
        "type": "prometheus",
        "uid": "${datasource}"
      },
      "fieldConfig": {
        "defaults": {
          "color": {
            "mode": "thresholds"
          },
          "mappings": [],
          "noValue": "Tidak ada data",
          "thresholds": {
            "mode": "absolute",
            "steps": [
              {
                "color": "blue",
                "value": null
              }
            ]
          },
          "unit": "short"
        },
        "overrides": []
      },
      "gridPos": {
        "h": 10,
        "w": 8,
        "x": 0,
        "y": 78
      },
      "id": 15,
      "options": {
        "colorMode": "value",
        "graphMode": "area",
        "justifyMode": "center",
        "orientation": "horizontal",
        "reduceOptions": {
          "calcs": [
            "lastNotNull"
          ],
          "fields": "",
          "values": false
        },
        "textMode": "auto"
      },
      "pluginVersion": "10.0.9",
      "targets": [
        {
          "datasource": {
            "type": "prometheus",
            "uid": "${datasource}"
          },
          "editorMode": "code",
          "expr": "sum by (policy_name)(increase(incoming_tokens_total{component_id=\"root.0\"}[$__range]))",
          "instant": false,
          "intervalFactor": 1,
          "legendFormat": "{{ policy_name }}",
          "range": true,
          "refId": "A"
        }
      ],
      "title": "Total Token Masuk",
      "type": "stat"
    },
    {
      "datasource": {
        "type": "prometheus",
        "uid": "${datasource}"
      },
      "fieldConfig": {
        "defaults": {
          "color": {
            "mode": "thresholds"
          },
          "mappings": [],
          "noValue": "Tidak ada data",
          "thresholds": {
            "mode": "absolute",
            "steps": [
              {
                "color": "green",
                "value": null
              }
            ]
          },
          "unit": "short"
        },
        "overrides": []
      },
      "gridPos": {
        "h": 10,
        "w": 8,
        "x": 8,
        "y": 78
      },
      "id": 16,
      "options": {
        "colorMode": "value",
        "graphMode": "area",
        "justifyMode": "center",
        "orientation": "horizontal",
        "reduceOptions": {
          "calcs": [
            "lastNotNull"
          ],
          "fields": "",
          "values": false
        },
        "textMode": "auto"
      },
      "pluginVersion": "10.0.9",
      "targets": [
        {
          "datasource": {
            "type": "prometheus",
            "uid": "${datasource}"
          },
          "editorMode": "code",
          "expr": "sum by (policy_name)(increase(accepted_tokens_total{component_id=\"root.0\"}[$__range]))",
          "instant": false,
          "intervalFactor": 1,
          "legendFormat": "{{ instance }} - {{ policy_name }}",
          "range": true,
          "refId": "A"
        }
      ],
      "title": "Total Token Diterima",
      "type": "stat"
    },
    {
      "datasource": {
        "type": "prometheus",
        "uid": "${datasource}"
      },
      "fieldConfig": {
        "defaults": {
          "color": {
            "mode": "thresholds"
          },
          "mappings": [],
          "noValue": "Tidak ada data",
          "thresholds": {
            "mode": "absolute",
            "steps": [
              {
                "color": "red",
                "value": null
              }
            ]
          },
          "unit": "short"
        },
        "overrides": []
      },
      "gridPos": {
        "h": 10,
        "w": 8,
        "x": 16,
        "y": 78
      },
      "id": 17,
      "options": {
        "colorMode": "value",
        "graphMode": "area",
        "justifyMode": "center",
        "orientation": "horizontal",
        "reduceOptions": {
          "calcs": [
            "lastNotNull"
          ],
          "fields": "",
          "values": false
        },
        "textMode": "auto"
      },
      "pluginVersion": "10.0.9",
      "targets": [
        {
          "datasource": {
            "type": "prometheus",
            "uid": "${datasource}"
          },
          "editorMode": "code",
          "expr": "sum by (policy_name)(increase(rejected_tokens_total{component_id=\"root.0\"}[$__range]))",
          "instant": false,
          "intervalFactor": 1,
          "legendFormat": "{{ policy_name }}",
          "range": true,
          "refId": "A"
        }
      ],
      "title": "Total Token Ditolak",
      "type": "stat"
    }
  ],
  "refresh": "",
  "schemaVersion": 38,
  "style": "dark",
  "tags": [],
  "templating": {
    "list": [
      {
        "hide": 0,
        "includeAll": false,
        "label": "Sumber Data",
        "multi": false,
        "name": "datasource",
        "options": [],
        "query": "prometheus",
        "refresh": 1,
        "regex": "",
        "skipUrlSync": false,
        "type": "datasource"
      }
    ]
  },
  "time": {
    "from": "now-5m",
    "to": "now"
  },
  "timepicker": {},
  "timezone": "browser",
  "title": "Ringkasan Kebijakan - concurrencyscheduling",
  "version": 2,
  "weekStart": ""
}

Dasbor adalah sebagai berikut.

image