All Products
Search
Document Center

Alibaba Cloud Service Mesh:Gunakan AverageLatencySchedulingPolicy untuk mengimplementasikan penjadwalan permintaan berdasarkan prioritas

Last Updated:Jul 02, 2025

Suite penjadwalan lalu lintas dari Service Mesh (ASM) mendukung kebijakan penjadwalan permintaan berdasarkan prioritas. Saat sistem mengalami beban berlebih, permintaan dengan prioritas tinggi diproses terlebih dahulu. Topik ini menjelaskan cara menggunakan AverageLatencySchedulingPolicy yang disediakan oleh suite penjadwalan lalu lintas untuk mengimplementasikan penjadwalan permintaan berdasarkan prioritas.

Informasi latar belakang

Kebijakan penjadwalan permintaan berdasarkan prioritas membandingkan latensi waktu nyata dengan latensi rata-rata historis untuk menentukan apakah terjadi overload lalu lintas. Jika terjadi overload, mekanisme penjadwalan berdasarkan bucket token dan prioritas digunakan untuk menjadwalkan permintaan. Kebijakan ini bekerja sebagai berikut:

  1. Pendeteksian Overload: Kebijakan ini membandingkan latensi rata-rata pada periode sebelumnya dengan latensi saat ini untuk menentukan apakah sistem mengalami beban berlebih.

  2. Penyesuaian Laju Penerbitan Token: Jika terjadi overload, data pemantauan yang diperoleh pada langkah sebelumnya dikirim ke pengontrol khusus, yang akan mengatur laju pengisian bucket token.

  3. Penjadwalan Permintaan: Permintaan memiliki prioritas yang berbeda. Saat terjadi overload, permintaan dengan prioritas lebih tinggi memiliki peluang lebih besar untuk mendapatkan token.

Kebijakan ini dapat digunakan untuk mengantri permintaan ketika layanan macet akibat konkurensi permintaan tinggi dan latensi respons terus meningkat. Berbeda dengan kebijakan throttling umum, kebijakan ini tidak langsung menolak permintaan tetapi meletakkannya dalam antrian prioritas. Laju permintaan dibatasi menggunakan mekanisme bucket token, dan urutan pemrosesan permintaan disesuaikan sesuai dengan prioritas.

Prasyarat

Langkah 1: Buat AverageLatencySchedulingPolicy

  1. Gunakan kubectl untuk terhubung ke instance ASM. Untuk informasi lebih lanjut, lihat Gunakan kubectl pada Control Plane untuk Mengakses Sumber Daya Istio.

  2. Buat file AverageLatencySchedulingPolicy.yaml dengan konten berikut:

    apiVersion: istio.alibabacloud.com/v1
    kind: AverageLatencySchedulingPolicy
    metadata:
      name: workload-prioritization
      namespace: istio-system
    spec:
      load_scheduling_core:
        aimd_load_scheduler:
          load_scheduler:
            workload_latency_based_tokens: true
            selectors:
              - service: httpbin.default.svc.cluster.local
            scheduler:
              workloads:
                - label_matcher:
                    match_labels:
                      http.request.header.user_type: "guest"
                  parameters:
                    priority: 50.0
                  name: "guest"
                - label_matcher:
                    match_labels:
                      http.request.header.user_type: "subscriber"
                  parameters:
                    priority: 200.0
                  name: "subscriber"
                  

    Tabel berikut menjelaskan beberapa bidang tersebut.

    Bidang

    Deskripsi

    workload_latency_based_tokens

    Menunjukkan apakah akan menyesuaikan jumlah token secara dinamis berdasarkan latensi rata-rata beban kerja. Jendela waktu untuk memperkirakan latensi rata-rata adalah 30 menit terakhir.

    service

    Layanan tempat kebijakan penjadwalan berlaku.

    workloads

    Dua jenis permintaan didefinisikan berdasarkan user_type di header permintaan: guest dan subscriber. Prioritas permintaan tipe guest adalah 50, dan prioritas permintaan tipe subscriber adalah 200.

    Untuk informasi lebih lanjut tentang bidang yang didukung oleh AverageLatencySchedulingPolicy, lihat Deskripsi Bidang AverageLatencySchedulingPolicy.

Langkah 2: Lakukan pengujian

Dalam contoh ini, alat pengujian beban fortio digunakan. Untuk informasi lebih lanjut, lihat Instal Fortio.

Pertama, simulasi beberapa permintaan layanan normal untuk menghasilkan latensi rata-rata permintaan:

fortio load -c 20 -qps 100000 -t 60m http://${Alamat IP gateway ASM}/status/200

Tiga menit setelah perintah sebelumnya dijalankan, buka dua terminal lagi dan kirim permintaan uji. Selama pengujian, pastikan proses fortio selalu berjalan dan jangan tutup terminal yang sesuai.

Di dua terminal tersebut, jalankan dua perintah pengujian beban berikut secara terpisah. Mulailah menjalankan kedua tes tersebut bersamaan sebanyak mungkin.

fortio load -c 40 -qps 100000  -H "user_type:guest" -t 3m http://${Alamat IP gateway ASM}/status/201
fortio load -c 40 -qps 100000  -H "user_type:subscriber" -t 3m http://${Alamat IP gateway ASM}/status/202

Dalam dua perintah tersebut, jalur permintaan yang berbeda digunakan untuk memudahkan pengamatan hasil pengujian berdasarkan log akses.

Langkah 3: Analisis hasil pengujian

Blok kode berikut menunjukkan beberapa baris terakhir dari keluaran dua perintah dalam lingkungan pengujian saat ini:

Kode 201 : 26852 (97,8 %)
Kode 503 : 601 (2,2 %)
Ukuran Header Respons : hitungan 27453 rata-rata 242,91564 +/- 36,35 min 0 maks 249 total 6668763
Ukuran Body/Totals Respons : hitungan 27453 rata-rata 246,17754 +/- 14,56 min 149 maks 249 total 6758312
Semua selesai 27453 panggilan (plus 40 pemanasan) 262,318 ms rata-rata, 152,4 qps
Kode 202 : 52765 (100,0 %)
Ukuran Header Respons : hitungan 52765 rata-rata 248,86358 +/- 0,5951 min 248 maks 250 total 13131287
Ukuran Body/Totals Respons : hitungan 52765 rata-rata 248,86358 +/- 0,5951 min 248 maks 250 total 13131287
Semua selesai 52765 panggilan (plus 40 pemanasan) 136,472 ms rata-rata, 292,9 qps

Blok kode tersebut menunjukkan bahwa:

  • Semua permintaan dari pengguna subscriber berhasil, dan tidak ada kode status HTTP 503 yang dikembalikan. Kode status HTTP 503 dikembalikan untuk 2,2% permintaan dari pengguna guest.

  • Latensi rata-rata permintaan dari pengguna subscriber sekitar 136 ms. Latensi rata-rata permintaan dari pengguna guest sekitar 262 ms. Selain itu, queries per second (QPS) dari kedua pengguna berbeda secara signifikan.

Dapat disimpulkan bahwa AverageLatencySchedulingPolicy memprioritaskan pemrosesan permintaan pengguna subscriber saat latensi permintaan meningkat.

Penting

Hasil pengujian dalam topik ini hanya nilai teoretis. Data aktual bergantung pada lingkungan operasi Anda. Hasil pengujian beban bervariasi di lingkungan pengujian yang berbeda. Hanya hubungan relatif data yang dianalisis dalam contoh ini.

(Opsional) Langkah 4: Analisis hasil pengujian berdasarkan log akses gateway ASM

  1. Masuk ke Konsol ASM. Di panel navigasi di sebelah kiri, pilih Service Mesh > Mesh Management.

  2. Di halaman Mesh Management, klik nama instance ASM. Di panel navigasi di sebelah kiri, pilih ASM Gateways > Ingress Gateway.

  3. Klik nama gateway ASM untuk masuk ke halaman Gateway overview. Kemudian, klik Gateway Logs untuk melihat log akses gateway ASM.

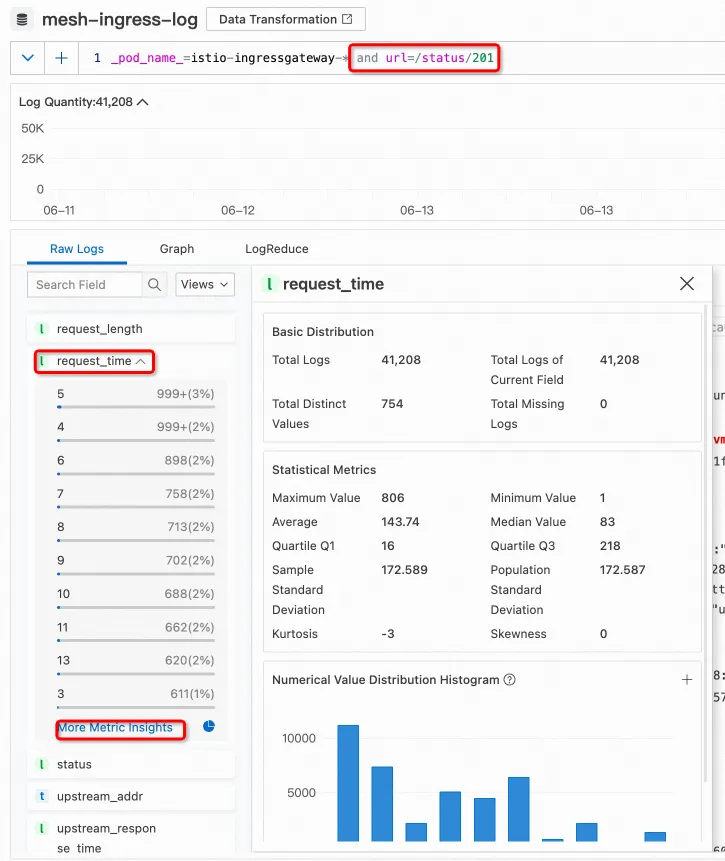
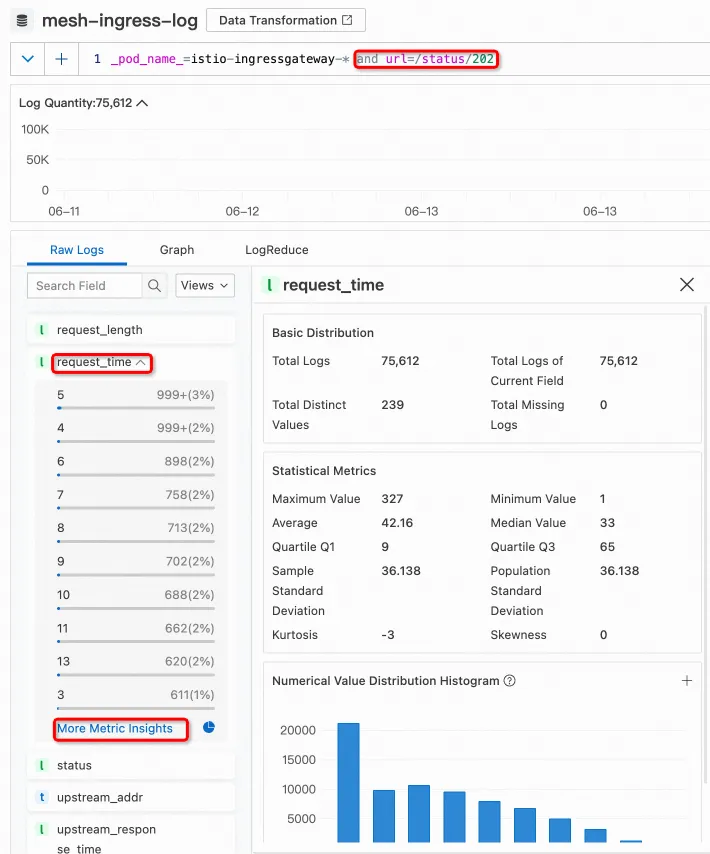
  4. Jalur akses pengguna guest dan subscriber berbeda. Anda dapat menggunakan jalur akses untuk mengambil hasil akses masing-masing pengguna:

image.png

image.png

Referensi

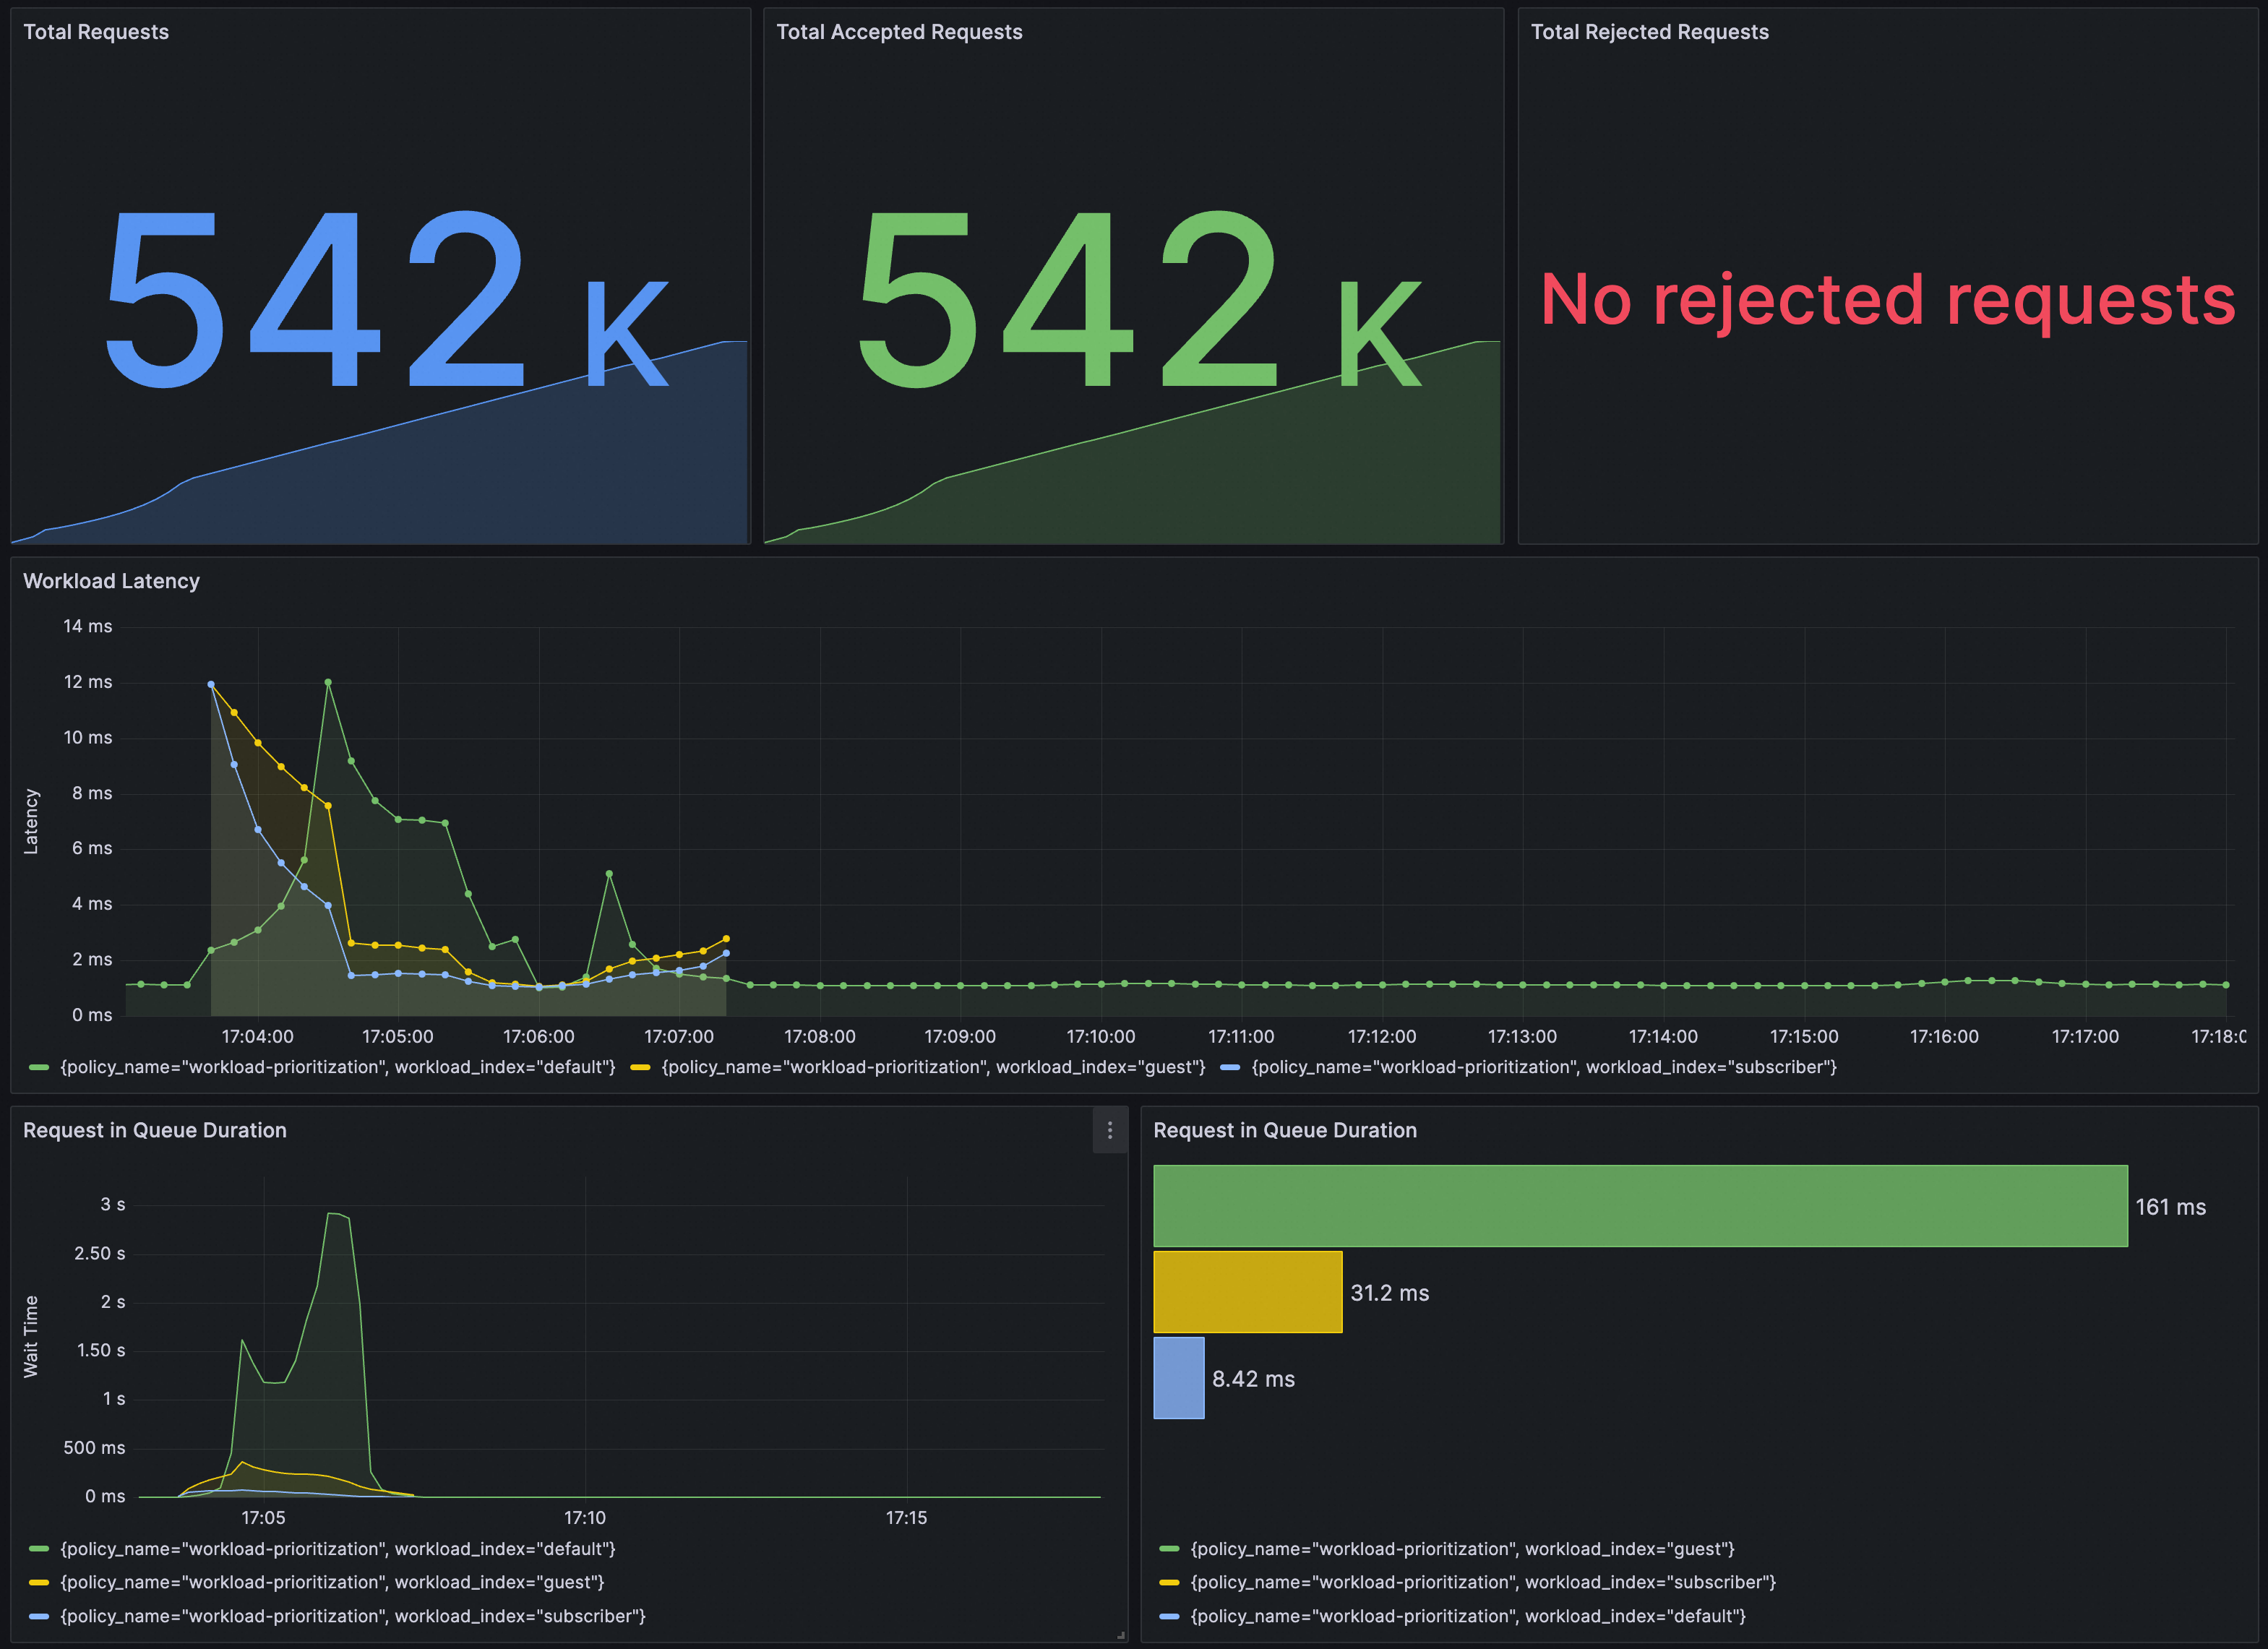
Anda dapat memverifikasi apakah AverageLatencySchedulingPolicy berlaku di Grafana. Pastikan bahwa instance Prometheus untuk Grafana telah dikonfigurasi dengan suite penjadwalan lalu lintas ASM.

Anda dapat mengimpor konten berikut ke Grafana untuk membuat dasbor untuk AverageLatencySchedulingPolicy.

Klik untuk Melihat Detail

{
  "annotations": {
    "list": [
      {
        "builtIn": 1,
        "datasource": {
          "type": "grafana",
          "uid": "-- Grafana --"
        },
        "enable": true,
        "hide": true,
        "iconColor": "rgba(0, 211, 255, 1)",
        "name": "Annotations & Alerts",
        "type": "dashboard"
      }
    ]
  },
  "editable": true,
  "fiscalYearStartMonth": 0,
  "graphTooltip": 0,
  "id": 40,
  "links": [],
  "liveNow": false,
  "panels": [
    {
      "datasource": {
        "type": "prometheus",
        "uid": "${datasource}"
      },
      "description": "",
      "fieldConfig": {
        "defaults": {
          "color": {
            "mode": "palette-classic"
          },
          "custom": {
            "axisCenteredZero": false,
            "axisColorMode": "text",
            "axisLabel": "Keputusan",
            "axisPlacement": "auto",
            "barAlignment": 0,
            "drawStyle": "line",
            "fillOpacity": 10,
            "gradientMode": "none",
            "hideFrom": {
              "legend": false,
              "tooltip": false,
              "viz": false
            },
            "lineInterpolation": "linear",
            "lineWidth": 1,
            "pointSize": 5,
            "scaleDistribution": {
              "type": "linear"
            },
            "showPoints": "auto",
            "spanNulls": false,
            "stacking": {
              "group": "A",
              "mode": "none"
            },
            "thresholdsStyle": {
              "mode": "off"
            }
          },
          "mappings": [],
          "thresholds": {
            "mode": "absolute",
            "steps": [
              {
                "color": "green",
                "value": null
              },
              {
                "color": "red",
                "value": 80
              }
            ]
          },
          "unit": "reqps"
        },
        "overrides": []
      },
      "gridPos": {
        "h": 10,
        "w": 24,
        "x": 0,
        "y": 0
      },
      "id": 1,
      "interval": "10s",
      "options": {
        "legend": {
          "calcs": [],
          "displayMode": "list",
          "placement": "bottom",
          "showLegend": true
        },
        "tooltip": {
          "mode": "single",
          "sort": "none"
        }
      },
      "pluginVersion": "v10.1.0",
      "targets": [
        {
          "datasource": {
            "type": "prometheus",
            "uid": "${datasource}"
          },
          "editorMode": "code",
          "expr": "sum by(decision_type, policy_name) (rate(workload_requests_total{component_id=\"root.0.4\"}[$__rate_interval]))",
          "intervalFactor": 1,
          "range": true,
          "refId": "A"
        }
      ],
      "title": "Keputusan Beban Kerja",
      "type": "timeseries"
    },
    {
      "datasource": {
        "type": "prometheus",
        "uid": "${datasource}"
      },
      "description": "",
      "fieldConfig": {
        "defaults": {
          "color": {
            "mode": "palette-classic"
          },
          "custom": {
            "axisCenteredZero": false,
            "axisColorMode": "text",
            "axisLabel": "Keputusan",
            "axisPlacement": "auto",
            "barAlignment": 0,
            "drawStyle": "line",
            "fillOpacity": 10,
            "gradientMode": "none",
            "hideFrom": {
              "legend": false,
              "tooltip": false,
              "viz": false
            },
            "lineInterpolation": "linear",
            "lineWidth": 1,
            "pointSize": 5,
            "scaleDistribution": {
              "type": "linear"
            },
            "showPoints": "auto",
            "spanNulls": false,
            "stacking": {
              "group": "A",
              "mode": "none"
            },
            "thresholdsStyle": {
              "mode": "off"
            }
          },
          "mappings": [],
          "thresholds": {
            "mode": "absolute",
            "steps": [
              {
                "color": "green",
                "value": null
              },
              {
                "color": "red",
                "value": 80
              }
            ]
          },
          "unit": "reqps"
        },
        "overrides": []
      },
      "gridPos": {
        "h": 10,
        "w": 24,
        "x": 0,
        "y": 10
      },
      "id": 2,
      "interval": "10s",
      "options": {
        "legend": {
          "calcs": [],
          "displayMode": "list",
          "placement": "bottom",
          "showLegend": true
        },
        "tooltip": {
          "mode": "single",
          "sort": "none"
        }
      },
      "pluginVersion": "v10.1.0",
      "targets": [
        {
          "datasource": {
            "type": "prometheus",
            "uid": "${datasource}"
          },
          "editorMode": "code",
          "expr": "sum by(workload_index, decision_type, policy_name) (rate(workload_requests_total{component_id=\"root.0.4\",decision_type=\"DECISION_TYPE_ACCEPTED\"}[$__rate_interval]))",
          "intervalFactor": 1,
          "range": true,
          "refId": "A"
        }
      ],
      "title": "Keputusan Beban Kerja (diterima)",
      "type": "timeseries"
    },
    {
      "datasource": {
        "type": "prometheus",
        "uid": "${datasource}"
      },
      "description": "",
      "fieldConfig": {
        "defaults": {
          "color": {
            "mode": "palette-classic"
          },
          "custom": {
            "axisCenteredZero": false,
            "axisColorMode": "text",
            "axisLabel": "Keputusan",
            "axisPlacement": "auto",
            "barAlignment": 0,
            "drawStyle": "line",
            "fillOpacity": 10,
            "gradientMode": "none",
            "hideFrom": {
              "legend": false,
              "tooltip": false,
              "viz": false
            },
            "lineInterpolation": "linear",
            "lineWidth": 1,
            "pointSize": 5,
            "scaleDistribution": {
              "type": "linear"
            },
            "showPoints": "auto",
            "spanNulls": false,
            "stacking": {
              "group": "A",
              "mode": "none"
            },
            "thresholdsStyle": {
              "mode": "off"
            }
          },
          "mappings": [],
          "thresholds": {
            "mode": "absolute",
            "steps": [
              {
                "color": "green",
                "value": null
              },
              {
                "color": "red",
                "value": 80
              }
            ]
          },
          "unit": "reqps"
        },
        "overrides": []
      },
      "gridPos": {
        "h": 10,
        "w": 24,
        "x": 0,
        "y": 20
      },
      "id": 3,
      "interval": "10s",
      "options": {
        "legend": {
          "calcs": [],
          "displayMode": "list",
          "placement": "bottom",
          "showLegend": true
        },
        "tooltip": {
          "mode": "single",
          "sort": "none"
        }
      },
      "pluginVersion": "v10.1.0",
      "targets": [
        {
          "datasource": {
            "type": "prometheus",
            "uid": "${datasource}"
          },
          "editorMode": "code",
          "expr": "sum by(workload_index, decision_type, policy_name) (rate(workload_requests_total{component_id=\"root.0.4\",decision_type=\"DECISION_TYPE_REJECTED\"}[$__rate_interval]))",
          "intervalFactor": 1,
          "range": true,
          "refId": "A"
        }
      ],
      "title": "Keputusan Beban Kerja (ditolak)",
      "type": "timeseries"
    },
    {
      "datasource": {
        "type": "prometheus",
        "uid": "${datasource}"
      },
      "fieldConfig": {
        "defaults": {
          "color": {
            "mode": "thresholds"
          },
          "mappings": [],
          "noValue": "Tidak ada data",
          "thresholds": {
            "mode": "absolute",
            "steps": [
              {
                "color": "blue",
                "value": null
              }
            ]
          },
          "unit": "short"
        },
        "overrides": []
      },
      "gridPos": {
        "h": 10,
        "w": 8,
        "x": 0,
        "y": 30
      },
      "id": 4,
      "options": {
        "colorMode": "value",
        "graphMode": "area",
        "justifyMode": "center",
        "orientation": "horizontal",
        "reduceOptions": {
          "calcs": [
            "lastNotNull"
          ],
          "fields": "",
          "values": false
        },
        "textMode": "auto"
      },
      "pluginVersion": "10.0.9",
      "targets": [
        {
          "datasource": {
            "type": "prometheus",
            "uid": "${datasource}"
          },
          "editorMode": "code",
          "expr": "sum by (policy_name) (increase(workload_requests_total{component_id=\"root.0.4\"}[$__range]))",
          "instant": false,
          "intervalFactor": 1,
          "legendFormat": "{{ instance }} - {{ policy_name }}",
          "range": true,
          "refId": "A"
        }
      ],
      "title": "Total Permintaan",
      "type": "stat"
    },
    {
      "datasource": {
        "type": "prometheus",
        "uid": "${datasource}"
      },
      "fieldConfig": {
        "defaults": {
          "color": {
            "mode": "thresholds"
          },
          "mappings": [],
          "noValue": "Tidak ada data",
          "thresholds": {
            "mode": "absolute",
            "steps": [
              {
                "color": "green",
                "value": null
              }
            ]
          },
          "unit": "short"
        },
        "overrides": []
      },
      "gridPos": {
        "h": 10,
        "w": 8,
        "x": 8,
        "y": 30
      },
      "id": 5,
      "options": {
        "colorMode": "value",
        "graphMode": "area",
        "justifyMode": "center",
        "orientation": "horizontal",
        "reduceOptions": {
          "calcs": [
            "lastNotNull"
          ],
          "fields": "",
          "values": false
        },
        "textMode": "auto"
      },
      "pluginVersion": "10.0.9",
      "targets": [
        {
          "datasource": {
            "type": "prometheus",
            "uid": "${datasource}"
          },
          "editorMode": "code",
          "expr": "sum by (policy_name)(increase(workload_requests_total{component_id=\"root.0.4\", decision_type=\"DECISION_TYPE_ACCEPTED\"}[$__range]))",
          "instant": false,
          "intervalFactor": 1,
          "legendFormat": "{{ instance }} - {{ policy_name }}",
          "range": true,
          "refId": "A"
        }
      ],
      "title": "Total Permintaan Diterima",
      "type": "stat"
    },
    {
      "datasource": {
        "type": "prometheus",
        "uid": "${datasource}"
      },
      "fieldConfig": {
        "defaults": {
          "color": {
            "mode": "thresholds"
          },
          "mappings": [],
          "noValue": "Tidak ada permintaan ditolak",
          "thresholds": {
            "mode": "absolute",
            "steps": [
              {
                "color": "red",
                "value": null
              }
            ]
          },
          "unit": "short"
        },
        "overrides": []
      },
      "gridPos": {
        "h": 10,
        "w": 8,
        "x": 16,
        "y": 30
      },
      "id": 6,
      "options": {
        "colorMode": "value",
        "graphMode": "area",
        "justifyMode": "center",
        "orientation": "horizontal",
        "reduceOptions": {
          "calcs": [
            "lastNotNull"
          ],
          "fields": "",
          "values": false
        },
        "textMode": "auto"
      },
      "pluginVersion": "10.0.9",
      "targets": [
        {
          "datasource": {
            "type": "prometheus",
            "uid": "${datasource}"
          },
          "editorMode": "code",
          "expr": "sum by (policy_name) (increase(workload_requests_total{component_id=\"root.0.4\", decision_type=\"DECISION_TYPE_REJECTED\"}[$__range]))",
          "instant": false,
          "intervalFactor": 1,
          "legendFormat": "{{ instance }} - {{ policy_name }}",
          "range": true,
          "refId": "A"
        }
      ],
      "title": "Total Permintaan Ditolak",
      "type": "stat"
    },
    {
      "datasource": {
        "type": "prometheus",
        "uid": "${datasource}"
      },
      "description": "",
      "fieldConfig": {
        "defaults": {
          "color": {
            "mode": "palette-classic"
          },
          "custom": {
            "axisCenteredZero": false,
            "axisColorMode": "text",
            "axisLabel": "Latensi",
            "axisPlacement": "auto",
            "barAlignment": 0,
            "drawStyle": "line",
            "fillOpacity": 10,
            "gradientMode": "none",
            "hideFrom": {
              "legend": false,
              "tooltip": false,
              "viz": false
            },
            "lineInterpolation": "linear",
            "lineWidth": 1,
            "pointSize": 5,
            "scaleDistribution": {
              "type": "linear"
            },
            "showPoints": "auto",
            "spanNulls": false,
            "stacking": {
              "group": "A",
              "mode": "none"
            },
            "thresholdsStyle": {
              "mode": "off"
            }
          },
          "mappings": [],
          "thresholds": {
            "mode": "absolute",
            "steps": [
              {
                "color": "green",
                "value": null
              },
              {
                "color": "red",
                "value": 80
              }
            ]
          },
          "unit": "ms"
        },
        "overrides": []
      },
      "gridPos": {
        "h": 10,
        "w": 24,
        "x": 0,
        "y": 40
      },
      "id": 7,
      "interval": "10s",
      "options": {
        "legend": {
          "calcs": [],
          "displayMode": "list",
          "placement": "bottom",
          "showLegend": true
        },
        "tooltip": {
          "mode": "single",
          "sort": "none"
        }
      },
      "pluginVersion": "v10.1.0",
      "targets": [
        {
          "datasource": {
            "type": "prometheus",
            "uid": "${datasource}"
          },
          "editorMode": "code",
          "expr": "(sum by (workload_index, policy_name) (increase(workload_latency_ms_sum{component_id=\"root.0.4\"}[$__rate_interval])))/(sum by (workload_index, policy_name) (increase(workload_latency_ms_count{component_id=\"root.0.4\"}[$__rate_interval])))",
          "intervalFactor": 1,
          "range": true,
          "refId": "A"
        }
      ],
      "title": "Latensi Beban Kerja",
      "type": "timeseries"
    },
    {
      "datasource": {
        "type": "prometheus",
        "uid": "${datasource}"
      },
      "description": "",
      "fieldConfig": {
        "defaults": {
          "color": {
            "mode": "palette-classic"
          },
          "custom": {
            "axisCenteredZero": false,
            "axisColorMode": "text",
            "axisLabel": "Waktu Tunggu",
            "axisPlacement": "auto",
            "barAlignment": 0,
            "drawStyle": "line",
            "fillOpacity": 10,
            "gradientMode": "none",
            "hideFrom": {
              "legend": false,
              "tooltip": false,
              "viz": false
            },
            "lineInterpolation": "linear",
            "lineWidth": 1,
            "pointSize": 5,
            "scaleDistribution": {
              "type": "linear"
            },
            "showPoints": "auto",
            "spanNulls": false,
            "stacking": {
              "group": "A",
              "mode": "none"
            },
            "thresholdsStyle": {
              "mode": "off"
            }
          },
          "mappings": [],
          "thresholds": {
            "mode": "absolute",
            "steps": [
              {
                "color": "green",
                "value": null
              },
              {
                "color": "red",
                "value": 80
              }
            ]
          },
          "unit": "ms"
        },
        "overrides": []
      },
      "gridPos": {
        "h": 10,
        "w": 12,
        "x": 0,
        "y": 50
      },
      "id": 8,
      "interval": "10s",
      "options": {
        "legend": {
          "calcs": [],
          "displayMode": "list",
          "placement": "bottom",
          "showLegend": true
        },
        "tooltip": {
          "mode": "single",
          "sort": "none"
        }
      },
      "pluginVersion": "v10.1.0",
      "targets": [
        {
          "datasource": {
            "type": "prometheus",
            "uid": "${datasource}"
          },
          "editorMode": "code",
          "expr": "(sum by (workload_index, policy_name) (increase(request_in_queue_duration_ms_sum{component_id=\"root.0.4\"}[$__rate_interval])))/ ((sum by (workload_index, policy_name) (increase(request_in_queue_duration_ms_count{component_id=\"root.0.4\"}[$__rate_interval]))) != 0)",
          "intervalFactor": 1,
          "range": true,
          "refId": "A"
        }
      ],
      "title": "Durasi Permintaan dalam Antrian",
      "type": "timeseries"
    },
    {
      "datasource": {
        "type": "prometheus",
        "uid": "${datasource}"
      },
      "fieldConfig": {
        "defaults": {
          "color": {
            "mode": "palette-classic"
          },
          "custom": {
            "axisCenteredZero": false,
            "axisColorMode": "text",
            "axisGridShow": true,
            "axisLabel": "",
            "axisPlacement": "hidden",
            "fillOpacity": 80,
            "gradientMode": "none",
            "hideFrom": {
              "legend": false,
              "tooltip": false,
              "viz": false
            },
            "lineWidth": 1,
            "scaleDistribution": {
              "type": "linear"
            },
            "thresholdsStyle": {
              "mode": "off"
            }
          },
          "mappings": [],
          "thresholds": {
            "mode": "absolute",
            "steps": [
              {
                "color": "green",
                "value": null
              },
              {
                "color": "red",
                "value": 80
              }
            ]
          },
          "unit": "ms"
        },
        "overrides": []
      },
      "gridPos": {
        "h": 10,
        "w": 12,
        "x": 12,
        "y": 50
      },
      "id": 9,
      "options": {
        "barRadius": 0,
        "barWidth": 0.97,
        "colorByField": "",
        "fullHighlight": false,
        "groupWidth": 0.7,
        "legend": {
          "calcs": [],
          "displayMode": "list",
          "placement": "bottom",
          "showLegend": true
        },
        "orientation": "horizontal",
        "showValue": "auto",
        "stacking": "none",
        "tooltip": {
          "mode": "single",
          "sort": "sort"
        },
        "xTickLabelRotation": 0,
        "xTickLabelSpacing": 0
      },
      "pluginVersion": "v10.1.0",
      "targets": [
        {
          "datasource": {
            "type": "prometheus",
            "uid": "${datasource}"
          },
          "editorMode": "code",
          "expr": "topk(10, (sum by(workload_index, policy_name) (increase(request_in_queue_duration_ms_sum{component_id=\"root.0.4\"}[$__range])) ) / ((sum by(workload_index, policy_name) (increase(request_in_queue_duration_ms_count{component_id=\"root.0.4\"}[$__range])) )) != 0)",
          "format": "time_series",
          "instant": true,
          "intervalFactor": 1,
          "legendFormat": "",
          "range": false,
          "refId": "A"
        }
      ],
      "title": "Durasi Permintaan dalam Antrian",
      "type": "barchart"
    },
    {
      "datasource": {
        "type": "prometheus",
        "uid": "${datasource}"
      },
      "description": "",
      "fieldConfig": {
        "defaults": {
          "color": {
            "mode": "palette-classic"
          },
          "custom": {
            "axisCenteredZero": false,
            "axisColorMode": "text",
            "axisLabel": "Laju Token",
            "axisPlacement": "auto",
            "barAlignment": 0,
            "drawStyle": "line",
            "fillOpacity": 10,
            "gradientMode": "none",
            "hideFrom": {
              "legend": false,
              "tooltip": false,
              "viz": false
            },
            "lineInterpolation": "linear",
            "lineWidth": 1,
            "pointSize": 5,
            "scaleDistribution": {
              "type": "linear"
            },
            "showPoints": "auto",
            "spanNulls": false,
            "stacking": {
              "group": "A",
              "mode": "none"
            },
            "thresholdsStyle": {
              "mode": "off"
            }
          },
          "mappings": [],
          "thresholds": {
            "mode": "absolute",
            "steps": [
              {
                "color": "green",
                "value": null
              },
              {
                "color": "red",
                "value": 80
              }
            ]
          },
          "unit": ""
        },
        "overrides": []
      },
      "gridPos": {
        "h": 8,
        "w": 12,
        "x": 0,
        "y": 60
      },
      "id": 12,
      "interval": "10s",
      "options": {
        "legend": {
          "calcs": [],
          "displayMode": "list",
          "placement": "bottom",
          "showLegend": true
        },
        "tooltip": {
          "mode": "single",
          "sort": "none"
        }
      },
      "pluginVersion": "v10.1.0",
      "targets": [
        {
          "datasource": {
            "type": "prometheus",
            "uid": "${datasource}"
          },
          "editorMode": "code",
          "expr": "sum by (policy_name) (rate(incoming_tokens_total{component_id=\"root.0.4\"}[$__rate_interval]))",
          "intervalFactor": 1,
          "range": true,
          "refId": "A"
        }
      ],
      "title": "Laju Token Masuk",
      "type": "timeseries"
    },
    {
      "datasource": {
        "type": "prometheus",
        "uid": "${datasource}"
      },
      "description": "",
      "fieldConfig": {
        "defaults": {
          "color": {
            "mode": "palette-classic"
          },
          "custom": {
            "axisCenteredZero": false,
            "axisColorMode": "text",
            "axisLabel": "Laju Token",
            "axisPlacement": "auto",
            "barAlignment": 0,
            "drawStyle": "line",
            "fillOpacity": 10,
            "gradientMode": "none",
            "hideFrom": {
              "legend": false,
              "tooltip": false,
              "viz": false
            },
            "lineInterpolation": "linear",
            "lineWidth": 1,
            "pointSize": 5,
            "scaleDistribution": {
              "type": "linear"
            },
            "showPoints": "auto",
            "spanNulls": false,
            "stacking": {
              "group": "A",
              "mode": "none"
            },
            "thresholdsStyle": {
              "mode": "off"
            }
          },
          "mappings": [],
          "thresholds": {
            "mode": "absolute",
            "steps": [
              {
                "color": "green",
                "value": null
              },
              {
                "color": "red",
                "value": 80
              }
            ]
          },
          "unit": ""
        },
        "overrides": []
      },
      "gridPos": {
        "h": 8,
        "w": 12,
        "x": 12,
        "y": 60
      },
      "id": 13,
      "interval": "10s",
      "options": {
        "legend": {
          "calcs": [],
          "displayMode": "list",
          "placement": "bottom",
          "showLegend": true
        },
        "tooltip": {
          "mode": "single",
          "sort": "none"
        }
      },
      "pluginVersion": "v10.1.0",
      "targets": [
        {
          "datasource": {
            "type": "prometheus",
            "uid": "${datasource}"
          },
          "editorMode": "code",
          "expr": "sum by (policy_name) (rate(accepted_tokens_total{component_id=\"root.0.4\"}[$__rate_interval]))",
          "intervalFactor": 1,
          "legendFormat": "Laju Token Diterima",
          "range": true,
          "refId": "A"
        },
        {
          "datasource": {
            "type": "prometheus",
            "uid": "${datasource}"
          },
          "expr": "sum(rate(rejected_tokens_total{component_id=\"root.0.4\",policy_name=\"workload-prioritization\"}[$__rate_interval]))",
          "intervalFactor": 1,
          "legendFormat": "Laju Token Ditolak",
          "refId": "B"
        }
      ],
      "title": "Perbandingan Laju Token Diterima vs Ditolak",
      "type": "timeseries"
    },
    {
      "datasource": {
        "type": "prometheus",
        "uid": "${datasource}"
      },
      "fieldConfig": {
        "defaults": {
          "color": {
            "mode": "thresholds"
          },
          "mappings": [],
          "noValue": "Tidak ada data",
          "thresholds": {
            "mode": "absolute",
            "steps": [
              {
                "color": "blue",
                "value": null
              }
            ]
          },
          "unit": "short"
        },
        "overrides": []
      },
      "gridPos": {
        "h": 10,
        "w": 8,
        "x": 0,
        "y": 68
      },
      "id": 14,
      "options": {
        "colorMode": "value",
        "graphMode": "area",
        "justifyMode": "center",
        "orientation": "horizontal",
        "reduceOptions": {
          "calcs": [
            "lastNotNull"
          ],
          "fields": "",
          "values": false
        },
        "textMode": "auto"
      },
      "pluginVersion": "10.0.9",
      "targets": [
        {
          "datasource": {
            "type": "prometheus",
            "uid": "${datasource}"
          },
          "editorMode": "code",
          "expr": "sum by (policy_name) (increase(incoming_tokens_total{component_id=\"root.0.4\"}[$__range]))",
          "instant": false,
          "intervalFactor": 1,
          "legendFormat": "{{ instance }} - {{ policy_name }}",
          "range": true,
          "refId": "A"
        }
      ],
      "title": "Total Token Masuk",
      "type": "stat"
    },
    {
      "datasource": {
        "type": "prometheus",
        "uid": "${datasource}"
      },
      "fieldConfig": {
        "defaults": {
          "color": {
            "mode": "thresholds"
          },
          "mappings": [],
          "noValue": "Tidak ada data",
          "thresholds": {
            "mode": "absolute",
            "steps": [
              {
                "color": "green",
                "value": null
              }
            ]
          },
          "unit": "short"
        },
        "overrides": []
      },
      "gridPos": {
        "h": 10,
        "w": 8,
        "x": 8,
        "y": 68
      },
      "id": 15,
      "options": {
        "colorMode": "value",
        "graphMode": "area",
        "justifyMode": "center",
        "orientation": "horizontal",
        "reduceOptions": {
          "calcs": [
            "lastNotNull"
          ],
          "fields": "",
          "values": false
        },
        "textMode": "auto"
      },
      "pluginVersion": "10.0.9",
      "targets": [
        {
          "datasource": {
            "type": "prometheus",
            "uid": "${datasource}"
          },
          "editorMode": "code",
          "expr": "sum by (policy_name) (increase(accepted_tokens_total{component_id=\"root.0.4\"}[$__range]))",
          "instant": false,
          "intervalFactor": 1,
          "legendFormat": "{{ instance }} - {{ policy_name }}",
          "range": true,
          "refId": "A"
        }
      ],
      "title": "Total Token Diterima",
      "type": "stat"
    },
    {
      "datasource": {
        "type": "prometheus",
        "uid": "${datasource}"
      },
      "fieldConfig": {
        "defaults": {
          "color": {
            "mode": "thresholds"
          },
          "mappings": [],
          "noValue": "Tidak ada data",
          "thresholds": {
            "mode": "absolute",
            "steps": [
              {
                "color": "red",
                "value": null
              }
            ]
          },
          "unit": "short"
        },
        "overrides": []
      },
      "gridPos": {
        "h": 10,
        "w": 8,
        "x": 16,
        "y": 68
      },
      "id": 16,
      "options": {
        "colorMode": "value",
        "graphMode": "area",
        "justifyMode": "center",
        "orientation": "horizontal",
        "reduceOptions": {
          "calcs": [
            "lastNotNull"
          ],
          "fields": "",
          "values": false
        },
        "textMode": "auto"
      },
      "pluginVersion": "10.0.9",
      "targets": [
        {
          "datasource": {
            "type": "prometheus",
            "uid": "${datasource}"
          },
          "editorMode": "code",
          "expr": "sum by (policy_name) (increase(rejected_tokens_total{component_id=\"root.0.4\"}[$__range]))",
          "instant": false,
          "intervalFactor": 1,
          "legendFormat": "{{ instance }} - {{ policy_name }}",
          "range": true,
          "refId": "A"
        }
      ],
      "title": "Total Token Ditolak",
      "type": "stat"
    }
  ],
  "refresh": "5s",
  "schemaVersion": 38,
  "style": "dark",
  "tags": [],
  "templating": {
    "list": [
      {
        "hide": 0,
        "includeAll": false,
        "label": "Sumber Data",
        "multi": false,
        "name": "datasource",
        "options": [],
        "query": "prometheus",
        "refresh": 1,
        "regex": "",
        "skipUrlSync": false,
        "type": "datasource"
      }
    ]
  },
  "time": {
    "from": "now-15m",
    "to": "now"
  },
  "timepicker": {},
  "timezone": "browser",
  "title": "Ringkasan Kebijakan - workload-prioritization",
  "version": 1,
  "weekStart": ""
}

Dasbor adalah sebagai berikut.

image