All Products
Search
Document Center

:Troubleshoot inaccessible websites on ECS instances

Last Updated:Jun 17, 2026

This topic shows you how to troubleshoot inaccessible websites that run on an ECS instance.

Symptoms

You may encounter the following issues when you try to access a website that runs on an ECS instance:

  • You receive a message, such as "No ICP filing or not connected" or "The website content does not match the ICP filing information".

  • The browser returns an HTTP status code, such as 403, 404, 502, or 503.

  • You cannot access a newly created website.

  • A website that was running correctly suddenly becomes inaccessible.

  • You cannot access a website on an ECS instance through a Server Load Balancer (SLB) instance.

  • You cannot access a website accelerated by Alibaba Cloud CDN.

  • You cannot access a website that is protected by Web Application Firewall (WAF).

Causes

A website on an ECS instance can be inaccessible for many reasons. This section lists common causes. The actual cause depends on your troubleshooting results.

  • TCP port 80 is unavailable.

  • The web service is unavailable.

  • The website does not have an ICP filing.

  • Problems with website resources or backend services.

  • The website was not built according to standard procedures.

  • A problem with the origin server.

Note

Website access issues can have many causes. For more information, see Troubleshooting and guidelines for ECS instance access exceptions.

Troubleshooting

Select one of the following methods to troubleshoot the issue.

Troubleshoot by flowchart

You can follow the steps in the flowchart to troubleshoot the issue.
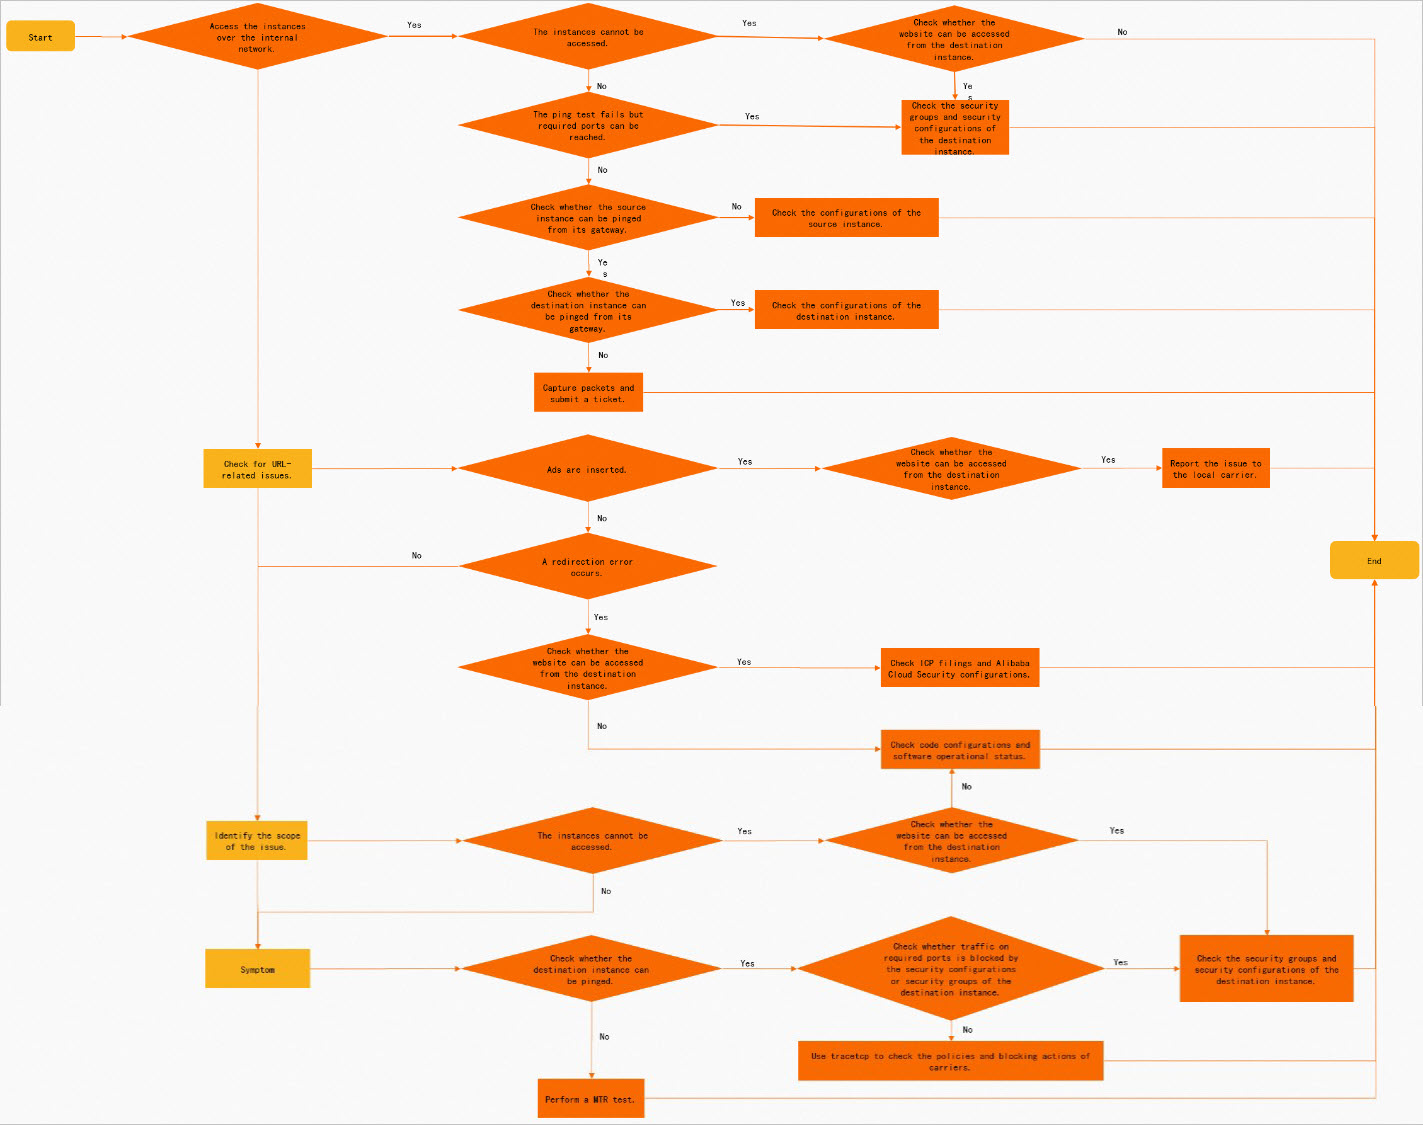
20230119184601

Solutions by symptom

Find the solution for each symptom listed below.

  • Message: "No ICP filing or not connected" or "The website content does not match the ICP filing information".

    You cannot enable website access until you obtain an ICP filing for the website's IP address or domain name. For more information, see General ICP filing.

  • The browser returns an HTTP status code, such as 403, 404, 502, or 503.

    When the browser returns a status code, it usually indicates that the network connection between the client and the server is stable, but points to a problem with website resources or backend services.

  • Unable to access a newly created website.

    Follow the standard procedure to build your website. For more information about the website building procedure, see Quick start for building a website.

  • A website that was running correctly suddenly becomes inaccessible.

    Check your web service and backend database to ensure they are running. If a service is not running, check its logs for error messages and use them to fix the issue.

    Note
    • Web service log files are typically named access.log or error.log. For more information, visit the official website for your web service.

    • Issues with backend services, such as PHP, Java, Tomcat, or the database, can also make the website inaccessible. In this case, contact your website administrator for help.

  • Unable to access a website on an ECS instance through a Server Load Balancer (SLB) instance.

    If you use a Server Load Balancer (SLB) instance with your ECS instance, the issue may be due to incorrect listener settings on the SLB instance. For more information, see Cannot access a website on an ECS instance by using an SLB instance.

  • Unable to access a website after it is accelerated by Alibaba Cloud CDN.

    First, determine whether the issue is with the origin server. For more information, see Troubleshoot website access failures after Alibaba Cloud CDN is enabled.

  • Unable to access a website that is protected by Web Application Firewall (WAF).

    First, determine whether the issue is with the origin server, and then check if WAF incorrectly blocked a request. For more information, see Cannot access a website protected by WAF.

Solutions

This section describes solutions for issues caused by an unavailable TCP port 80 or web service.

Linux: Port 80 and web service

Note

The following steps use a CentOS 7 instance as an example. Operations may vary depending on your operating system.

TCP port 80 is unavailable

  1. Connect to the Linux instance.

    For more information, see Connection methods.

  2. Run the following command to check whether a service is listening on TCP port 80:

    netstat -an | grep 80

    If the command returns either of the following outputs, a web service is running and listening on TCP port 80. If you receive a different output or an error, see The web service is unavailable for the next steps.

    tcp        0      0 0.0.0.0:80              0.0.0.0:*               LISTEN # Listening on all network interfaces
    tcp        0      0 127.0.0.1:80            0.0.0.0:*               LISTEN # Listening on the local host
    Note

    Listening on 127.0.0.1 prevents external access to the web service. You must change the configuration to listen on all network interfaces.

  3. Verify that traffic is allowed on TCP port 80 and that the connection is stable.

    1. Check whether the security group of the instance allows traffic on TCP port 80. If not, add a security group rule. For more information, see Add a security group rule.

    2. Check whether the firewall of the instance's operating system is enabled. If it is enabled, we recommend that you disable it and use security groups instead. For more information, see Manage the system firewall on a Linux instance.

    3. Use the telnet and traceroute commands to test connectivity on TCP port 80. For more information, see Troubleshoot port connectivity issues when the server can be pinged.

  4. Check whether the ECS instance has sufficient bandwidth.

    For more information, see Query and analyze the system load of a Linux instance.

    If the bandwidth is insufficient, upgrade the instance bandwidth. For more information, see Modify bandwidth configurations.

The web service is unavailable

  1. Connect to the Linux instance.

    For more information, see Connection methods.

  2. Check the web service logs.

    • Run the following command to view the Apache error logs.

      • CentOS or Alinux:

        less /var/log/httpd/error_log
      • Ubuntu:

        less /var/log/apache2/error.log
    • Run the following command to view the Nginx error logs.

      less /var/log/nginx/error_log
  3. Run the top command to check the running status of the instance.

    Check for abnormal processes. The following code block shows a sample command output.

    top - 16:03:47 up 21:22,  2 users,  load average: 0.01, 0.02, 0.05
    Tasks: 101 total,   1 running, 100 sleeping,   0 stopped,   0 zombie
    %Cpu(s):  0.1 us,  0.2 sy,  0.0 ni, 99.7 id,  0.0 wa,  0.0 hi,  0.0 si,  0.0 st
    KiB Mem :  7732780 total,  6633068 free,   208044 used,   891668 buff/cache
    KiB Swap:        0 total,        0 free,        0 used.  7276512 avail Mem
    
      PID USER      PR  NI    VIRT    RES    SHR S  %CPU %MEM     TIME+ COMMAND
     1685 root      10 -10  140444  18232  11472 S   1.0  0.2  18:40.04 AliYunDun
     1371 root      10 -10   42320   4492   2988 S   0.3  0.1   0:46.65 AliYunDunUpdate
        1 root      20   0  191048   4084   2612 S   0.0  0.1   0:01.74 systemd
        2 root      20   0       0      0      0 S   0.0  0.0   0:00.00 kthreadd
        4 root       0 -20       0      0      0 S   0.0  0.0   0:00.00 kworker/0:0H
        5 root      20   0       0      0      0 S   0.0  0.0   0:00.35 kworker/u8:0
        6 root      20   0       0      0      0 S   0.0  0.0   0:00.02 ksoftirqd/0
        7 root      rt   0       0      0      0 S   0.0  0.0   0:00.00 migration/0
        8 root      20   0       0      0      0 S   0.0  0.0   0:00.00 rcu_bh
        9 root      20   0       0      0      0 S   0.0  0.0   0:10.57 rcu_sched

    The load average values of 0.01, 0.02, and 0.05 represent the average system load over the last 1, 5, and 15 minutes, respectively. As a general rule, if the load average divided by the number of logical CPUs is greater than 5, the system may be overloaded. This threshold can vary based on your server's CPU power and workload. If the system is overloaded, identify the process ID (PID) with a high %CPU value. Then, locate the process name in the COMMAND column and take action based on your system's needs.

  4. View instance monitoring information in the console.

    For more information, see View instance monitoring information.

  5. Run the following command to check whether there are too many TCP connections on port 80 of the instance:

    netstat -anp | grep ':80 ' | grep tcp

    The following is a sample response:

    xxx@linux:~# netstat -anp |grep 80 |grep tcp
    tcp        0      0 0.0.0.0:80              0.0.0.0:*               LISTEN      2551/nginx: master
    tcp        0      0 xxx.xxx.xxx.174:36646   xxx.xxx.xxx.70:80       TIME_WAIT   -
    tcp        0      0 xxx.xxx.xxx.174:51426   xxx.xxx.xxx.70:80       TIME_WAIT   -
    tcp        0      0 xxx.xxx.xxx.174:34034   xxx.xxx.xxx.70:80       TIME_WAIT   -
    tcp        0      0 xxx.xxx.xxx.174:42812   xxx.xxx.xxx.xxx:80      ESTABLISHED 1633/AliYunDun
    tcp6       0      0 :::80                   :::*                    LISTEN      2551/nginx: master
    xxx@linux:~# netstat -anp |grep 80 |grep tcp |wc -l
    6
  6. Run the following command to count all TCP connections:

    netstat -anp |grep tcp |wc -l
  7. Compare the total number of TCP connections with the value of the net.ipv4.tcp_max_tw_buckets parameter in the /etc/sysctl.conf file. If the total number of TCP connections exceeds this value, perform the following steps:

    1. Run the vi /etc/sysctl.conf command to open the /etc/sysctl.conf file, and check the value of the net.ipv4.tcp_max_tw_buckets parameter.

      vm.swappiness = 0
      kernel.sysrq = 1
      
      net.ipv4.neigh.default.gc_stale_time = 120
      
      # see details in https://www.alibabacloud.com/help/knowledge_detail/39428.html
      net.ipv4.conf.all.rp_filter = 0
      net.ipv4.conf.default.rp_filter = 0
      net.ipv4.conf.default.arp_announce = 2
      net.ipv4.conf.lo.arp_announce = 2
      net.ipv4.conf.all.arp_announce = 2
      
      # see details in https://www.alibabacloud.com/help/knowledge_detail/41334.html
      net.ipv4.tcp_max_tw_buckets = 5000
      net.ipv4.tcp_syncookies = 1
      net.ipv4.tcp_max_syn_backlog = 1024
      net.ipv4.tcp_synack_retries = 2
      net.ipv4.tcp_slow_start_after_idle = 0

      If you confirm that the number of TCP connections is high and likely to exceed the limit, increase the value of the net.ipv4.tcp_max_tw_buckets parameter based on your requirements.

    2. Run the sysctl -p command to apply the new configuration.

Windows: Port 80 and web service

Note

The following steps use an instance that runs Windows Server 2012 R2 as an example. The actual operations may vary based on your operating system.

TCP port 80 is unavailable

  1. Connect to the Windows instance.

    For more information, see Connection methods.

  2. Open Command Prompt.

    1. Click the Start icon 开始图标 in the lower-left corner of the desktop, and then click the Search icon 搜索图标.

    2. In the search box, enter cmd.

    3. Click Command Prompt.

      The Command Prompt window opens.

      Microsoft Windows [Version 6.3.9600]
      (c) 2013 Microsoft Corporation. All rights reserved.
      
      C:\Users\Administrator>
  3. Run the following command to check whether a service is listening on TCP port 80:

    netstat -ano | findstr :80

    If the command returns either of the following outputs, a web service is running and listening on TCP port 80. If you receive a different output or an error, see The web service is unavailable for the next steps.

    TCP    0.0.0.0:80           0.0.0.0:0              LISTENING       1172 # Listening on all network interfaces
    TCP    127.0.0.1:80         0.0.0.0:0              LISTENING       1172 # Listening on the local host
    Note

    If a service listens only on the local host (127.0.0.1), external clients cannot access the web service. Run the netsh http delete iplisten ipaddress=127.0.0.1:80 command to reconfigure the service to listen on all network interfaces.

  4. Verify that traffic is allowed on TCP port 80 and that the connection is stable.

    1. Check whether the security group of the instance allows traffic on port 80. If not, add a security group rule. For more information, see Add a security group rule.

    2. Check whether the firewall of the instance's operating system is enabled. If it is enabled, we recommend that you disable it and use security groups instead. For more information, see Configure firewall policies for a Windows instance.

    3. Use the telnet and tracert commands to test connectivity on port 80. For more information, see Troubleshoot port connectivity issues when the server can be pinged.

  5. Check whether the ECS instance has sufficient bandwidth.

    For more information, see Troubleshoot high or full bandwidth and CPU usage on Windows instances.

    If the bandwidth is insufficient, upgrade the instance bandwidth. For more information, see Modify bandwidth configurations.

The web service is unavailable

  1. Connect to the Windows instance.

    For more information, see Connection methods.

  2. Check the web service logs.

    • Method 1: Browse the log folder.

      For Windows Server 2008 R2 and later, the log path is C:\inetpub\logs\LogFiles.

    • Method 2: Use Internet Information Services (IIS) Manager.

      1. Choose 开始图标 > Windows Administrative Tools > Internet Information Services (IIS) Manager.

      2. On the homepage for your website, double-click Logging in the IIS section. Then, in the Actions pane, click Browse.

      3. On the Logging page, you can modify the log storage path as needed. Copy the path, paste it into File Explorer, and press Enter.

        You can then view the log folder in File Explorer.

  3. Use Task Manager to check the instance's status and look for abnormal processes.

    1. Right-click the desktop and select Task Manager.

    2. Click the Processes tab.

      You can view the CPU and memory usage of processes in Task Manager to identify abnormal processes.

  4. View instance monitoring information in the console.

    For more information, see View instance monitoring information.

  5. Check whether there are too many TCP connections on port 80 of the instance.

    1. Open Command Prompt.

      1. Click the Start icon 开始图标 in the lower-left corner of the desktop, and then click the Search icon 搜索图标.

      2. In the search box, enter cmd.

      3. Click Command Prompt.

        The Command Prompt window opens.

        Microsoft Windows [Version 6.3.9600]
        (c) 2013 Microsoft Corporation. All rights reserved.
        
        C:\Users\Administrator>
  6. Run the following commands in sequence to count the TCP connections in different states:

    netstat -n |find /i "time_wait" /c
    netstat -n |find /i "close_wait" /c
    netstat -n |find /i "established" /c

    By default, Windows allows 16,384 dynamic ports, ranging from 49152 to 65535. If the number of connections in the CLOSE_WAIT state approaches this limit, many connections are not being released properly. If so, modify the registry to reduce the TcpTimedWaitDelay duration as described in the next step.

    C:\Users\Administrator>netstat -n |find /i "time_wait" /c
    10
    
    C:\Users\Administrator>netstat -n |find /i "close_wait" /c
    0
    
    C:\Users\Administrator>netstat -n |find /i "established" /c
    7
    
    C:\Users\Administrator>
  7. Open Registry Editor.

    1. Click the Start icon 开始图标 in the lower-left corner of the desktop, and then click the Search icon 搜索图标.

    2. In the search box, enter regedit.

    3. Click regedit.

      The Registry Editor window opens.

  8. In Registry Editor, navigate to HKEY_LOCAL_MACHINE\SYSTEM\CurrentControlSet\services\Tcpip\Parameters. Set the value of the TcpTimedWaitDelay key to a decimal value of 30.

    If the TcpTimedWaitDelay entry does not exist, create the registry entry and then modify its value data. For example, if the TcpTimedWaitDelay entry does not exist, perform the following steps:

    1. In the HKEY_LOCAL_MACHINE\SYSTEM\CurrentControlSet\services\Tcpip\Parameters path, right-click an empty area and select New > DWORD (32-bit) Value.

    2. Enter TcpTimedWaitDelay and press Enter.

    3. Right-click the TcpTimedWaitDelay key and click Modify.

    4. In the dialog box that appears, select Decimal and set the Value data to 30.

    5. Click OK.