Before using Managed Service for OpenTelemetry, you must activate the service and retrieve the data reporting configurations.
Before you begin
Activate Managed Service for OpenTelemetry.
On the Managed Service for OpenTelemetry product homepage, activate Managed Service for OpenTelemetry as prompted.
Before connecting your applications to Managed Service for OpenTelemetry, retrieve the data reporting configurations.
Enable ports and domain names for non-Alibaba Cloud applications
Before connecting non-Alibaba Cloud applications to Managed Service for OpenTelemetry, enable the ports and domain names listed below.
Ports
8090 (OpenTelemetry gRPC)
80 (OpenTelemetry HTTP/Jaeger HTTP)
1883 (Jaeger gRPC)
Domain names
Region | Internet | Virtual private cloud (VPC) |
China (Hangzhou) | tracing-analysis-dc-hz.aliyuncs.com | tracing-analysis-dc-hz-internal.aliyuncs.com |
China (Shanghai) | tracing-analysis-dc-sh.aliyuncs.com | tracing-analysis-dc-sh-internal.aliyuncs.com |
China (Qingdao) | tracing-analysis-dc-qd.aliyuncs.com | tracing-analysis-dc-qd-internal.aliyuncs.com |
China (Beijing) | tracing-analysis-dc-bj.aliyuncs.com | tracing-analysis-dc-bj-internal.aliyuncs.com |
China (Zhangjiakou) | tracing-analysis-dc-zb.aliyuncs.com | tracing-analysis-dc-zb-internal.aliyuncs.com |
China (Hohhot) | tracing-cn-huhehaote.arms.aliyuncs.com | tracing-cn-huhehaote-internal.arms.aliyuncs.com |
China (Ulanqab) | tracing-cn-wulanchabu.arms.aliyuncs.com | tracing-cn-wulanchabu-internal.arms.aliyuncs.com |
China (Shenzhen) | tracing-analysis-dc-sz.aliyuncs.com | tracing-analysis-dc-sz-internal.aliyuncs.com |
China (Heyuan) | tracing-cn-heyuan.arms.aliyuncs.com | tracing-cn-heyuan-internal.arms.aliyuncs.com |
China (Guangzhou) | tracing-cn-guangzhou.arms.aliyuncs.com | tracing-cn-guangzhou-internal.arms.aliyuncs.com |
China (Chengdu) | tracing-cn-chengdu.arms.aliyuncs.com | tracing-cn-chengdu-internal.arms.aliyuncs.com |
China (Hong Kong) | tracing-analysis-dc-hk.aliyuncs.com | tracing-analysis-dc-hk-internal.aliyuncs.com |
Japan (Tokyo) | tracing-analysis-dc-jp.aliyuncs.com | tracing-analysis-dc-jp-internal.aliyuncs.com |
Singapore | tracing-analysis-dc-sg.aliyuncs.com | tracing-analysis-dc-sg-internal.aliyuncs.com |
Malaysia (Kuala Lumpur) | tracing-ap-southeast-3.arms.aliyuncs.com | tracing-ap-southeast-3-internal.arms.aliyuncs.com |
Indonesia (Jakarta) | tracing-analysis-dc-indonesia.aliyuncs.com | tracing-analysis-dc-indonesia-internal.aliyuncs.com |
Germany (Frankfurt) | tracing-analysis-dc-frankfurt.aliyuncs.com | tracing-analysis-dc-frankfurt-internal.aliyuncs.com |
UK (London) | tracing-analysis-dc-lundun.aliyuncs.com | tracing-analysis-dc-lundun-internal.aliyuncs.com |
US (Virginia) | tracing-us-east-1.arms.aliyuncs.com | tracing-us-east-1-internal.arms.aliyuncs.com |
US (Silicon Valley) | tracing-analysis-dc-usw.aliyuncs.com | None |
SAU (Riyadh - Partner Region) | tracing-me-central-1.arms.aliyuncs.com | tracing-me-central-1-internal.arms.aliyuncs.com |
Connect to Managed Service for OpenTelemetry and authenticate clients
Managed Service for OpenTelemetry can integrate with the open-source OpenTelemetry SDK/Collector, Jaeger SDK/Agent, Zipkin, and Skywalking clients. This section describes the regions and endpoints supported by Managed Service for OpenTelemetry and the data reporting protocols supported by different ports. This section also describes how to obtain an authentication token.
Directly report data
Supported Alibaba Cloud regions and endpoints
If your application is deployed in an Alibaba Cloud production environment, select a private endpoint. Otherwise, select a public endpoint.
Region | Region ID | Private endpoint | Public endpoint |
China (Hangzhou) | cn-hangzhou | tracing-analysis-dc-hz-internal.aliyuncs.com | tracing-analysis-dc-hz.aliyuncs.com |
China (Shanghai) | cn-shanghai | tracing-analysis-dc-sh-internal.aliyuncs.com | tracing-analysis-dc-sh.aliyuncs.com |
China (Qingdao) | cn-qingdao | tracing-analysis-dc-qd-internal.aliyuncs.com | tracing-analysis-dc-qd.aliyuncs.com |
China (Beijing) | cn-beijing | tracing-analysis-dc-bj-internal.aliyuncs.com | tracing-analysis-dc-bj.aliyuncs.com |
China (Zhangjiakou) | cn-zhangjiakou | tracing-analysis-dc-zb-internal.aliyuncs.com | tracing-analysis-dc-zb.aliyuncs.com |
China (Hohhot) | cn-huhehaote | tracing-cn-huhehaote-internal.arms.aliyuncs.com | tracing-cn-huhehaote.arms.aliyuncs.com |
China (Ulanqab) | cn-wulanchabu | tracing-cn-wulanchabu-internal.arms.aliyuncs.com | tracing-cn-wulanchabu.arms.aliyuncs.com |
China (Shenzhen) | cn-shenzhen | tracing-analysis-dc-sz-internal.aliyuncs.com | tracing-analysis-dc-sz.aliyuncs.com |
China (Heyuan) | cn-heyuan | tracing-cn-heyuan-internal.arms.aliyuncs.com | tracing-cn-heyuan.arms.aliyuncs.com |
China (Guangzhou) | cn-guangzhou | tracing-cn-guangzhou-internal.arms.aliyuncs.com | tracing-cn-guangzhou.arms.aliyuncs.com |
China (Chengdu) | cn-chengdu | tracing-cn-chengdu-internal.arms.aliyuncs.com | tracing-cn-chengdu.arms.aliyuncs.com |
China (Hong Kong) | cn-hongkong | tracing-analysis-dc-hk-internal.aliyuncs.com | tracing-analysis-dc-hk.aliyuncs.com |
Japan (Tokyo) | ap-northeast-1 | tracing-analysis-dc-jp-internal.aliyuncs.com | tracing-analysis-dc-jp.aliyuncs.com |
Singapore | ap-southeast-1 | tracing-analysis-dc-sg-internal.aliyuncs.com | tracing-analysis-dc-sg.aliyuncs.com |
Malaysia (Kuala Lumpur) | ap-southeast-3 | tracing-ap-southeast-3-internal.arms.aliyuncs.com | tracing-ap-southeast-3.arms.aliyuncs.com |
Indonesia (Jakarta) | ap-southeast-5 | tracing-analysis-dc-indonesia-internal.aliyuncs.com | tracing-analysis-dc-indonesia.aliyuncs.com |
Germany (Frankfurt) | eu-central-1 | tracing-analysis-dc-frankfurt-internal.aliyuncs.com | tracing-analysis-dc-frankfurt.aliyuncs.com |
UK (London) | eu-west-1 | tracing-analysis-dc-lundun-internal.aliyuncs.com | tracing-analysis-dc-lundun.aliyuncs.com |
US (Silicon Valley) | us-west-1 | tracing-analysis-dc-usw-internal.aliyuncs.com | tracing-analysis-dc-usw.aliyuncs.com |
US (Virginia) | us-east-1 | tracing-us-east-1-internal.arms.aliyuncs.com | tracing-us-east-1.arms.aliyuncs.com |
SAU (Riyadh - Partner Region) | me-central-1 | tracing-me-central-1-internal.arms.aliyuncs.com | tracing-me-central-1.arms.aliyuncs.com |
Supported protocols
Port number | Protocol | Description |
80 |
| Protocols are distinguished by URL suffixes.
|
443 |
| Protocols are distinguished by URL suffixes.
|
1883 |
| None |
8000 | Skywalking v8 gRPC | None |
8090 | OpenTelemetry gRPC | None |
Obtain an authentication token
After activating Managed Service for OpenTelemetry, obtain a token for authenticating the reported data. The following section describes how to obtain the token in a new or old console of Managed Service for OpenTelemetry.
New console
Log on to the Managed Service for OpenTelemetry console. In the left-side navigation pane, click Integration Center.
In the Open Source Frameworks section, click the OpenTelemetry card or the card that you want to manage.
In the panel that appears, retrieve the token as prompted.
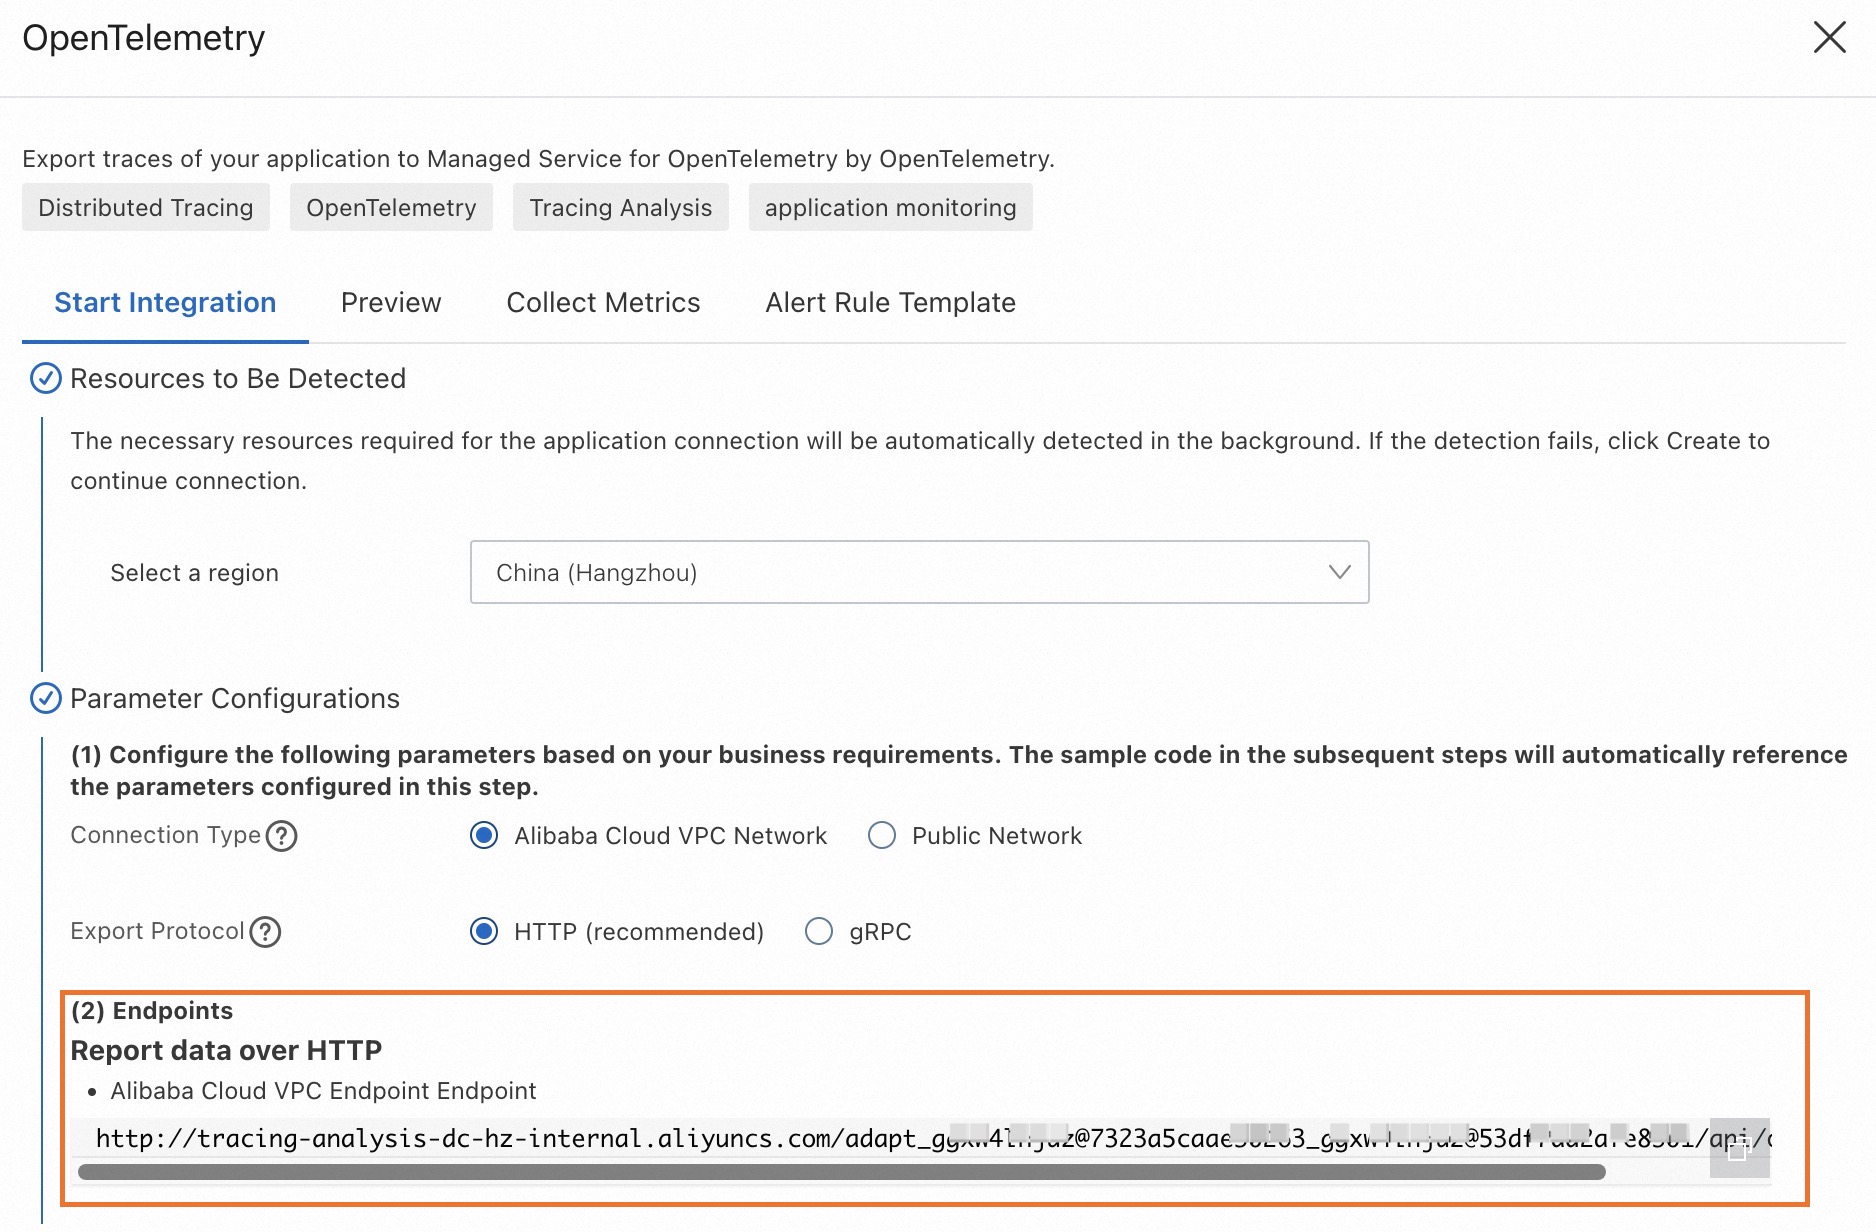 Note
NoteIf you use OpenTelemetry HTTP, Zipkin HTTP, or Jaeger HTTP, the token is contained in an HTTP URL.
If you use SkyWalking gRPC, OpenTelemetry gRPC, or Jaeger gRPC, the system specifies
Authentication=<token>in themetadataof gRPC, then sends the metadata to the server for authentication.
Old console
Log on to the Managed Service for OpenTelemetry console.
In the left-side navigation pane, click Cluster Configurations. On the page that appears, click the Access point information tab.
At the top of the page, select a region. Then, turn on the Show Token switch in the Cluster Information section.
In the Client section, select OpenTelemetry or a client that you want to use to collect trace data.
In the Related Information column, retrieve the endpoint.
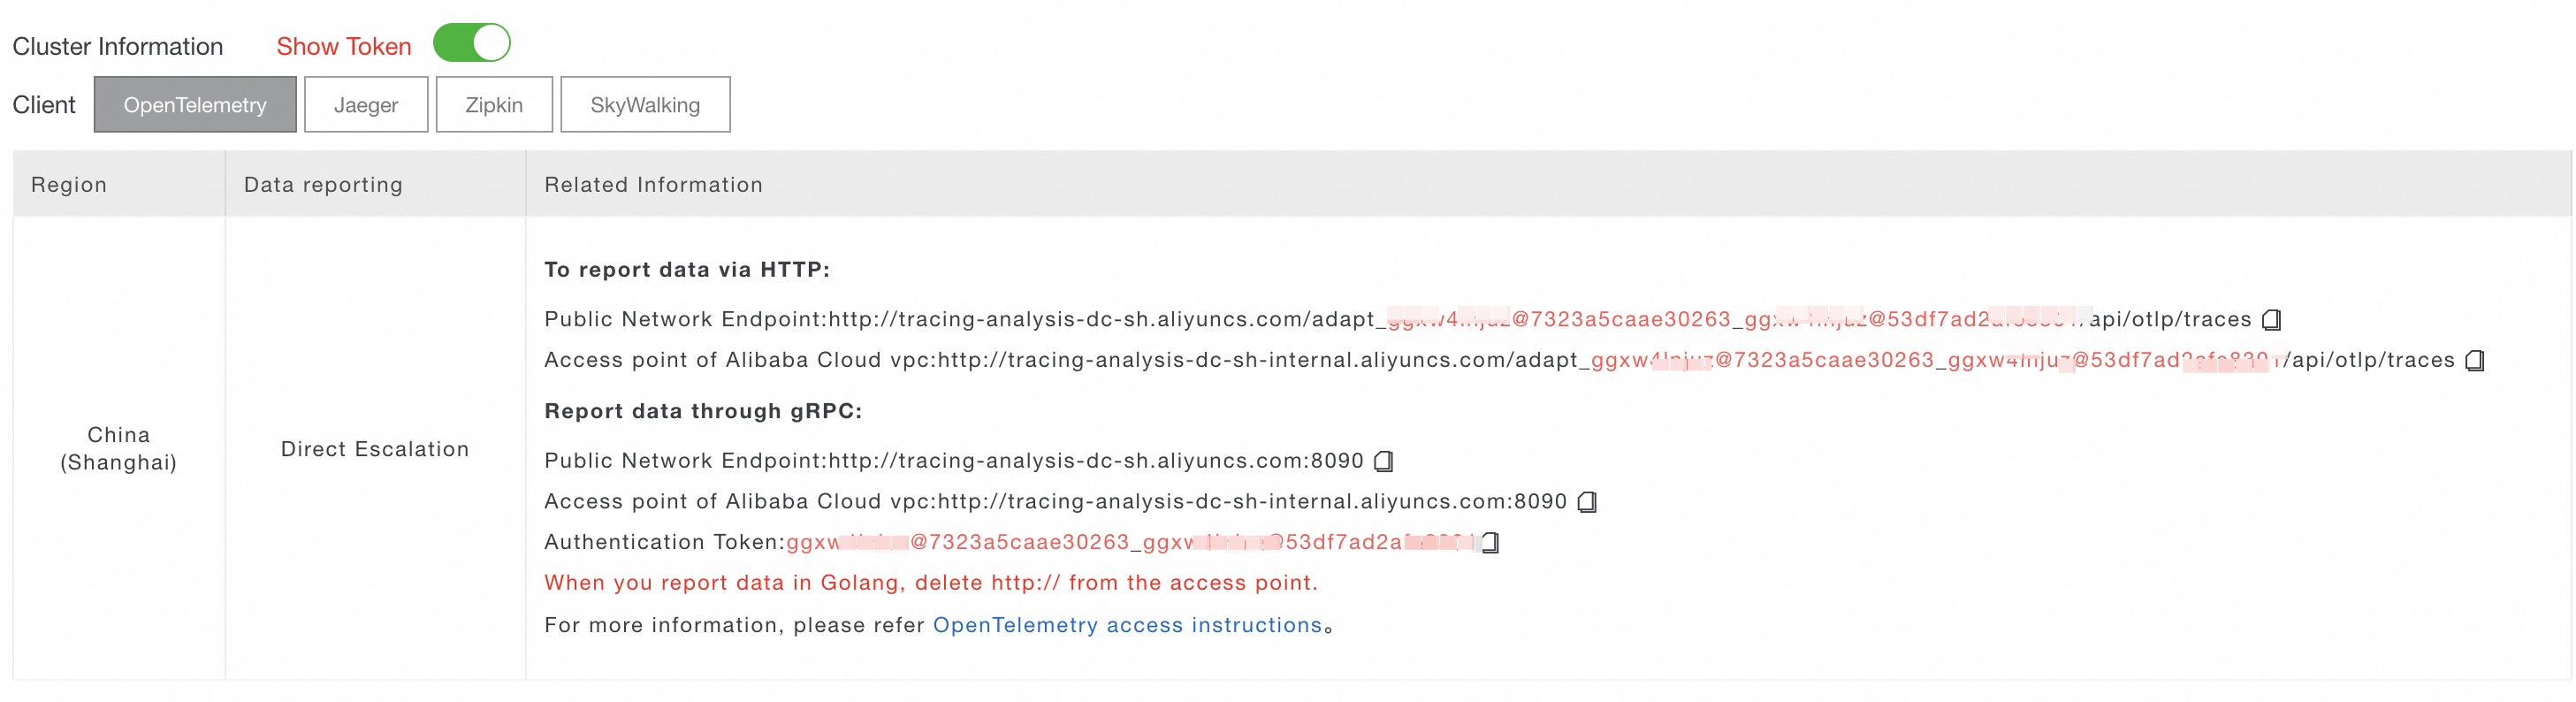 Note
NoteIf you use OpenTelemetry HTTP, Zipkin HTTP, or Jaeger HTTP, the token is contained in an HTTP URL.
If you use SkyWalking gRPC, OpenTelemetry gRPC, or Jaeger gRPC, the system specifies
Authentication=<token>in themetadataof gRPC, then sends the metadata to the server for authentication.