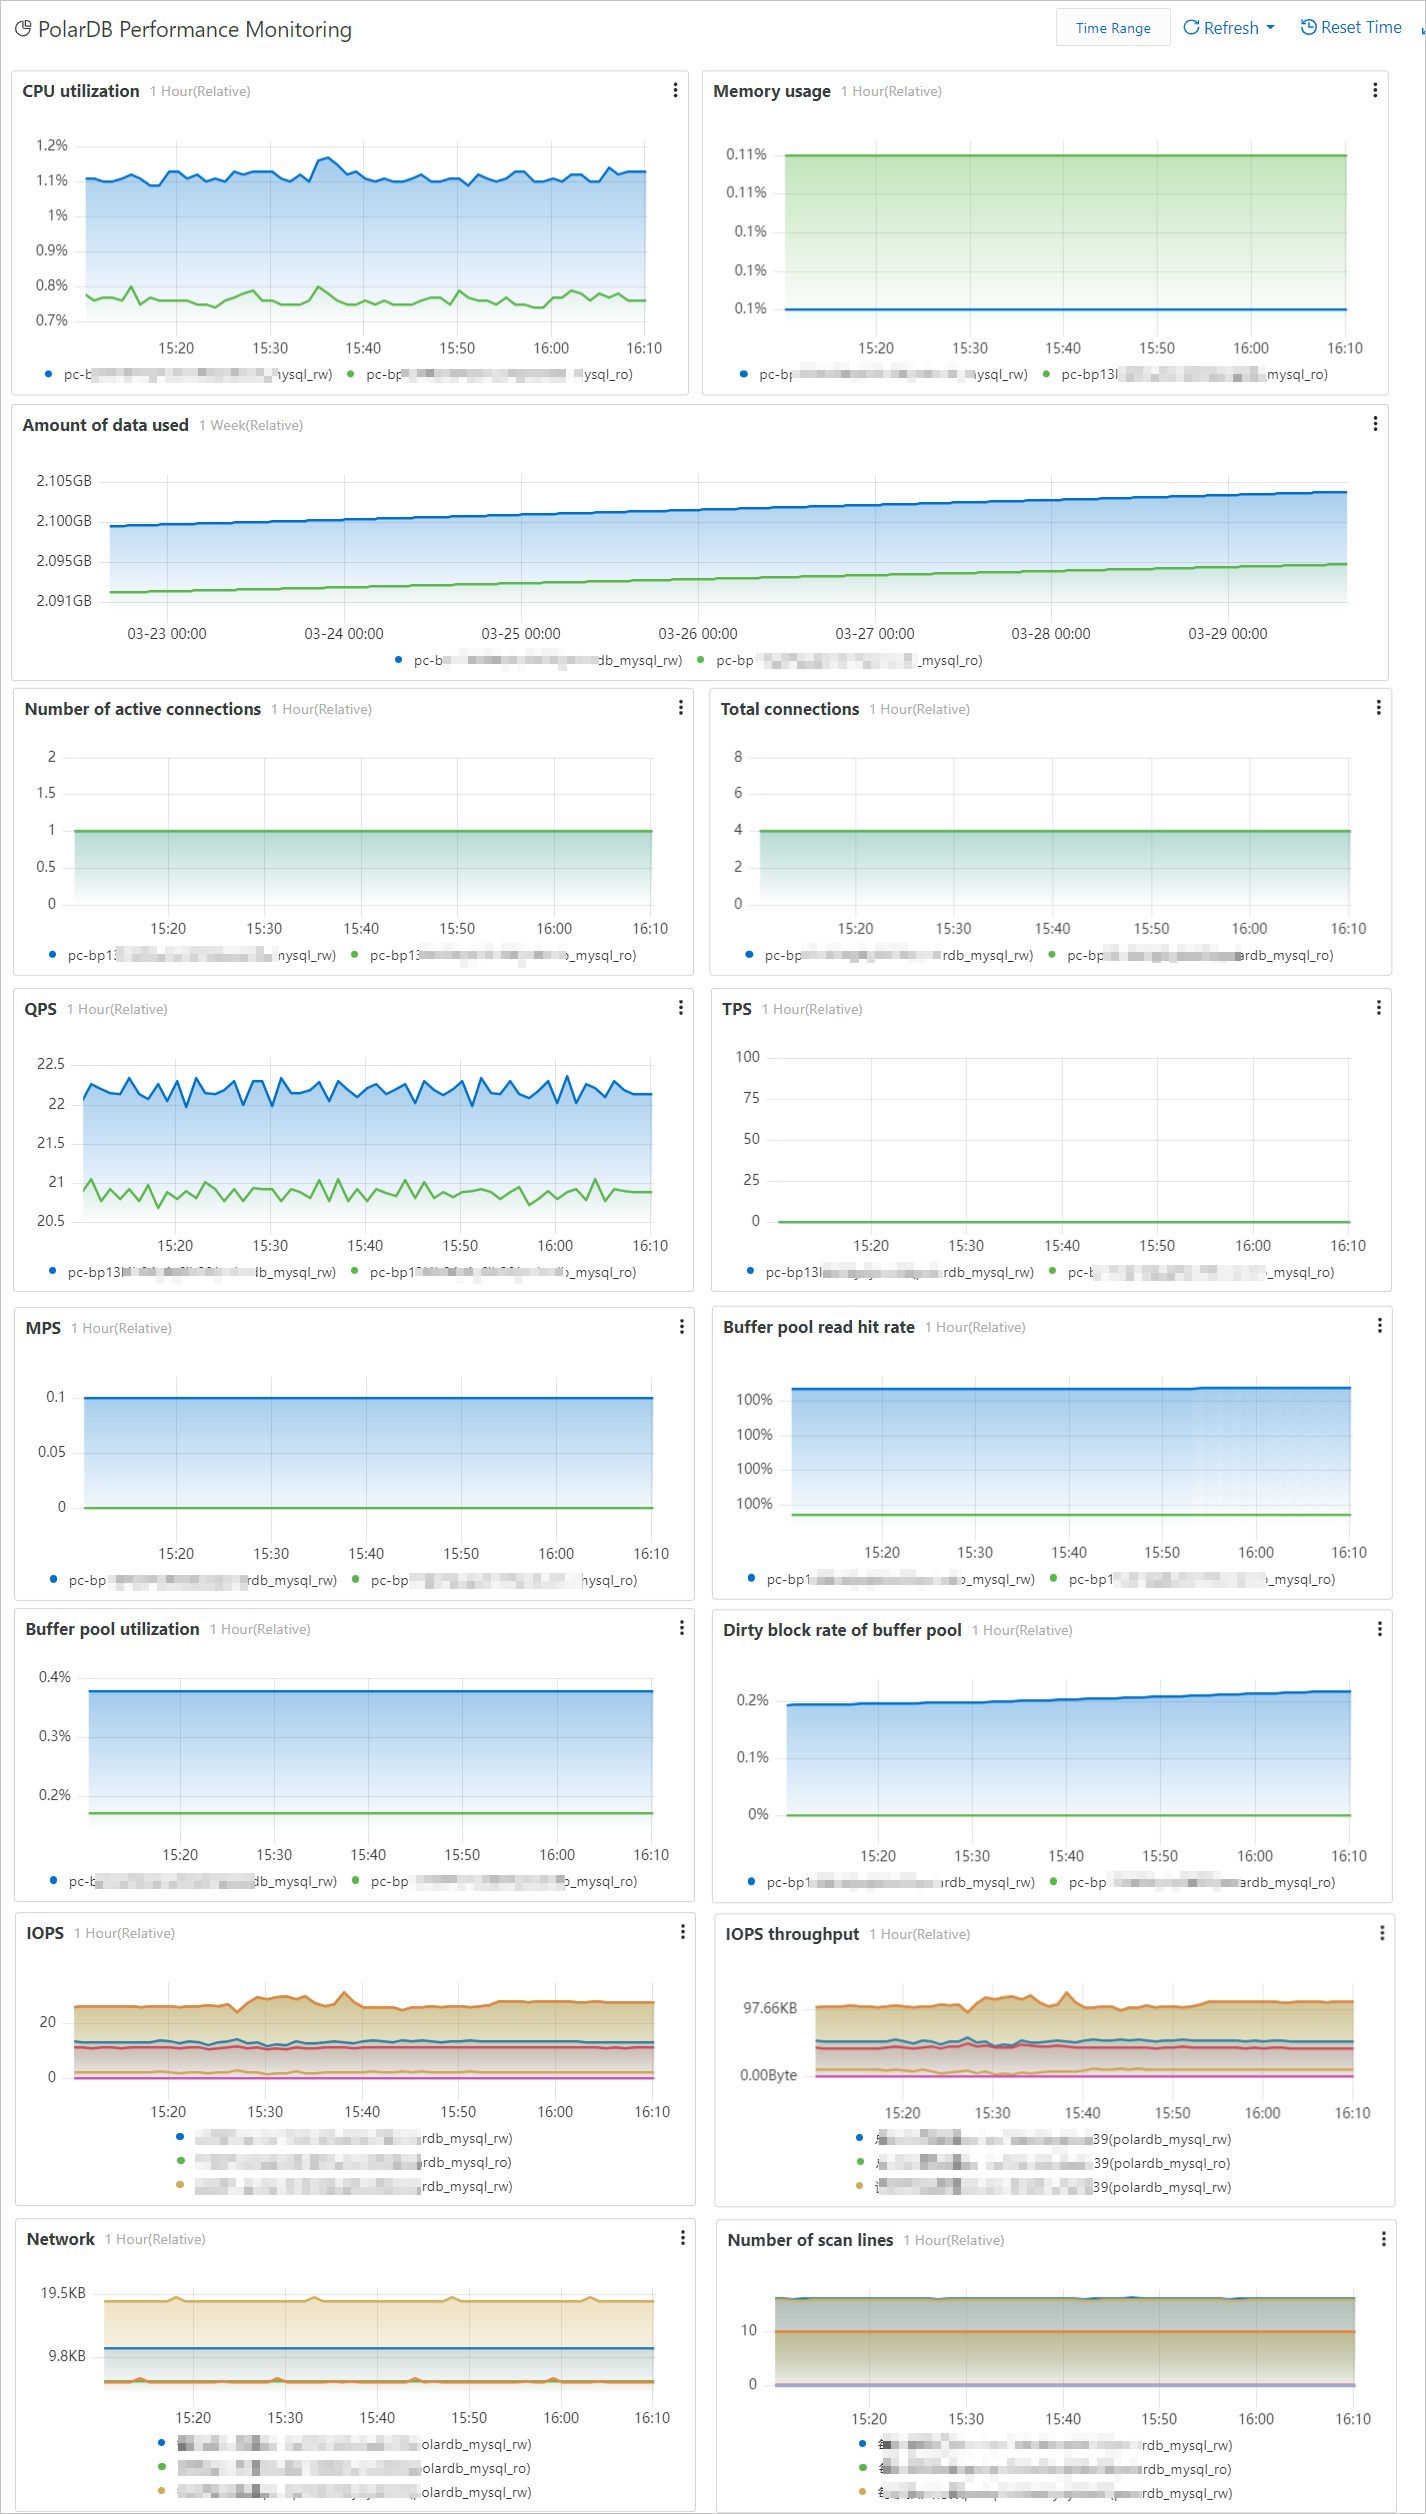
Performance monitoring dashboards show real-time metrics for PolarDB for MySQL clusters, helping you monitor cluster health and pinpoint O&M issues with fine-grained data.
Prerequisites
The data collection feature for performance metrics is enabled for a PolarDB for MySQL cluster. For more information, see Enable data collection.Entry Point
- Log on to the Log Service console.
- In the Log Application section, on the Cloud Product Lens tab, click CloudLens for PolarDB.
- In the navigation pane on the left, click Performance Monitoring.
Data details
The PolarDB Performance Monitoring page shows performance metrics for a PolarDB for MySQL cluster over a specified time range, including CPU usage, memory usage, data volume, active connections, total connections, queries per second (QPS), transactions per second (TPS), MPS, buffer pool read hit rate, buffer pool usage, buffer pool dirty ratio, and input/output operations per second (IOPS).