You can use a histogram to visualize the distribution of continuous data and the frequency distribution of data. This helps you understand data features in an efficient manner. This topic describes how to configure a histogram. This topic also provides examples of histograms.
Overview
A histogram consists of vertical stripes or line segments that have different heights to show the distribution of data. The vertical stripes or line segments in a histogram are plotted based on the frequency, quantity, or other statistics of data, and are arranged along the x-axis. Compared with column charts, histograms are more statistically significant. The following list describes the differences between histograms and column charts:
A histogram displays the distribution of data. A column chart displays the differences between various categories of data.
The x-axis in a histogram displays numeric data, such as length, weight, and time values. The x-axis in a column chart displays categorical data, such as request methods.
In a histogram, bars typically have little or no gap because the data is continuous. In contrast, a column chart has spacing between bars of different categories to highlight their distinctions.
For more information about the entry point to add a histogram, see Add a chart to a dashboard.
Configuration example
Basic histogram
Log on to the Simple Log Service console. In the Projects section, click the project you want.
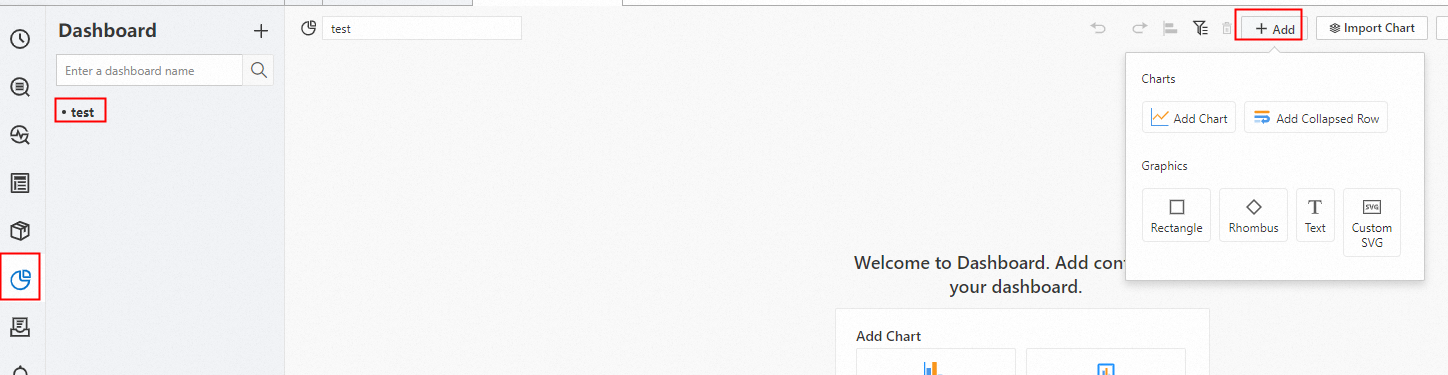
In the left-side navigation pane, choose Dashboard > Dashboards. In the dashboard list, click the dashboard you want. In the upper-right corner of the dashboard page, click Edit. In edit mode, click Add > Add Chart.
On the right side of the Edit Chart page, select Histogram in the Chart Types section and configure parameters in the Query and Analysis Configurations section based on the following figure. On the left side of the Edit Chart page, configure the query time range, Logstore, and query statement for the histogram. After you complete the configuration, click Apply in the upper part of the Edit Chart page to view the configuration effects of the histogram.

If you want to use the x-axis to represent time, we recommend that you turn on Time Series Mode in the upper part of the Edit Chart page. For more information, see Time series mode. If you turn on Time Series Mode, Simple Log Service automatically transforms raw data to time-formatted data and displays the distribution of data from the time dimension. The following query statement is used to query the number of records at 30-minute intervals:
* | select __time__ - __time__ % 1800 as t, COUNT(*) as c group by t order by t asc limit 10000
Multi-dimension stacking
Log on to the Simple Log Service console. In the Projects section, click the project you want.
In the left-side navigation pane, choose Dashboard > Dashboards. In the dashboard list, click the dashboard you want. In the upper-right corner of the dashboard page, click Edit. In edit mode, click Add > Add Chart.
On the right side of the Edit Chart page, configure parameters in the Histogram Settings and Query and Analysis Configurations sections based on the following figure. On the left side of the Edit Chart page, configure the query time range, Logstore, and query statement for the histogram. After you complete the configuration, click Apply in the upper part of the Edit Chart page to view the configuration effects of the histogram.
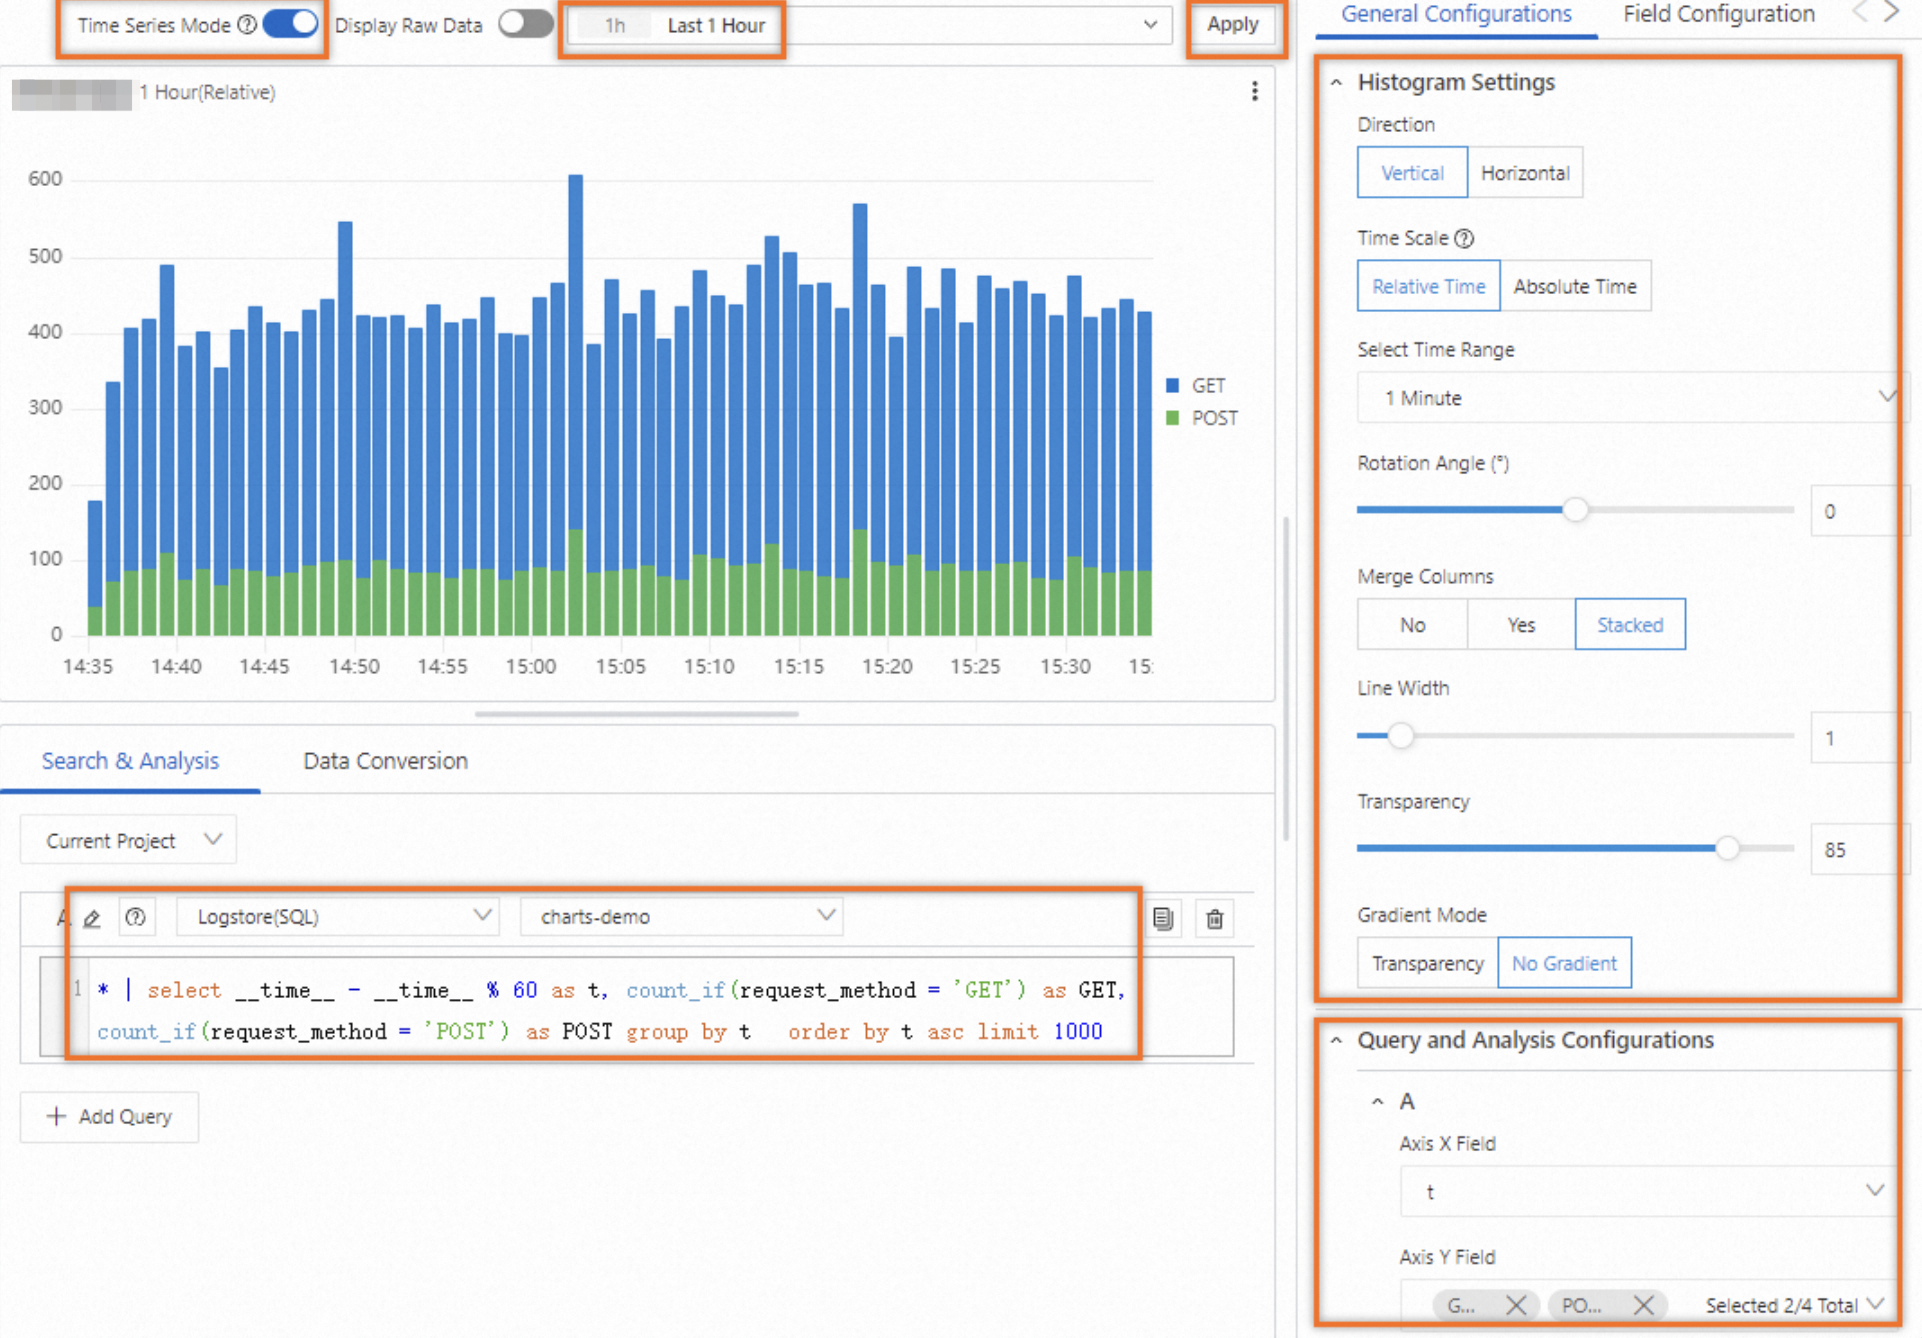
The following query statement is used to query the numbers of GET and POST requests per minute:
* | select __time__ - __time__ % 60 as t, count_if(request_method = 'GET') as GET, count_if(request_method = 'POST') as POST group by t order by t asc limit 1000
Configuration on the General Configurations tab
You can configure global settings for a histogram on the General Configurations tab.
Basic Configurations
Parameter
Description
Title
The title of the chart.
Display Title
If you turn on Display Title, the title of the chart is displayed.
Display Border
If you turn on Display Border, the borders of the chart are displayed.
Display Background
If you turn on Display Background, the background color of the chart is displayed.
Display Time
If you turn on Display Time, the query time range of the chart is displayed.
Fixed Time
If you turn on Fixed Time, the query time range of the chart is independent of the global time range of the dashboard.
Standard Configurations
Parameter
Description
Format
The display format of numeric values.
Unit
The unit of numeric values.
Number of Digits after Decimal Point
The decimal places of numeric values.
Display Name
The name of the display field.
If you specify a value for Display Name, the value is used as the names for all display fields in the chart. If you want to change the name of a display field, you must configure parameters on the Field Configuration tab.
Color Scheme
The color scheme of the chart.
Built-in: uses the built-in color scheme.
Solid: uses the color that you select.
Threshold: uses different colors for different values based on the specified thresholds for the values.
Parameters in the Histogram Settings section
Parameter
Description
Direction
The direction of the histogram. Valid values: Vertical and Horizontal.
Coordinate Scale
The interval between values on the x-axis. This parameter is available only if you turn off Time Series Mode.
Time Scale
The time scale. This parameter is available only if you turn on Time Series Mode.
Select Time Range
The interval between values on the x-axis. This parameter is available only if you turn on Time Series Mode.
Buckets
The number of buckets.
If you turn off Time Series Mode and configure the Coordinate Scale parameter, you do not need to configure this parameter.
Rotation Angle
The direction of the text on the x-axis.
If you set the Direction parameter to Vertical, you must configure this parameter.
Merge Columns
If you specify multiple fields for the y-axis, you can configure the Merge Columns to specify the manner in which the columns are displayed. Valid values:
No: The value of each field is counted from the bottom of each column.
Yes: The values of fields are merged into one column.
Stacked: The columns of different categories are stacked and do not overlap with each other.
Line Width
The width of the border.
Transparency
The transparency of the histogram.
Gradient Mode
The gradient mode of the histogram. Valid values:
Transparency: If you select this mode, the histogram has a color gradient that is affected by the column color and the value of the Transparency parameter.
No Gradient: If you select this mode, the histogram does not have a color gradient. The column color is used in the histogram.
Parameters in the Query and Analysis Configurations section
Parameter
Description
Axis X Field
Select a field as the x-axis.
By default, Simple Log Service automatically selects an appropriate field as the x-axis.
Axis Y Field
Select a field as the y-axis. You can specify multiple fields to generate a grouped histogram.
By default, Simple Log Service automatically selects an appropriate field as the y-axis.
Parameters in the Legend Configurations section
Parameter
Description
Display Legend
If you turn on Display Legend, the legend is displayed in the histogram.
Sorting Order
The order in which the legend items are sorted.
Legend Position
The position of the legend in the histogram.
Actions
The data display effect when you click a legend item. Valid values:
Single: If you click a legend item, only the data for the legend item is displayed in the histogram.
Switch: If you click a legend item, the data for the legend item is hidden or displayed in the histogram.
Maximum Width (Height)%
The maximum width and height of the legend.
Parameters in the Tooltip Configurations section
Parameter
Description
Sorting Order
The sorting method of data.
When you move the pointer over a column whose data you want to view, the data is displayed based on the sorting method that you specify.
Display Mode
The display mode of data.
When you move the pointer over a column whose data you want to view, the data is displayed based on the display mode that you specify.
Parameters in the Axis X section
Parameter
Description
Display Axis X
If you turn on Display Axis X, the x-axis of the histogram is displayed.
Axis X Title
The title of the x-axis.
Format
The format of the time on the x-axis. This parameter is available only if you turn on Time Series Mode.
Axis X Height
The height of the x-axis.
By default, Simple Log Service automatically specifies the height of the x-axis.
Drag and Zoom
Specifies whether to refresh the global time or the current single chart time after you drag and zoom specific columns if you turn on Time Series Mode.
Parameters in the Axis Y section
Parameter
Description
Display Axis Y
If you turn on Display Axis Y, the y-axis of the histogram is displayed.
Axis Y Title
The title of the y-axis.
Axis Y Position
The position of the y-axis.
Axis Y Width
The width of the y-axis.
By default, Simple Log Service automatically specifies the width of the y-axis.
Maximum Value
The maximum value of the y-axis.
By default, Simple Log Service automatically specifies the maximum value of the y-axis.
Minimum Value
The minimum value of the y-axis.
By default, Simple Log Service automatically specifies the minimum value of the y-axis.
Elastic Maximum Value
The elastic maximum value of the y-axis. The elastic maximum value takes effect only when all values of the y-axis are less than the elastic maximum value.
By default, Simple Log Service automatically specifies the elastic maximum value of the y-axis.
Elastic Minimum Value
The elastic minimum value of the y-axis. The elastic minimum value takes effect only when all values of the y-axis are greater than the elastic minimum value.
By default, Simple Log Service automatically specifies the elastic minimum value of the y-axis.
Axis Y ID
The ID of the y-axis. If you configure only one y-axis on the General Configurations tab, this parameter does not take effect. If you want to configure multiple y-axes, you must configure the required parameters on the Field Configuration tab. The ID of the y-axis is a string. A y-axis that has a specified ID represents a unique y-axis in a histogram.
The specified ID for the y-axis takes precedence over the unit that you specify in the Standard Configurations section. For example, if two y-axes have the same unit, they are merged into one y-axis. If two y-axes have the same unit but different IDs, they are displayed as two y-axes.
Parameters in the Variable Replacement section
Parameter
Description
Variable Replacement
The settings for variable replacement. You can click AddVariable Replacement to add a filter of the Variable Replacement type to the table. After you configure the settings for variable replacement on the General Configurations tab, Simple Log Service adds a filter in the upper-left corner of the table. You can select a value from the filter drop-down list. Then, Simple Log Service automatically replaces the variable in the query statement of the table with the variable value indicated by the value that you select, and performs a query and analysis operation. For more information, see Example 2: Configure variable replacement.
Parameters in the Documentation section
Parameter
Description
Add Documentation Link
The button that allows you to specify custom document links and descriptions. After you configure the settings, the specified information is displayed in the upper right corner of the histogram.
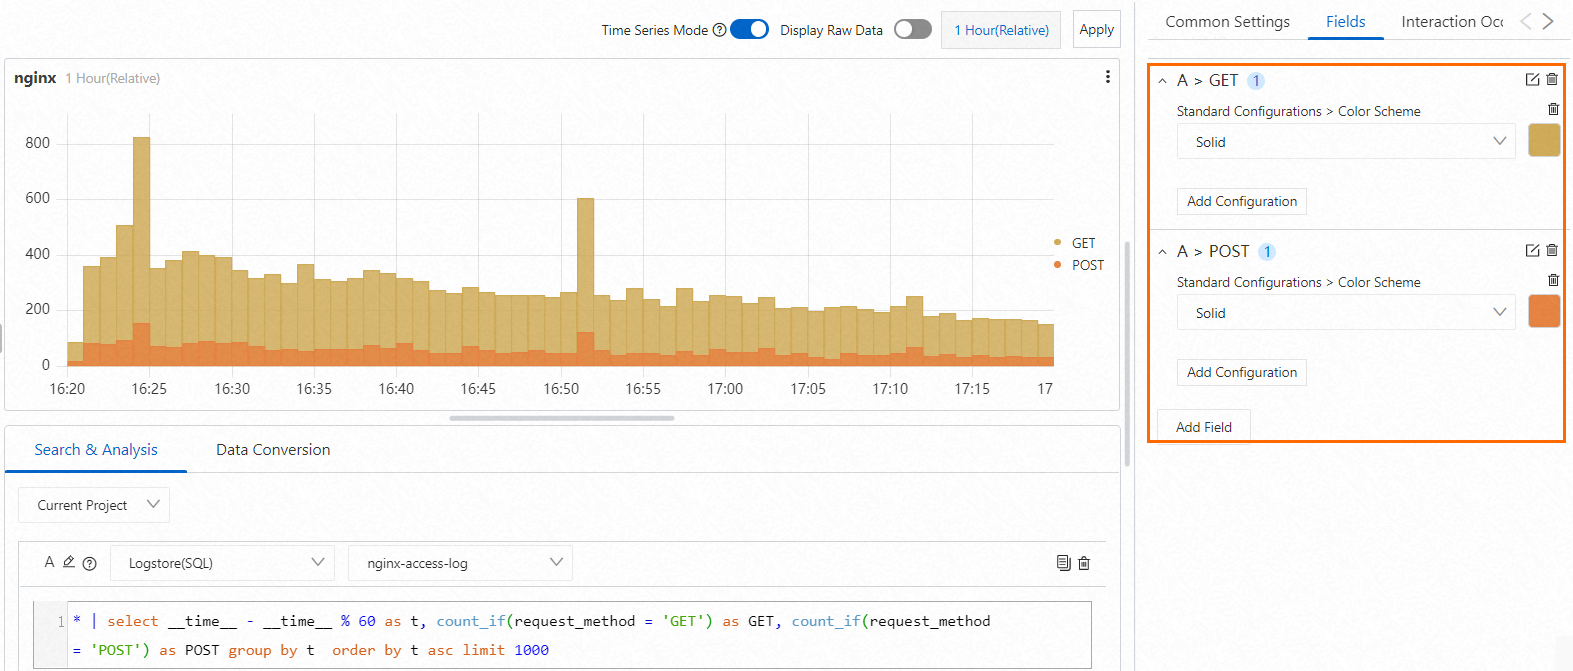
Configuration on the Field Configuration tab
You can configure personalized display settings for the results of a single query statement or for a single column of data in the results. For more information, see Configuration on the General Configurations tab.
If you want to specify a color for the columns of a field on the y-axis, you can configure the field on the Field Configuration tab. For example, you can select A > GET to configure settings for the GET field in the results of Query Statement A. You can also select A > POST to configure settings for the POST field in the results of Query Statement A.
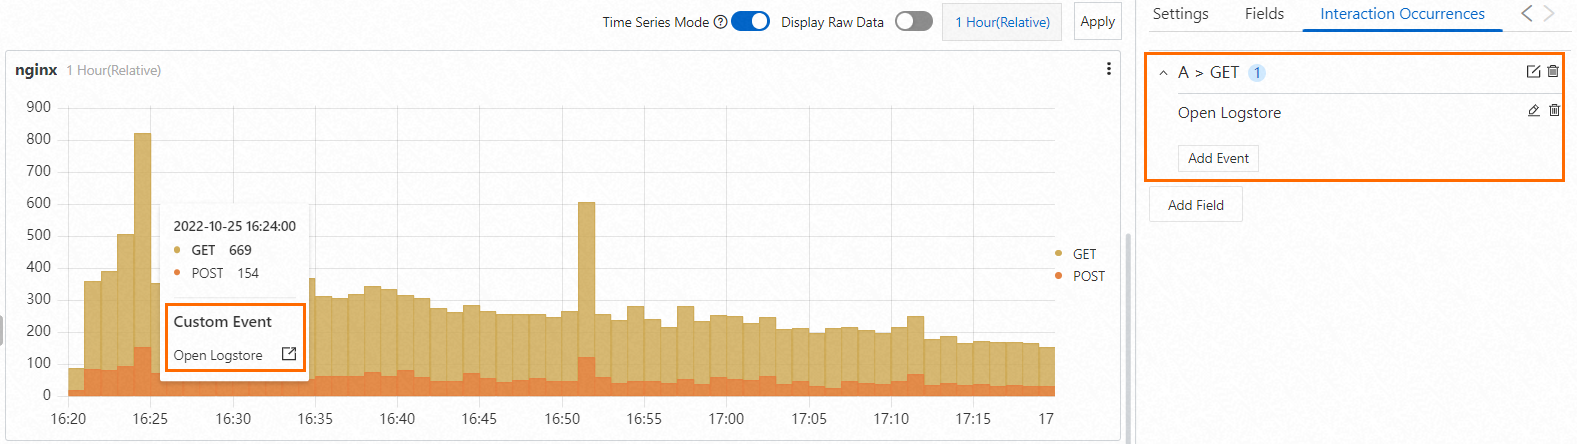
Configuration on the Interaction Occurrences tab
You can configure an interaction occurrence for the results of a single query statement or for a single column of data in the results to analyze data in a finer-grained manner. Supported types of interaction occurrences include Open Logstore, Open Saved Search, Open Dashboard, Open Trace Analysis, Open Trace Details, and Create Custom HTTP URL. For more information, see Interaction occurrences.
For example, you can select A > GET to configure an Open Logstore interaction occurrence for the GET field in the results of Query Statement A. After you configure the interaction occurrence, you can click the value of the GET field in the histogram and click Open Logstore in the popover that appears. Then, you are navigated to the Logstore that you specify.