In a microservices architecture, OpenTelemetry provides a powerful trace framework that can capture the request traces transferred among services in a distributed system. The traces are essential to understand the request flows and dependencies among the services. However, if you want to analyze the internal performance of a microservice, you cannot use only traces. For example, when the response speed of a service is slow or a request times out, the root causes of the issue may fail to be identified by using only traces. In this case, detailed profiling data is required.
How it works
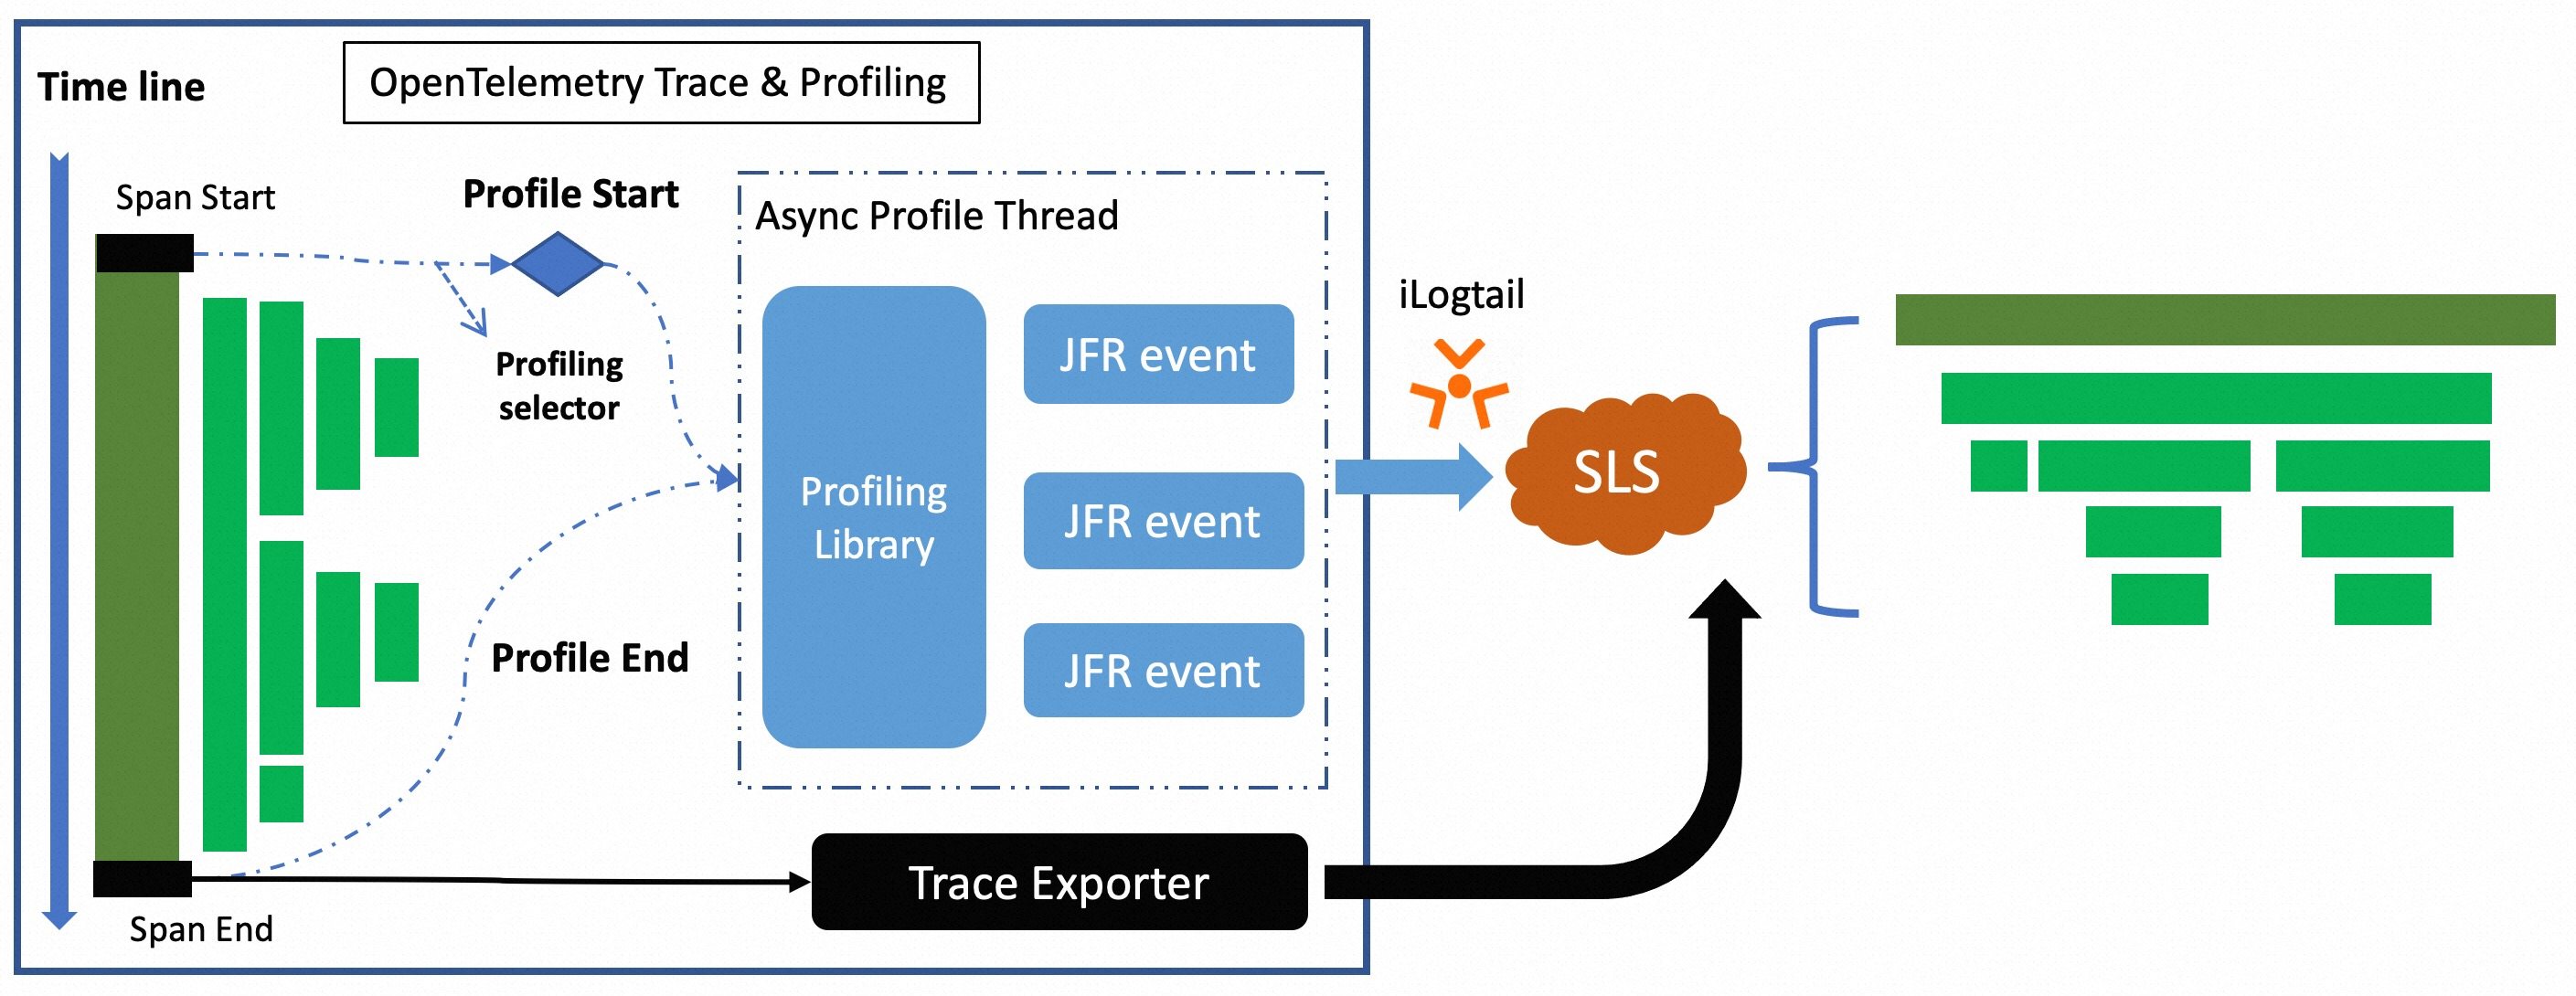
Identify the traces that you want to analyze based on profiling configurations. When required traces are captured, the extension package triggers a Java Flight Recorder (JFR) profiling task to collect profiling data in the runtime, including method execution duration, memory usage, and CPU utilization.
Logtail sends the collected profiling data to Simple Log Service. In Simple Log Service, the profiling data can be associated with traces based on trace IDs. This way, you can identify performance hotspots in Java applications.
Scenarios
The following list describes the scenarios in which you can identify the root causes of issues based on profiling data. Then, you can identify the performance bottlenecks of Java applications.
The requested memory size is large, resulting in frequent GC operations
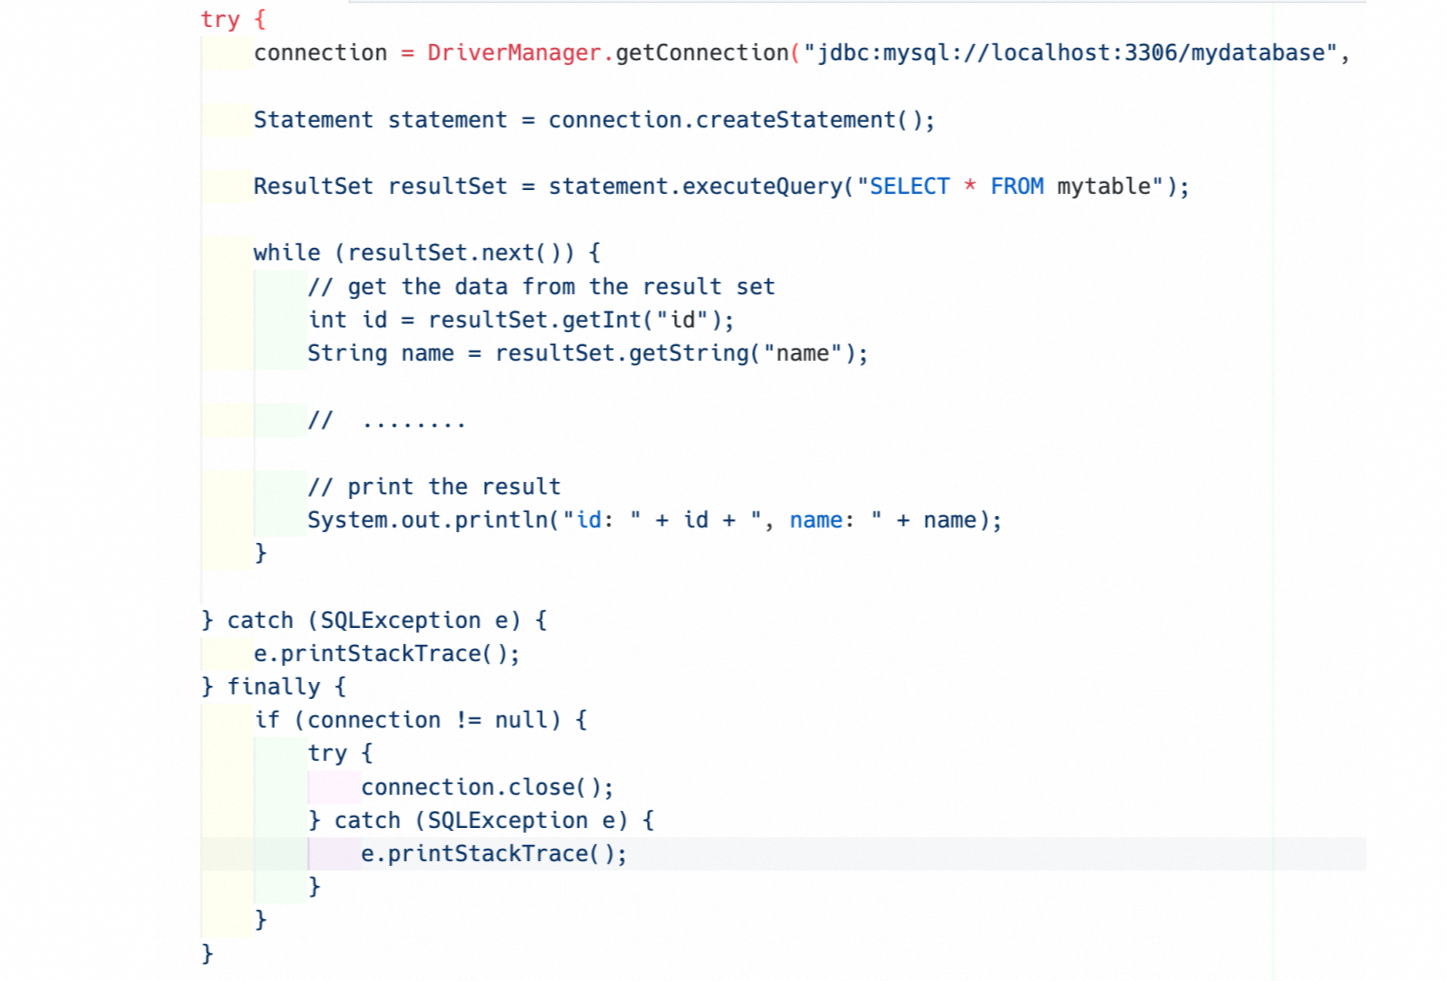
A Java application queries data from a database table by using Java Database Connectivity (JDBC), and no limits are imposed on the volume of the returned data. If the data volume of the table is large, the requested memory size is large and garbage collection (GC) operations are frequently performed. This degrades the performance of the Java application.
Trace instrumentation is sparsely added and CPUs are occupied for a long period of time, making root cause analysis difficult
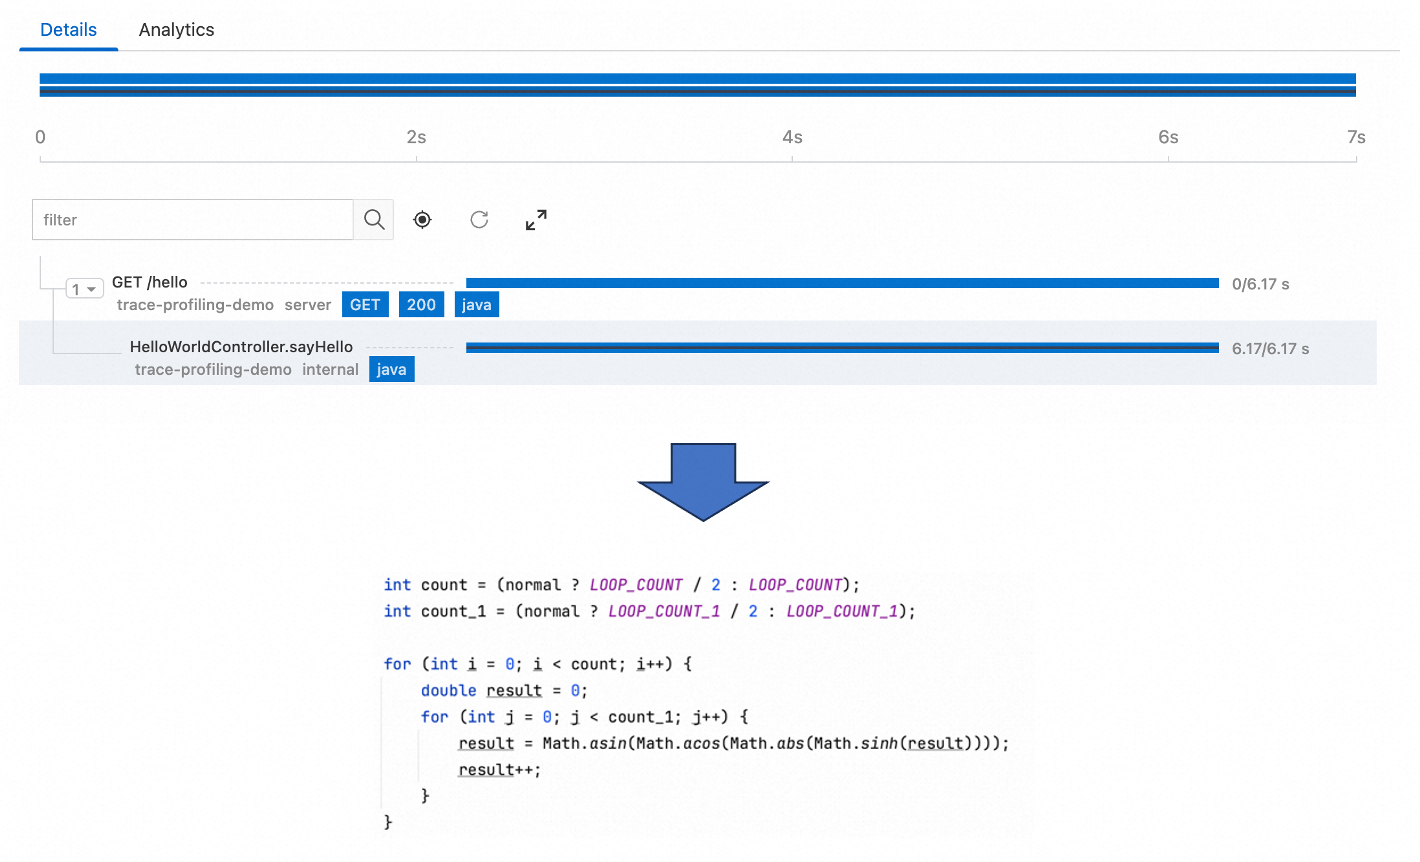
To reduce the impact of agents on the performance of a Java application, trace instrumentation is not added for each line of code. In this case, performance analysis cannot cover some time-consuming code for which trace instrumentation is not added. If a performance issue occurs in the code, you may find it difficult to identify the issue based on traces. For example, if you do not add trace instrumentation for a critical code snippet, you cannot identify the related performance issues based on traces.
Install the profiling data receiver
Install the CRD template tool
Method | Description |
Install the CRD template tool outside a cluster | If you want to install the CRD template tool outside a cluster, make sure that the |
Install the CRD template tool in a cluster | If you want to install the CRD template tool in a container, the system creates CRDs based on the permissions of an installed component named |
Install the CRD template tool outside a cluster
Log on to a cluster and download the CRD template tool.
China
curl https://logtail-release-cn-hangzhou.oss-cn-hangzhou.aliyuncs.com/kubernetes/crd-tool.tar.gz -o /tmp/crd-tool.tar.gzOutside China
curl https://logtail-release-ap-southeast-1.oss-ap-southeast-1.aliyuncs.com/kubernetes/crd-tool.tar.gz -o /tmp/crd-tool.tar.gz
Install the CRD template tool. After the tool is installed,
sls-crd-toolis generated in the folder in which the CRD template tool is installed.tar -xvf /tmp/crd-tool.tar.gz -C /tmp &&chmod 755 /tmp/crd-tool/install.sh && sh -x /tmp/crd-tool/install.shRun the
./sls-crd-tool listcommand to check whether the tool is installed. If a value is returned, the tool is installed.
Install the CRD template tool in a container
Log on to a cluster and access the
alibaba-log-controllercontainer.kubectl get pods -n kube-system -o wide |grep alibaba-log-controller | awk -F ' ' '{print $1}' kubectl exec -it {pod} -n kube-system bash cd ~Download the CRD template tool.
If you can download resources in the cluster over the Internet, run one of the following commands to download the CRD template tool.
China
curl https://logtail-release-cn-hangzhou.oss-cn-hangzhou.aliyuncs.com/kubernetes/crd-tool.tar.gz -o /tmp/crd-tool.tar.gzOutside China
curl https://logtail-release-ap-southeast-1.oss-ap-southeast-1.aliyuncs.com/kubernetes/crd-tool.tar.gz -o /tmp/crd-tool.tar.gz
If you cannot download resources in the cluster over the Internet, you can download the CRD template tool outside the cluster. Then, run the
kubectl cp <source> <destination>command or use the file upload feature of ACK to upload the CRD template tool to the container.
Install the CRD template tool. After the tool is installed,
sls-crd-toolis generated in the folder in which the CRD template tool is installed.tar -xvf /tmp/crd-tool.tar.gz -C /tmp &&chmod 755 /tmp/crd-tool/install.sh && sh -x /tmp/crd-tool/install.shRun the
./sls-crd-tool listcommand to check whether the tool is installed. If a value is returned, the tool is installed.
Install the profiling data receiver
Run the
./sls-crd-tool -l en listcommand.
Run the
./sls-crd-tool -i get --project ${project} --instance ${instance} profiling-receivercommand.${project}: the project to which the Full-stack Observability instance belongs.
${instance}: the ID of the Full-stack Observability instance.
Run the
./sls-crd-tool apply -f template-profiling-receiver.yamlcommand.
Perform operations on a Java application
Install the profiling extension package
Download OpenTelemetry Java Agent.
Download otel-sls-extension.
Create a configuration file named profiling_config.yaml. Ten traces are collected based on the configuration file.
enabled: true
maxProfilingCount: 10
profilingIntervalMillis: 5000
agentConfigs:
   agent.upload.server: "http://
logtail-statefulset.kube-system:4040"
   agent.timeout: 10
   agent.ingest.max.tries: 2
   agent.log.level: off
   agent.log.file: ""
   period: 20
   cpu.engine: async_profiler
   wallclock.engine: async_profiler
   alloc.engine: async_profiler
The following table describes the parameters in the configuration file.
Parameter
Description
Required
Default value
enabled
Specifies whether to enable profiling.
Yes
false
maxProfilingCount
The maximum number of profiling tasks that can be concurrently run.
No
10
profilingIntervalMillis
The interval at which profiling tasks are triggered.
No
5000
agentConfigs
The configuration of the profiling agent.
No
agent.upload.server
The receiver address of the profiling data.
No
agent.timeout
The timeout period for the upload of the profiling data. Unit: seconds.
No
10
agent.ingest.max.tries
The maximum number of retries that are allowed for uploading the profiling data.
No
2
agent.log.level
The log level of the profiling agent.
No
off
agent.log.file
The path to the log file of the profiling agent.
No
period
The interval at which the profiling data is uploaded. Unit: seconds.
No
20
cpu.engine
The CPU engine used for collection.
auto/async_profiler/jfr/offis supported.No
off
wallclock.engine
The wallclock engine used for collection.
auto/async_profiler/offis supported.No
off
alloc.engine
The alloc engine used for collection.
auto/async_profiler/jfr/offis supported.No
off
profilingRules
The configuration of the profiling rule.
No
profilingRules.name
The name of the profiling rule.
Yes
profilingRules.type
The type of the profiling rule.
ROOT_SPAN, AGENT_RESOURCE, and SPAN_NAMEare supported.Yes
profilingRules.attributes
The attributes of the profiling rule. The valid values of this parameter vary based on the type of the profiling rule.
No
Start the Java application
java -javaagent:/path/to/opentelemetry-javaagent-all.jar \
     -Dotel.service.name=test-demo \
     -Dotel.javaagent.extensions=/path/to/otel-extension.jar \
     -Dotel.profiling.config_endpoint=file:/path/to/profiling_config.yaml \
     -Dotel.service.name=trace-profiling-demo \
     -jar myapp.jar
View the profiling data
To view the profiling data, access the Full-stack Observability instance and click the related service.
Configuration examples
Configure all root spans for profiling.
enabled: true
maxProfilingCount: 10
profilingIntervalMillis: 5000
agentConfigs:
  agent.upload.server: "http://localhost:4040"
  agent.timeout: 10
  agent.ingest.max.tries: 2
  agent.log.level: off
  agent.log.file: ""
  period: 20
  cpu.engine: async_profiler
  wallclock.engine: async_profiler
  alloc.engine: async_profiler
profilingRules:
  - name: "profiling root span"
    type: ROOT_SPAN
Configure the root spans whose service name is payment for profiling.
enabled: true
maxProfilingCount: 10
profilingIntervalMillis: 5000
agentConfigs:
  agent.upload.server: "http://localhost:4040"
  agent.timeout: 10
  agent.ingest.max.tries: 2
  agent.log.level: off
  agent.log.file: ""
  period: 20
  cpu.engine: async_profiler
  wallclock.engine: async_profiler
  alloc.engine: async_profiler
profilingRules:
  - name: "profiling root span"
    type: ROOT_SPAN
  - name: "profiling all spans with some resouce attribute"
    type: AGENT_RESOURCE
    attributes:
      service.name: "payment" # In this example, specify spans whose service name is payment for collection.
Configure the spans whose service name is payment and whose name starts with Get for profiling.
enabled: true
maxProfilingCount: 10
profilingIntervalMillis: 5000
agentConfigs:
   agent.upload.server: "http://localhost:4040"
   agent.timeout: 10
   agent.ingest.max.tries: 2
   agent.log.level: off
   agent.log.file: ""
   period: 20
   cpu.engine: async_profiler
   wallclock.engine: async_profiler
   alloc.engine: async_profiler
profilingRules:
   - name: "profiling all spans with some resouce attribute"
     type: AGENT_RESOURCE
     attributes:
        service.name: "payment" # In this example, specify spans whose service name is payment for collection.
   - name: "profiling with span name"
     type: SPAN_NAME
     attributes:
        pattern: "Get*" # You can use a regular expression to specify the name of a span.