If you have visualized Elasticsearch logs in Kibana and want to migrate logs from Elasticsearch to Simple Log Service (SLS), use Elasticsearch-compatible API of SLS without the need to modify the business code.
Alibaba Cloud has proprietary rights to the information in this topic. This topic describes the capabilities of Alibaba Cloud to interact with third-party services. The names of third-party companies and services may be referenced.
Prerequisites
A project and a Standard logstore are created, and logs are collected. For more information, see Manage projects, Create a basic logstore, and Data collection overview.
Indexes are created before you query logs. For more information, see Create indexes.
An AccessKey pair is created for the RAM user, and the required permissions to query logs in logstores are granted to the RAM user. For more information, see Grant permissions to a RAM user.
Background information
Kibana is an Elasticsearch-based data visualization and exploration tool. Use Kibana to query, analyze, and visualize data in Elasticsearch. If you use Kibana to query logs and configure visualized reports and you want to migrate your data to SLS, use Elasticsearch-compatible API of SLS. Then query and analyze SLS data in Kibana.
How it works
You must deploy Kibana, an Elasticsearch cluster, and a proxy in your client environment.
Kibana is used to query, analyze, and visualize data.
Elasticsearch is used to store the metadata of Kibana. The metadata contains the configurations of Kibana. The amount of metadata is excessively small.
The metadata of Kibana needs to be frequently updated. SLS does not support updates. You must deploy an Elasticsearch cluster to store Kibana metadata.
A proxy is used to distinguish the requests for metadata and the requests for Elasticsearch-compatible API. You must deploy a proxy to route the API requests of Kibana.

Step 1: Deploy an Elasticsearch cluster, Kibana, and a proxy
We recommend that you use a server that has at least 8 GB of memory.
The Docker version must be 1.18 or later.
Use Docker Compose
Run the following commands to create a directory named
sls-kibanaand a subdirectory nameddatain thesls-kibanadirectory on a server. Then, modify the permissions on thedatasubdirectory to ensure that Elasticsearch containers have the read, write, and execution permissions on the subdirectory.mkdir sls-kibana cd sls-kibana mkdir data chmod 777 dataCreate a file named
.envin thesls-kibanadirectory. The following sample code shows the content of the file. Change the parameter values as needed.ES_PASSWORD=aStrongPassword # Change the parameter value as needed. SLS_ENDPOINT=cn-huhehaote.log.aliyuncs.com SLS_PROJECT=etl-dev-7494ab**** SLS_ACCESS_KEY_ID=xxx SLS_ACCESS_KEY_SECRET=xxx #ECS_ROLE_NAME="" # If you use the ECS RAM role for access, enter the role name. #SLS_PROJECT_ALIAS=etl-dev # Optional. If the name of the SLS project specified by the SLS_PROJECT parameter is excessively long, you can configure this parameter to specify an alias for the project. #SLS_LOGSTORE_FILTERS="access*" # Optional. The logstores used to automatically create index patterns. Separate multiple index patterns with commas (,) and enclose index patterns in double quotation marks (""). Example: "access*,error*". #KIBANA_SPACE=default # Optional. The space in which the index pattern is created. If no space exists, a space is automatically created. # You can specify multiple SLS projects. Note that if you specify more than six projects, you must reference the projects in the docker-compose.yml file. #SLS_ENDPOINT2=cn-huhehaote.log.aliyuncs.com #SLS_PROJECT2=etl-dev2 #SLS_ACCESS_KEY_ID2=xxx #SLS_ACCESS_KEY_SECRET2=xxx #SLS_PROJECT_ALIAS2=etl-dev2 # Optional. If the name of the SLS project specified by the SLS_PROJECT2 parameter is excessively long, you can configure this parameter to specify an alias for the project. #SLS_LOGSTORE_FILTERS2="test*log" # Optional. The logstores used to automatically create index patterns. Separate multiple index patterns with commas (,) and enclose index patterns in double quotation marks (""). Example: "access*,error*". #KIBANA_SPACE2=default # Optional. The space in which the index pattern is created. If no space exists, a space is automatically created.Parameter
Description
ES_PASSWORD
The password of the Elasticsearch cluster. Use it to log on to the Kibana console.
ECS_ROLE_NAME
ECS instance RAM role. For the permissions required for the RAM role, see Grant permissions to a RAM user.
SLS_ENDPOINT
The endpoint of the SLS project. For more information, see Manage projects.
SLS_PROJECT
The name of the SLS project. For more information, see Manage projects.
SLS_ACCESS_KEY_ID
The AccessKey ID created for the RAM user. The RAM user must have the required permissions to query logs in the logstore. For more information, see Grant permissions to a RAM user.
SLS_ACCESS_KEY_SECRET
The AccessKey secret created for the RAM user. The RAM user must have the required permissions to query logs in the logstore. For more information, see Grant permissions to a RAM user.
SLS_PROJECT_ALIAS
Optional. If the name of the SLS project specified by the SLS_PROJECT parameter is excessively long, configure this parameter to specify an alias for the project.
SLS_LOGSTORE_FILTERS
Optional. The logstores used to automatically create index patterns. Separate multiple index patterns with commas (,) and enclose index patterns in double quotation marks (""). Example:
"access*,error*".KIBANA_SPACE
Optional. The space in which the index pattern is created. If no space exists, a space is automatically created.
Create a file named
docker-compose.yamlin thesls-kibanadirectory. The following sample code shows the content of the file:services: es: image: sls-registry.cn-hangzhou.cr.aliyuncs.com/kproxy/elasticsearch:7.17.26 #image: sls-registry.cn-hangzhou.cr.aliyuncs.com/kproxy/elasticsearch:7.17.26-arm64 environment: - "discovery.type=single-node" - "ES_JAVA_OPTS=-Xms2G -Xmx2G" - ELASTIC_USERNAME=elastic - ELASTIC_PASSWORD=${ES_PASSWORD} - xpack.security.enabled=true volumes: # Ensure that the mkdir data && chmod 777 data command is run to create a subdirectory named data and grant the read, write, and execution permissions on the subdirectory to all users. - ./data:/usr/share/elasticsearch/data kproxy: image: sls-registry.cn-hangzhou.cr.aliyuncs.com/kproxy/kproxy:2.1.8 #image: sls-registry.cn-hangzhou.cr.aliyuncs.com/kproxy/kproxy:2.1.8-arm64 depends_on: - es environment: - ES_ENDPOINT=es:9200 - ECS_ROLE_NAME=${ECS_ROLE_NAME} # The first SLS project - SLS_ENDPOINT=${SLS_ENDPOINT} - SLS_PROJECT=${SLS_PROJECT} - SLS_LOGSTORE_FILTERS=${SLS_LOGSTORE_FILTERS} - KIBANA_SPACE=${KIBANA_SPACE} - SLS_PROJECT_ALIAS=${SLS_PROJECT_ALIAS} - SLS_ACCESS_KEY_ID=${SLS_ACCESS_KEY_ID} - SLS_ACCESS_KEY_SECRET=${SLS_ACCESS_KEY_SECRET} # The second SLS project - SLS_ENDPOINT2=${SLS_ENDPOINT2} - SLS_PROJECT2=${SLS_PROJECT2} - SLS_LOGSTORE_FILTERS2=${SLS_LOGSTORE_FILTERS2} - KIBANA_SPACE2=${KIBANA_SPACE2} - SLS_PROJECT_ALIAS2=${SLS_PROJECT_ALIAS2} - SLS_ACCESS_KEY_ID2=${SLS_ACCESS_KEY_ID2} - SLS_ACCESS_KEY_SECRET2=${SLS_ACCESS_KEY_SECRET2} - SLS_ENDPOINT3=${SLS_ENDPOINT3} - SLS_PROJECT3=${SLS_PROJECT3} - SLS_LOGSTORE_FILTERS3=${SLS_LOGSTORE_FILTERS3} - KIBANA_SPACE3=${KIBANA_SPACE3} - SLS_PROJECT_ALIAS3=${SLS_PROJECT_ALIAS3} - SLS_ACCESS_KEY_ID3=${SLS_ACCESS_KEY_ID3} - SLS_ACCESS_KEY_SECRET3=${SLS_ACCESS_KEY_SECRET3} - SLS_ENDPOINT4=${SLS_ENDPOINT4} - SLS_PROJECT4=${SLS_PROJECT4} - SLS_LOGSTORE_FILTERS4=${SLS_LOGSTORE_FILTERS4} - KIBANA_SPACE4=${KIBANA_SPACE4} - SLS_PROJECT_ALIAS4=${SLS_PROJECT_ALIAS4} - SLS_ACCESS_KEY_ID4=${SLS_ACCESS_KEY_ID4} - SLS_ACCESS_KEY_SECRET4=${SLS_ACCESS_KEY_SECRET4} - SLS_ENDPOINT5=${SLS_ENDPOINT5} - SLS_PROJECT5=${SLS_PROJECT5} - SLS_LOGSTORE_FILTERS5=${SLS_LOGSTORE_FILTERS5} - KIBANA_SPACE5=${KIBANA_SPACE5} - SLS_PROJECT_ALIAS5=${SLS_PROJECT_ALIAS5} - SLS_ACCESS_KEY_ID5=${SLS_ACCESS_KEY_ID5} - SLS_ACCESS_KEY_SECRET5=${SLS_ACCESS_KEY_SECRET5} - SLS_ENDPOINT6=${SLS_ENDPOINT6} - SLS_PROJECT6=${SLS_PROJECT6} - SLS_LOGSTORE_FILTERS6=${SLS_LOGSTORE_FILTERS6} - KIBANA_SPACE6=${KIBANA_SPACE6} - SLS_PROJECT_ALIAS6=${SLS_PROJECT_ALIAS6} - SLS_ACCESS_KEY_ID6=${SLS_ACCESS_KEY_ID6} - SLS_ACCESS_KEY_SECRET6=${SLS_ACCESS_KEY_SECRET6} # You can specify up to 255 SLS projects. kibana: image: sls-registry.cn-hangzhou.cr.aliyuncs.com/kproxy/kibana:7.17.26 #image: sls-registry.cn-hangzhou.cr.aliyuncs.com/kproxy/kibana:7.17.26-arm64 depends_on: - kproxy environment: - ELASTICSEARCH_HOSTS=http://kproxy:9201 - ELASTICSEARCH_USERNAME=elastic - ELASTICSEARCH_PASSWORD=${ES_PASSWORD} - XPACK_MONITORING_UI_CONTAINER_ELASTICSEARCH_ENABLED=true ports: - "5601:5601" # The following service component is optional. The component is used to automatically create Kibana index patterns. index-patterner: image: sls-registry.cn-hangzhou.cr.aliyuncs.com/kproxy/kproxy:2.1.8 #image: sls-registry.cn-hangzhou.cr.aliyuncs.com/kproxy/kproxy:2.1.8-arm64 command: /usr/bin/python3 -u /workspace/create_index_pattern.py depends_on: - kibana environment: - KPROXY_ENDPOINT=http://kproxy:9201 - KIBANA_ENDPOINT=http://kibana:5601 - KIBANA_USER=elastic - KIBANA_PASSWORD=${ES_PASSWORD} - ECS_ROLE_NAME=${ECS_ROLE_NAME} - SLS_PROJECT_ALIAS=${SLS_PROJECT_ALIAS} - SLS_ACCESS_KEY_ID=${SLS_ACCESS_KEY_ID} - SLS_ACCESS_KEY_SECRET=${SLS_ACCESS_KEY_SECRET} - SLS_PROJECT_ALIAS2=${SLS_PROJECT_ALIAS2} - SLS_ACCESS_KEY_ID2=${SLS_ACCESS_KEY_ID2} - SLS_ACCESS_KEY_SECRET2=${SLS_ACCESS_KEY_SECRET2} - SLS_PROJECT_ALIAS3=${SLS_PROJECT_ALIAS3} - SLS_ACCESS_KEY_ID3=${SLS_ACCESS_KEY_ID3} - SLS_ACCESS_KEY_SECRET3=${SLS_ACCESS_KEY_SECRET3} - SLS_PROJECT_ALIAS4=${SLS_PROJECT_ALIAS4} - SLS_ACCESS_KEY_ID4=${SLS_ACCESS_KEY_ID4} - SLS_ACCESS_KEY_SECRET4=${SLS_ACCESS_KEY_SECRET4} - SLS_PROJECT_ALIAS5=${SLS_PROJECT_ALIAS5} - SLS_ACCESS_KEY_ID5=${SLS_ACCESS_KEY_ID5} - SLS_ACCESS_KEY_SECRET5=${SLS_ACCESS_KEY_SECRET5} - SLS_PROJECT_ALIAS6=${SLS_PROJECT_ALIAS6} - SLS_ACCESS_KEY_ID6=${SLS_ACCESS_KEY_ID6} - SLS_ACCESS_KEY_SECRET6=${SLS_ACCESS_KEY_SECRET6} # You can specify up to 255 SLS projects.Run the following command to start the service:
docker compose up -dRun the following command to query the status of the service:
docker compose psAfter configuring the settings, enter
http://${IP address of Kibana}:5601in a browser to go to the logon page of Kibana. Then, enter the username and password specified for the Elasticsearch cluster.ImportantYou must add port 5601 to the security group rule of the server. For more information, see Add a security group rule.
http://${IP address of Kibana}:5601
Use Helm
Prerequisites
The following components are installed in a Container Service for Kubernetes (ACK) cluster. For more information, see Manage components.
One of the following Ingress controllers:
Procedure
Create a namespace:
# Create a namespace.
kubectl create namespace sls-kibana
Create and modify the
values.yamlfile. The following sample code shows the content of the file. Change the parameter values as needed.kibana: ingressClass: nginx # Change the value based on the Ingress controller installed. # To obtain the value of this parameter, perform the following steps: Log on to the ACK console. In the left-side navigation pane, click Clusters. On the Clusters page, click the name of the cluster that you want to manage. In the left-side navigation pane, choose Operations > Add-ons. On the Add-ons page, enter Ingress to search for the installed Ingress controller. # ALB Ingress Controller: Set the value to alb. # MSE Ingress Controller: Set the value to mse. # NGINX Ingress Controller: Set the value to nginx. ingressDomain: # You can leave this parameter empty. If you want to access Kibana by using a domain name, configure this parameter. ingressPath: /kibana/ # Required. The subpath used to access Kibana. # If you configure the ingressDomain parameter, you can set the ingressPath parameter to /. #i18nLocale: en # The language of Kibana. Default value: en. If you want to use Chinese, set the value to zh-CN. elasticsearch: password: aStrongPass # Change the password of the Elasticsearch cluster as needed. Use the password to log on to the Kibana console. The username used to access the Elasticsearch cluster is elastic. #diskZoneId: cn-hongkong-c # The zone where the disk used by the Elasticsearch cluster resides. If you leave this parameter empty, the system automatically selects a zone. repository: region: cn-hangzhou # The region where the image resides. If the image resides in a region in the Chinese mainland, set the value to cn-hangzhou. If the image resides in a region outside the Chinese mainland, set the value to ap-southeast-1. The image is pulled over the Internet. #kproxy: # ecsRoleName: # If you use the ECS RAM role for access, enter the role name. #arch: amd64 # amd64 or arm64, and the default is amd64. sls: - project: k8s-log-c5****** # The SLS project. endpoint: cn-huhehaote.log.aliyuncs.com # The endpoint of the SLS project. accessKeyId: The AccessKey ID used to access SLS. accessKeySecret: The AccessKey secret used to access SLS. # alias: etl-logs # Optional. If the name of the SLS project specified by the project parameter is excessively long in Kibana, configure this parameter to specify an alias for the project. # kibanaSpace: default # Optional. The space in which the index pattern is created. If no space exists, a space is automatically created. # logstoreFilters: "*" # Optional. The logstores used to automatically create index patterns. Separate multiple index patterns with commas (,) and enclose index patterns in double quotation marks (""). Example: "access*,error*". # If you want to specify another SLS project, follow the preceding steps. #- project: etl-dev2 # The SLS project. # endpoint: cn-huhehaote.log.aliyuncs.com # The endpoint of the SLS project. # accessKeyId: The AccessKey ID used to access SLS. # accessKeySecret: The AccessKey secret used to access SLS. # alias: etl-logs2 # Optional. If the name of the SLS project specified by the project parameter is excessively long in Kibana, configure this parameter to specify an alias for the project. # kibanaSpace: default # Optional. The space in which the index pattern is created. If no space exists, a space is automatically created. # logstoreFilters: "*" # Optional. The logstores used to automatically create index patterns. Separate multiple index patterns with commas (,) and enclose index patterns in double quotation marks (""). Example: "access*,error*".Parameter
Description
kibana.ingressClass
The class of the Ingress controller. Specify the value based on the Ingress controller installed. For more information, see Manage components. Valid values:
ALB Ingress Controller: Set the value to alb.
MSE Ingress Controller: Set the value to mse.
NGINX Ingress Controller: Set the value to nginx.
kibana.ingressDomain
The domain name used to access Kibana. You can leave this parameter empty. If you want to access Kibana by using a domain name, configure this parameter.
repository.region
The region where the image resides. If the image resides in a region in the Chinese mainland, set the value to
cn-hangzhou. If the image resides in a region outside the Chinese mainland, set the value toap-southeast-1. The image is pulled over the Internet.kibana.ingressPath
The subpath used to access Kibana. If you configure the ingressDomain parameter, set the ingressPath parameter to
/.elasticsearch.password
The password of the Elasticsearch cluster. Change the password as needed. Use this parameter to log on to the Kibana console. The username used to access the Elasticsearch cluster is
elastic.kproxy.ecsRoleName
ECS instance RAM role. For the permissions required for the RAM role, see Grant permissions to a RAM user.
sls.project
The name of the SLS project. For more information, see Manage projects.
sls.endpoint
The endpoint of the SLS project. For more information, see Manage projects.
sls.accessKeyId
The AccessKey ID created for the RAM user. The RAM user must have the required permissions to query logs in the logstore. For more information, see Grant permissions to a RAM user.
sls.accessKeySecret
The AccessKey secret created for the RAM user. The RAM user must have the required permissions to query logs in the logstore. For more information, see Grant permissions to a RAM user.
sls.alias
Optional. If the name of the SLS project specified by the sls.project parameter is excessively long in Kibana, you can configure this parameter to specify an alias for the project.
sls.kibanaSpace
Optional. The space in which the index pattern is created. If no space exists, a space is automatically created.
sls.logstoreFilters
Optional. The logstores used to automatically create index patterns. Separate multiple index patterns with commas (,) and enclose index patterns in double quotation marks (""). Example:
"access*,error*".Run the following command to deploy Kibana by using Helm:
helm install sls-kibana https://sls-kproxy.oss-cn-hangzhou.aliyuncs.com/sls-kibana-1.5.7.tgz -f values.yaml --namespace sls-kibanaAfter configuring the settings, enter
http://${Ingress address}/kibana/in a browser to go to the logon page of Kibana. Then, enter the username and password specified in Step 2 for the Elasticsearch cluster.http://${Ingress address}/kibana/
Use Docker
Step 1: Deploy an Elasticsearch cluster
Before you can deploy an Elasticsearch cluster by using Docker, you must install and start Docker. For more information, see Install and use Docker and Docker Compose.
Run the following commands to deploy an Elasticsearch cluster on a server:
sudo docker pull sls-registry.cn-hangzhou.cr.aliyuncs.com/kproxy/elasticsearch:7.17.26

sudo mkdir /data  # The directory in which Elasticsearch data is stored. Change the value as needed.
sudo chmod 777 /data # Configure permissions.

sudo docker run -d --name es -p 9200:9200 \
           -e "discovery.type=single-node" \
           -e "ES_JAVA_OPTS=-Xms2G -Xmx2G" \
           -e ELASTIC_USERNAME=elastic \
           -e ELASTIC_PASSWORD=passwd \
           -e xpack.security.enabled=true \
           -v /data:/usr/share/elasticsearch/data \
           sls-registry.cn-hangzhou.cr.aliyuncs.com/kproxy/elasticsearch:7.17.26
Parameter
Description
ELASTIC_USERNAMEThe username used to access the Elasticsearch cluster. Set the value to elastic.
ELASTIC_PASSWORDThe password used to access the Elasticsearch cluster. The value of this parameter must be a string.
/dataThe location of data stored in the Elasticsearch cluster on the physical machine. Change the data storage location as needed.
After configuring the settings, check whether the Elasticsearch cluster is deployed. If you use a public IP address, add port 9200 to the security group rule of the server. For more information, see Add a security group rule.
curl http://${IP address of the server on which the Elasticsearch cluster is deployed}:9200If the output contains the JSON-formatted field
security_exception, the Elasticsearch cluster is deployed.{"error":{"root_cause":[{"type":"security_exception","reason":"missing authentication credentials for REST request [/]","header":{"WWW-Authenticate":"Basic realm=\"security\" charset=\"UTF-8\""}}],"type":"security_exception","reason":"missing authentication credentials for REST request [/]","header":{"WWW-Authenticate":"Basic realm=\"security\" charset=\"UTF-8\""}},"status":401}
Step 2: Deploy a proxy
When you use Kibana to access SLS, one or more projects are supported. You must add project information when you deploy a proxy. Sample code:
Single project
sudo docker pull sls-registry.cn-hangzhou.cr.aliyuncs.com/kproxy/kproxy:2.1.8

sudo docker run  -d --name proxy \
            -e ES_ENDPOINT=${IP address of the server on which the Elasticsearch cluster is deployed}:9200 \
            -e SLS_ENDPOINT=https://prjA.cn-guangzhou.log.aliyuncs.com/es/ \
            -e SLS_PROJECT=prjA \
            -e SLS_ACCESS_KEY_ID=${aliyunAccessId} \
            -e SLS_ACCESS_KEY_SECRET=${aliyunAccessKey} \
            -p 9201:9201 \
            -ti sls-registry.cn-hangzhou.cr.aliyuncs.com/kproxy/kproxy:2.1.8
Multiple projects
You can specify up to 32 projects.
The following variables are related to the first project: SLS_PROJECT, SLS_ENDPOINT, SLS_ACCESS_KEY_ID, and SLS_ACCESS_KEY_SECRET. Variables related to the other projects must be suffixed with numbers. Examples: SLS_PROJECT2 and SLS_ENDPOINT2.
If the endpoint and AccessKey pair settings of a project are the same as the settings of the first project, you do not need to specify the endpoint or AccessKey pair for the project.
sudo docker pull sls-registry.cn-hangzhou.cr.aliyuncs.com/kproxy/kproxy:2.1.8

sudo docker run  -d --name proxy \
            -e ES_ENDPOINT=${IP address of the server on which the Elasticsearch cluster is deployed}:9200 \
            -e SLS_ENDPOINT=https://prjA.cn-guangzhou.log.aliyuncs.com/es/ \
            -e SLS_ENDPOINT2=https://prjB.cn-guangzhou.log.aliyuncs.com/es/ \
            -e SLS_PROJECT=prjA \
            -e SLS_PROJECT2=prjB \
            -e SLS_ACCESS_KEY_ID=${aliyunAccessId} \
            -e SLS_ACCESS_KEY_SECRET=${aliyunAccessKey} \
            -e SLS_ACCESS_KEY_ID2=${aliyunAccessId} \ # If the AccessKey ID that you want to specify is the same as the AccessKey ID specified by the SLS_ACCESS_KEY_ID variable, you do not need to specify an AccessKey ID for the SLS_ACCESS_KEY_ID2 variable.
            -e SLS_ACCESS_KEY_SECRET2=${aliyunAccessKey} \ # If the AccessKey secret that you want to specify is the same as the AccessKey secret specified by the SLS_ACCESS_KEY_SECRET variable, you do not need to specify an AccessKey secret for the SLS_ACCESS_KEY_SECRET2 variable.
            -p 9201:9201 \
            -ti sls-registry.cn-hangzhou.cr.aliyuncs.com/kproxy/kproxy:2.1.8
Example 1
Use two projects named prjA and prjB that have the same AccessKey pair settings.
sudo docker pull sls-registry.cn-hangzhou.cr.aliyuncs.com/kproxy/kproxy:2.1.8
sudo docker run  -d --name proxy \
            -e ES_ENDPOINT=${IP address of the server on which the Elasticsearch cluster is deployed}:9200 \
            -e SLS_ENDPOINT=https://prjA.cn-guangzhou.log.aliyuncs.com/es/ \
            -e SLS_ENDPOINT2=https://prjB.cn-guangzhou.log.aliyuncs.com/es/ \
            -e SLS_PROJECT=prjA \
            -e SLS_PROJECT2=prjB \
            -e SLS_ACCESS_KEY_ID=${aliyunAccessId} \
            -e SLS_ACCESS_KEY_SECRET=${aliyunAccessKey} \
            -p 9201:9201 \
            -ti sls-registry.cn-hangzhou.cr.aliyuncs.com/kproxy/kproxy:2.1.8
Example 2
Use three projects named prjA, prjB, and prjC. The prjA and prjC projects have the same AccessKey pair settings.
sudo docker run  -d --name proxy \
            -e ES_ENDPOINT=${IP address of the server on which the Elasticsearch cluster is deployed}:9200 \
            -e SLS_ENDPOINT=https://prjA.cn-guangzhou.log.aliyuncs.com/es/ \
            -e SLS_ENDPOINT2=https://prjB.cn-guangzhou.log.aliyuncs.com/es/ \
            -e SLS_ENDPOINT3=https://prjC.cn-guangzhou.log.aliyuncs.com/es/ \
            -e SLS_PROJECT=prjA \
            -e SLS_PROJECT2=prjB \
            -e SLS_PROJECT3=prjC \
            -e SLS_ACCESS_KEY_ID=${aliyunAccessId} \
            -e SLS_ACCESS_KEY_SECRET=${aliyunAccessKey} \
            -e SLS_ACCESS_KEY_ID2=${aliyunAccessId} \
            -e SLS_ACCESS_KEY_SECRET2=${aliyunAccessKey} \
            -p 9201:9201 \
            -ti sls-registry.cn-hangzhou.cr.aliyuncs.com/kproxy/kproxy:2.1.8
The following table describes the parameters.
Parameter | Description |
| The address used to access the Elasticsearch cluster. Format: |
| The URL used to access data. Format: Important You must use the HTTPS protocol. |
| The name of the SLS project. For more information, see Manage projects. |
| The AccessKey ID and AccessKey secret of your Alibaba Cloud account. We recommend that you use the AccessKey pair of a RAM user who has the permissions to query logs in logstores. You can use the permission assistant feature to grant the query permissions to the RAM user. |
|
After configuring the settings, run the following command to check whether the proxy is deployed. If you use a public IP address, add port 9201 to the security group rule of the server. For more information, see Add a security group rule.
curl http://${IP address of the server on which the proxy is deployed}:9201If the output contains the JSON-formatted field security_exception, the proxy is deployed.
{"error":{"root_cause":[{"type":"security_exception","reason":"missing authentication credentials for REST request [/]","header":{"WWW-Authenticate":"Basic realm=\"security\" charset=\"UTF-8\""}}],"type":"security_exception","reason":"missing authentication credentials for REST request [/]","header":{"WWW-Authenticate":"Basic realm=\"security\" charset=\"UTF-8\""}},"status":401}Step 3: Deploy Kibana
The following sample code provides an example on how to deploy Kibana. In this example, Kibana 7.17.26 is used.
sudo docker pull  sls-registry.cn-hangzhou.cr.aliyuncs.com/kproxy/kibana:7.17.26

sudo docker run -d --name kibana \
            -e ELASTICSEARCH_HOSTS=http://${IP address of the server on which the proxy is deployed}:9201 \
            -e ELASTICSEARCH_USERNAME=elastic \
            -e ELASTICSEARCH_PASSWORD=passwd \
            -e XPACK_MONITORING_UI_CONTAINER_ELASTICSEARCH_ENABLED=true \
            -p 5601:5601 \
            sls-registry.cn-hangzhou.cr.aliyuncs.com/kproxy/kibana:7.17.26
Parameter | Description |
| The URL used to access the proxy. Format: |
| The username used to log on to the Kibana console. You must set the value to the Elasticsearch username specified when deploying the Elasticsearch cluster. |
| The password used to log on to the Kibana console. You must set the value to the Elasticsearch password specified when deploying the Elasticsearch cluster. |
After configuring the settings, enter http://${IP address of Kibana}:5601 in a browser to go to the logon page of Kibana. Then, enter the username and password specified for the Elasticsearch cluster.
You must add port 5601 to the security group rule of the server. For more information, see Add a security group rule.
http://${IP address of Kibana}:5601
Step 2: Access Kibana
Query and analyze data
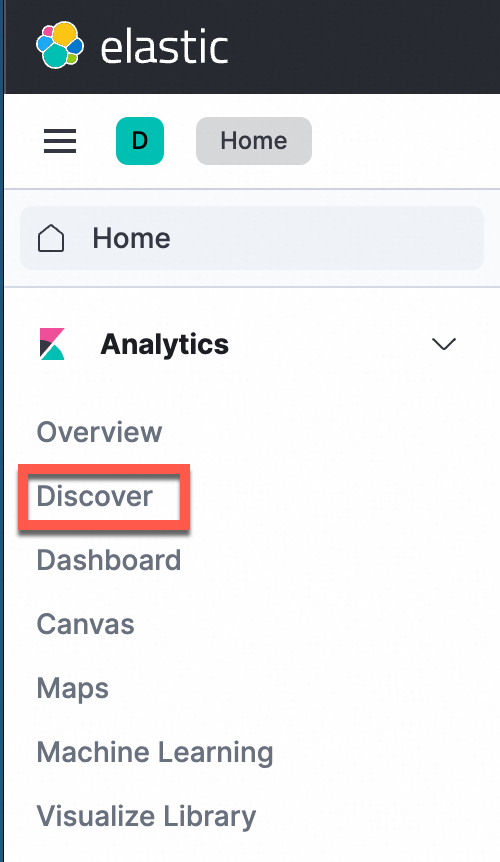
In the left-side navigation pane, choose Analytics > Discover.
ImportantIf you use Elasticsearch-compatible API to analyze SLS data in Kibana, use only the Discover and Dashboard modules.
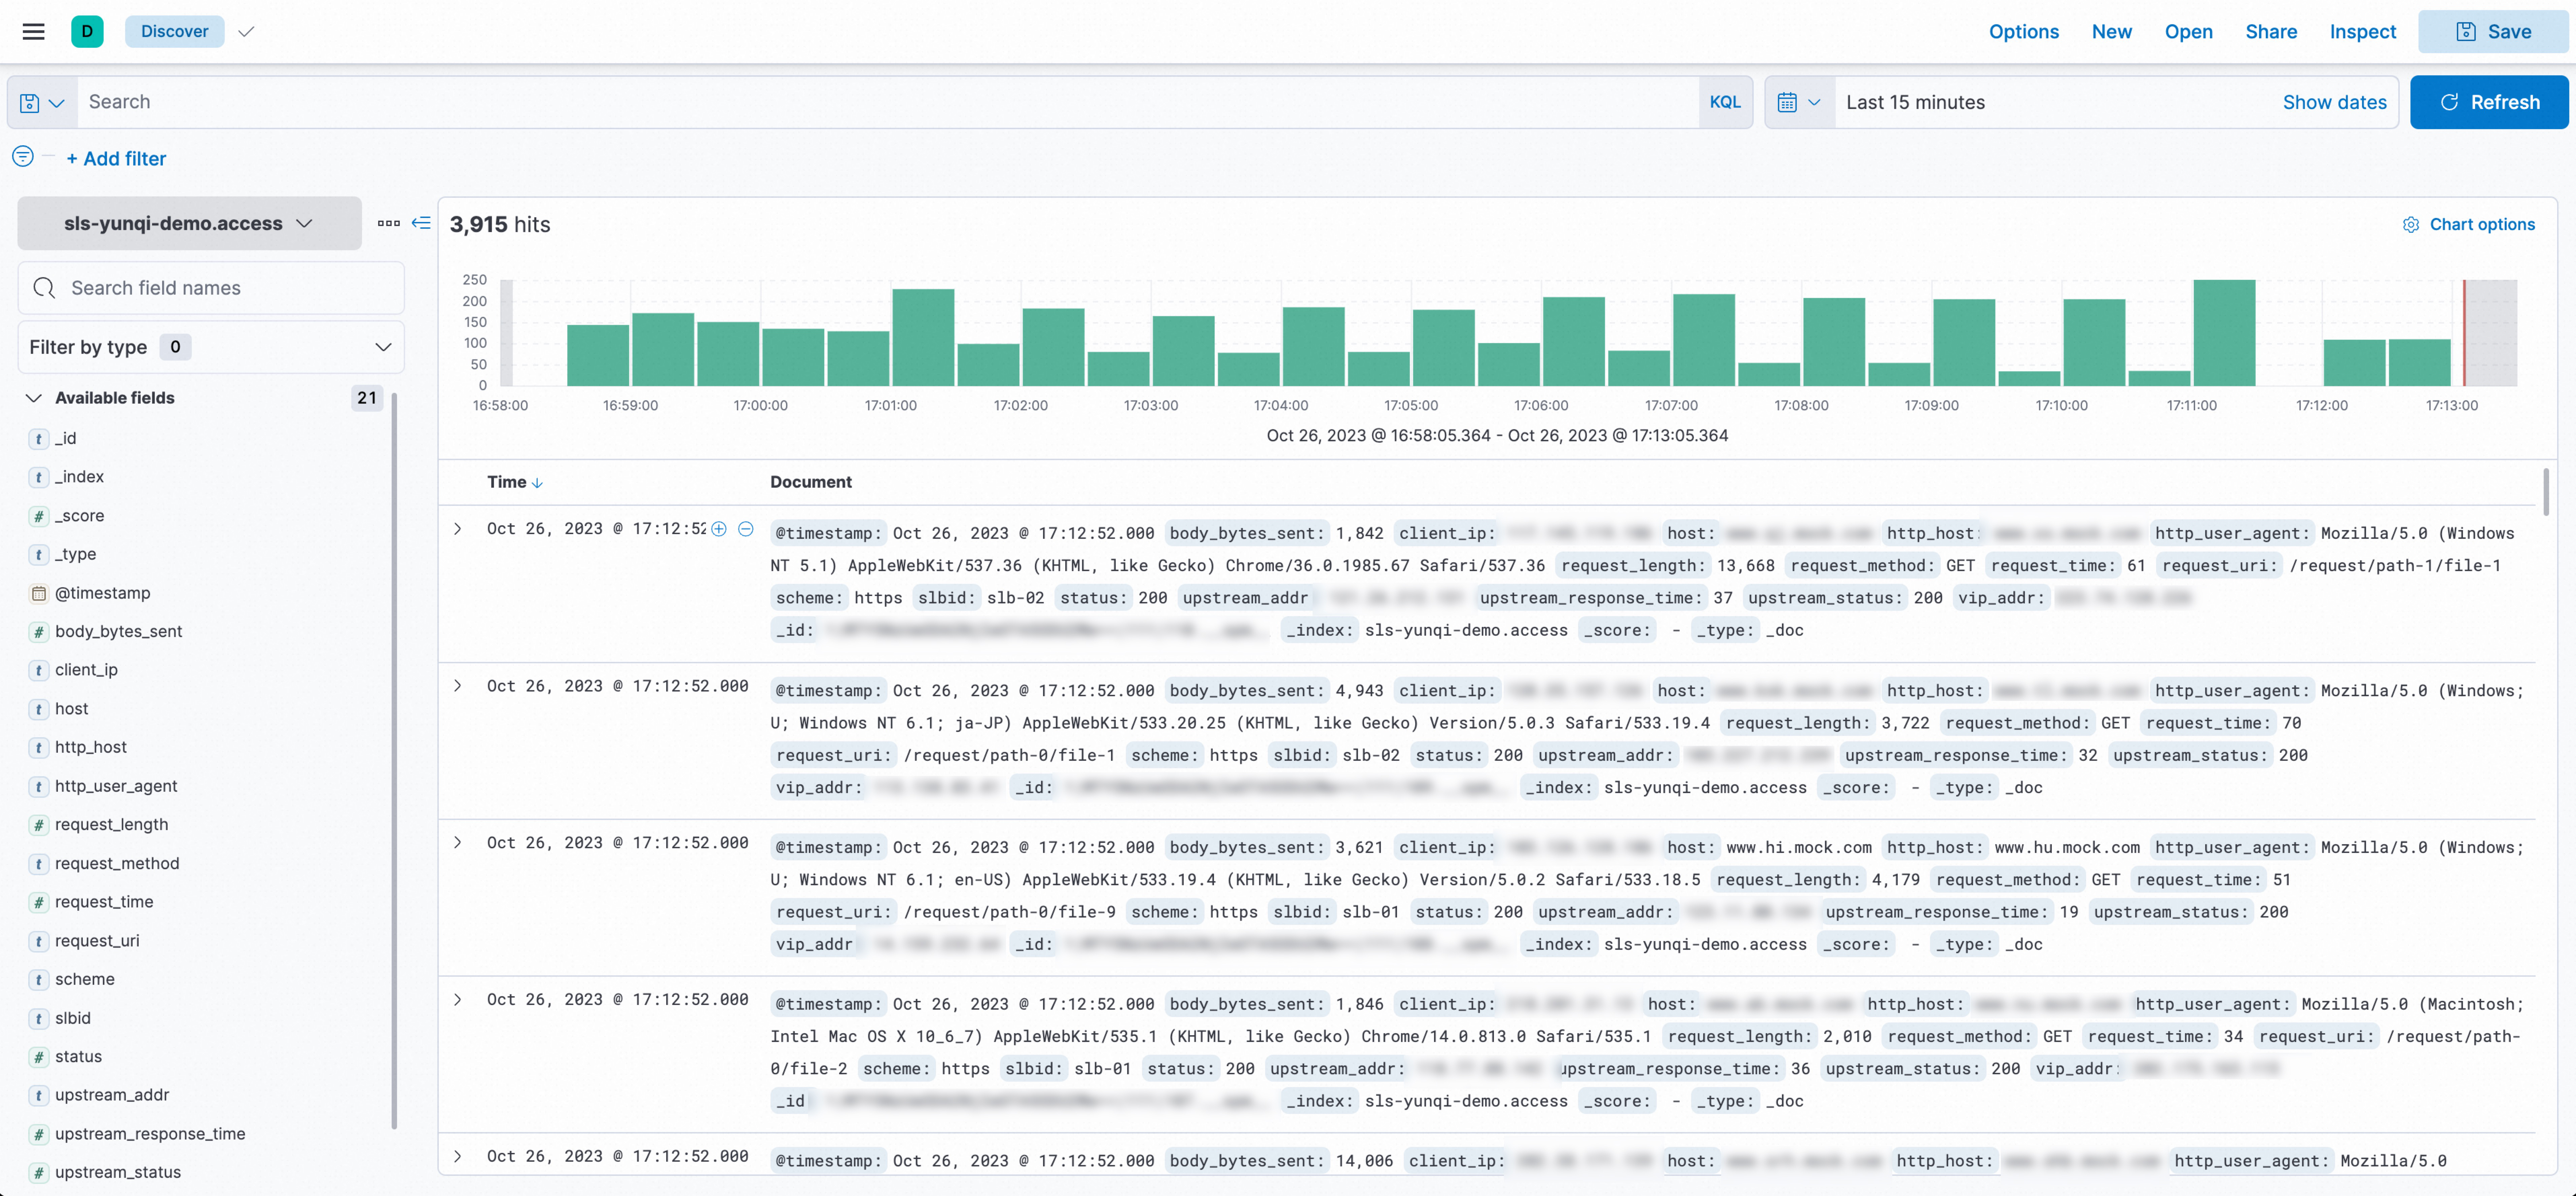
In the upper-left corner of the page that appears, select the index that you want to manage. In the upper-right corner of the page that appears, select a time range to query logs.
Manually create index patterns (optional)
By default, if you use Docker Compose or Helm for deployment, you do not need to manually create index patterns. If you use Docker for deployment, you must manually create index patterns.
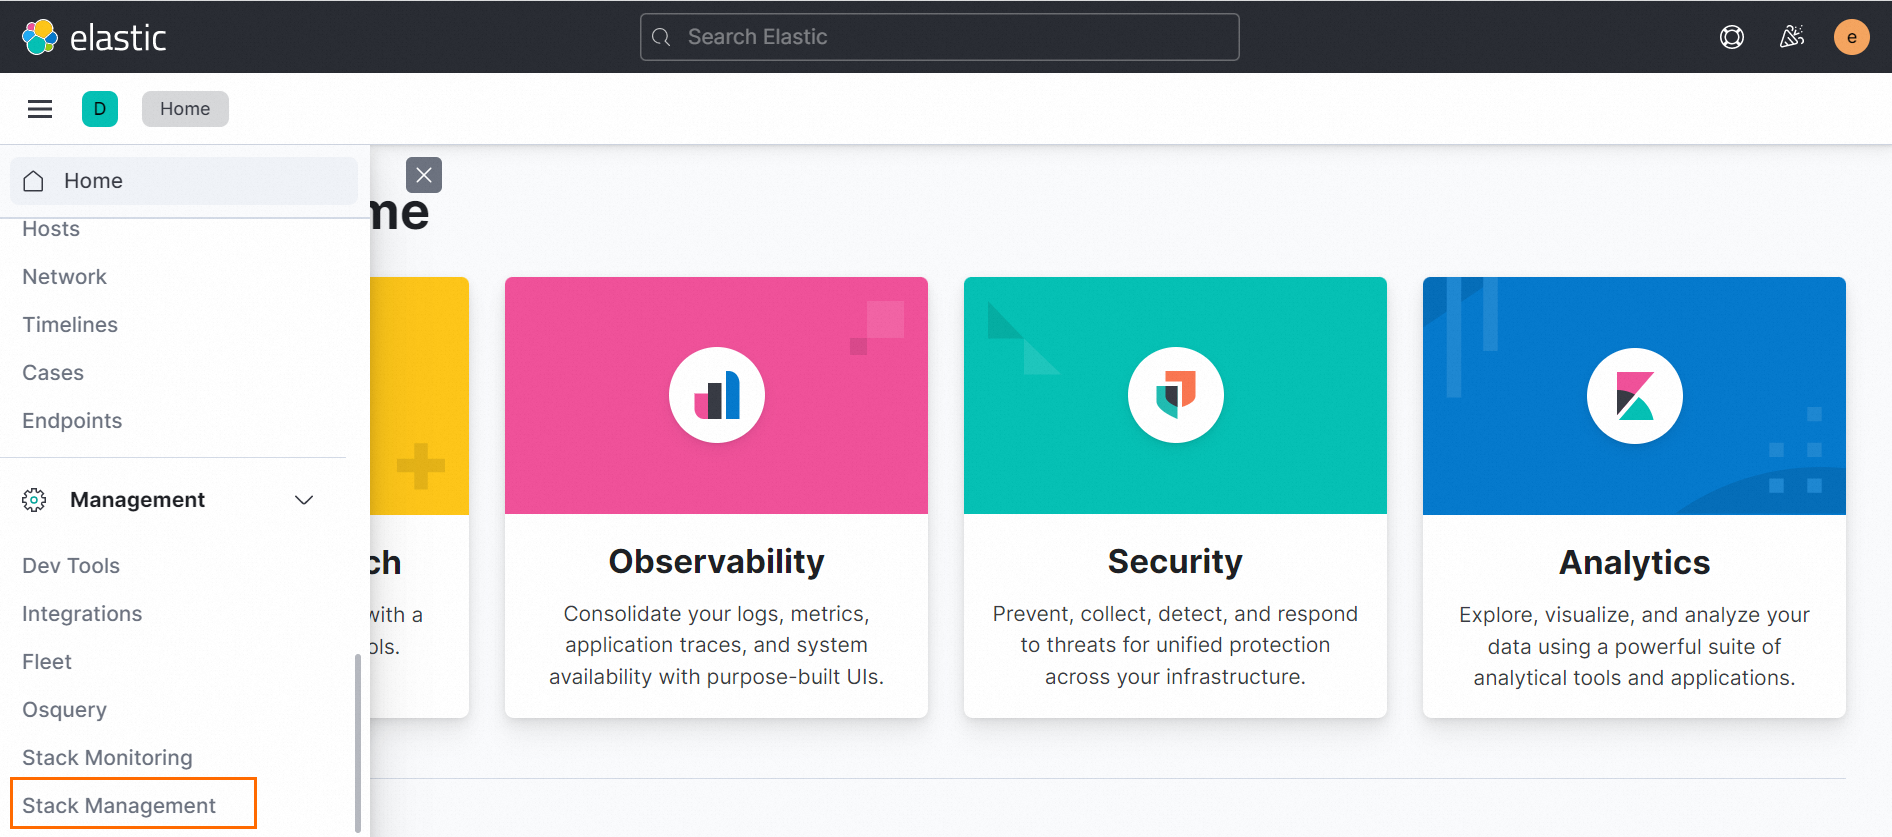
In the left-side navigation pane, choose Management > Stack Management.
In the left-side navigation pane, choose Kibana > Index Patterns.
The first time you create an index pattern, click create an index pattern against hidden or system indices in the dialog box.
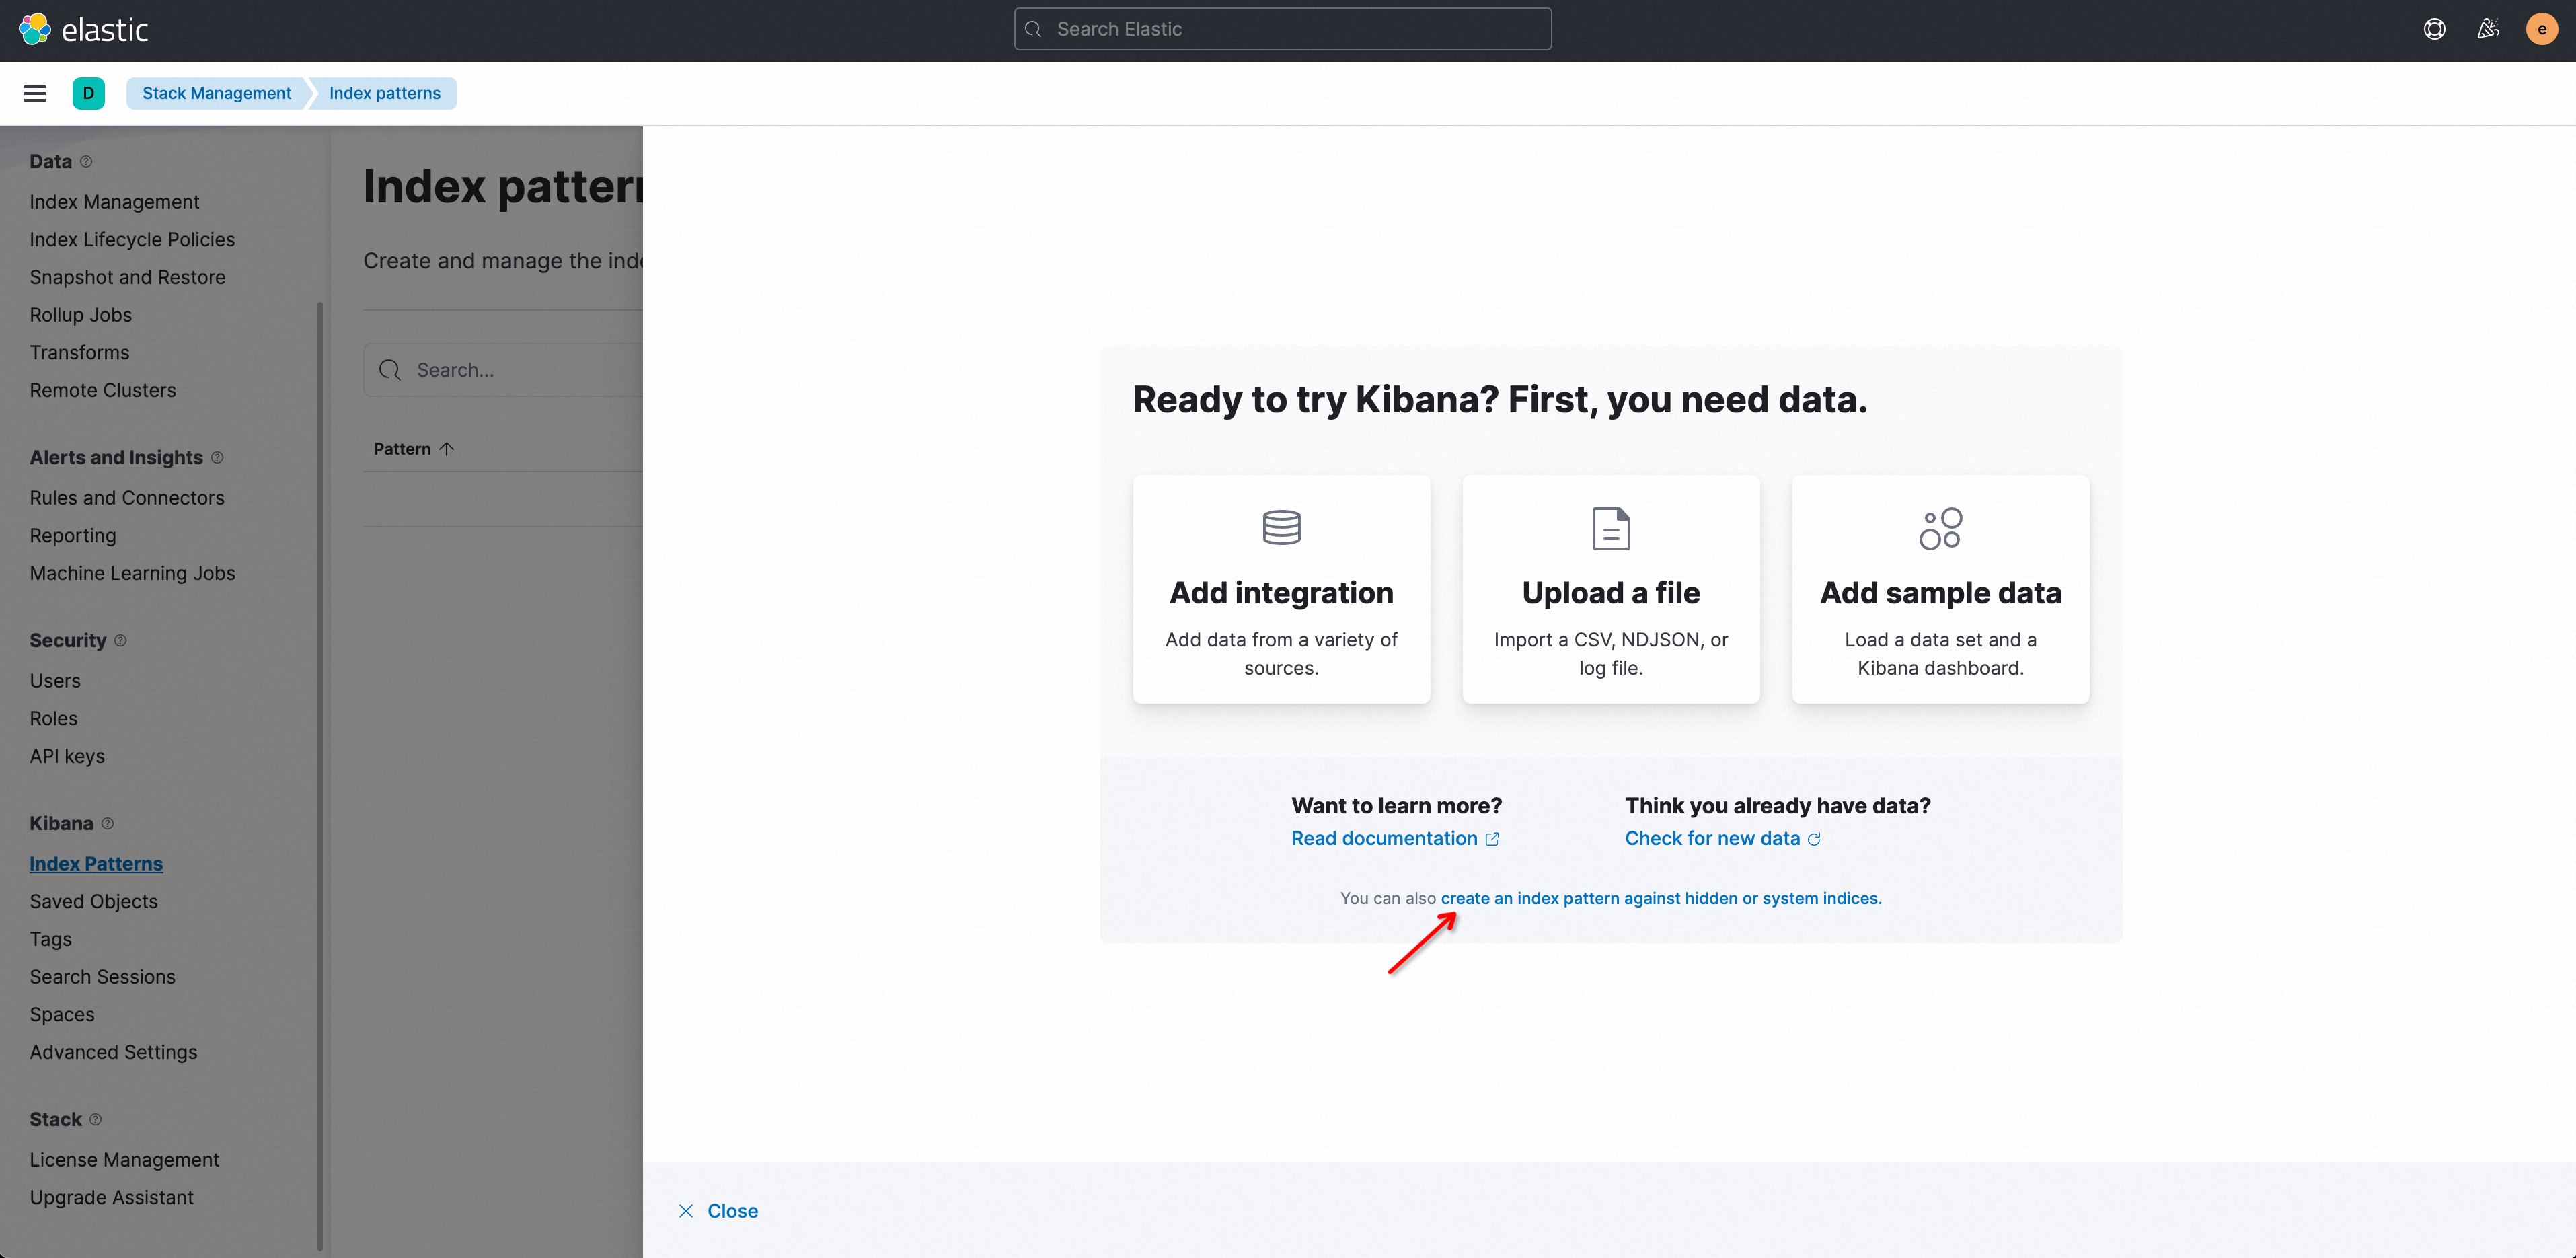 Note
NoteNo data is displayed in the pattern list on the Index pattern page. To display data in the pattern list, map Simple Log Service logstores and Kibana index patterns.
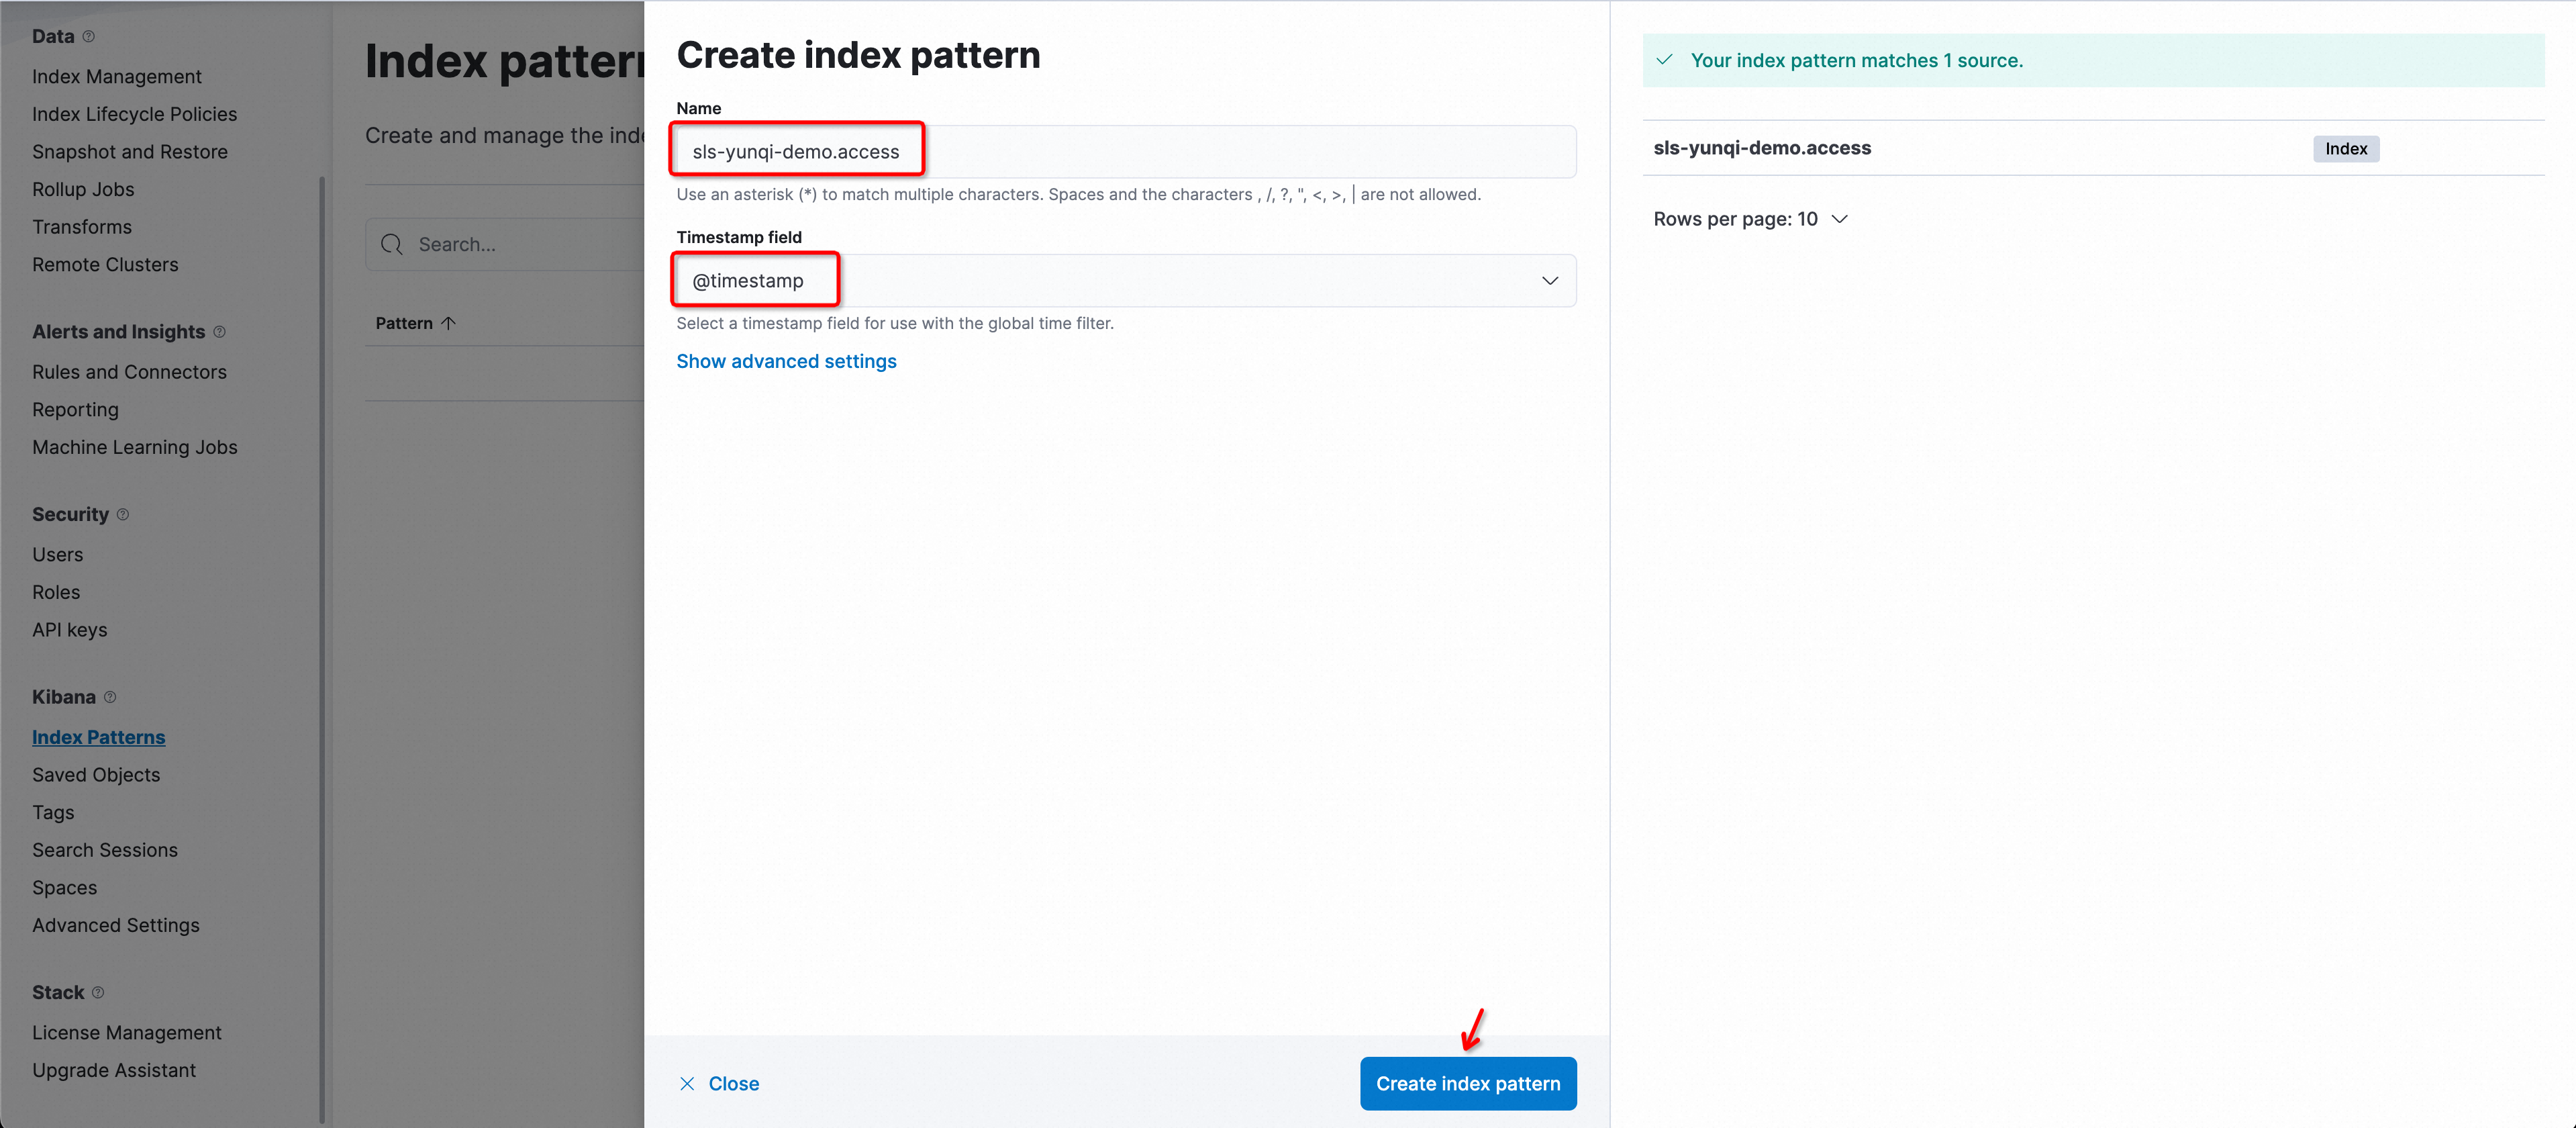
In the Create index pattern panel, configure the parameters. The following table describes the parameters.
Parameter
Description
NameThe name of the index pattern. Format:
${Simple Log Service project}.${Logstore name}.ImportantOnly exact match is supported. Wildcard characters are not supported. You must enter a complete name.
For example, if the project name is etl-guangzhou and the logstore name is es_test22, you must set the index pattern name to
etl-guangzhou.es_test22.Timestamp fieldThe timestamp field. Set the value to
@timestamp.Click Create index pattern.
QueryString examples
Specifying fields in queries is more efficient than not specifying them.
content: "Hello World"The following query without specified fields is inefficient. It may be translated into SQL fields and concatenated before matching, resulting in low query efficiency.
"Hello World"Using exact matches is more efficient than using wildcard
*queries.content : "Hello World"Using wildcard
*in the following query is inefficient. It triggers a full-text scan and increases response time when data volume is large.content : "Hello*"
FAQs
Why am I unable to access Kibana after using Docker Compose for deployment?
In the
sls-kibanadirectory, run thedocker compose pscommand to check the status of the following containers. Ensure that all containers are in the UP state.
If all containers are in the UP state, view the error logs of each container.
docker logs sls-kibana_es_1 # View the startup logs of the Elasticsearch cluster.
docker logs sls-kibana_kproxy_1 # View the startup logs of KProxy.
docker logs sls-kibana_kibana_1 # View the startup logs of Kibana.
Why am I unable to access Kibana after using Helm for deployment?
Log on to the ACK console. In the left-side navigation pane, click Clusters.
On the Clusters page, click the name of the cluster that you want to manage. In the left-side navigation pane of the page that appears, choose .
In the upper part of the page that appears, select
sls-kibanaas the namespace. Check whether the Elasticsearch cluster, Kibana, and Kproxy are started. For more information about how to view and change the status of stateful workloads and redeploy applications in batches, see Use a StatefulSet to create a stateful application.
How do I uninstall Helm?
helm uninstall sls-kibana --namespace sls-kibanaHow do I display high-precision timestamps in Kibana?
To ensure that logs that have high-precision time values are collected to SLS, you must configure timestamps accurate to the nanosecond. For more information, see Collect logs whose timestamps are accurate to the nanosecond.
Add the indexes of the
__time_ns_part__field whose data type islongto field indexes. Specific Kibana query statements may be converted to SQL statements for execution. In this case, you must include high-precision time values in the SQL results.
How do I update a Helm chart?
The process in which a Helm chart is updated is similar to the process in which a Helm chart is installed. Simply change the helm install command to the helm upgrade command. You can use the values.yaml file used for Helm chart installation in the update process.
helm upgrade sls-kibana https://sls-kproxy.oss-cn-hangzhou.aliyuncs.com/sls-kibana-1.5.5.tgz -f values.yaml --namespace sls-kibanaHow to bulk delete index patterns?
List the index patterns to be deleted.
Prepare
kibana_config.json:{ "url" : "http://xxx:5601", "user" : "elastic", "password" : "", "space" : "default" }Use ptn_list.py to list existing index patterns and output the result to the file
/tmp/ptnlist.txt.➜ python ptn_list.py kibana_config.json > /tmp/ptnlist.txtEdit the
/tmp/ptnlist.txtfile, leaving only the lines for the index patterns to be deleted.54c0d6c0-****-****-****-15adf26175c7 etl-dev.batch_test52 54266b80-****-****-****-15adf26175c7 etl-dev.batch_test51 52f369c0-****-****-****-15adf26175c7 etl-dev.batch_test49 538ceaa0-****-****-****-15adf26175c7 etl-dev.batch_test50Use ptn_delete.py to delete the index patterns.
NoteAfter deletion, dashboards linked to the index patterns will stop working. Confirm the index patterns are no longer needed before deleting.
# Verify the content of /tmp/ptnlist.txt to confirm all index patterns are to be deleted.
➜  cat /tmp/ptnlist.txt

# Execute the deletion.
➜  python ptn_delete.py kibana_config.json /tmp/ptnlist.txt