Set a table threshold
Table thresholds visually highlight metrics on a dashboard based on configured rules, helping you quickly identify values that require attention, such as high request volumes or long response times.
Prerequisites
-
You have collected log data. For more information, see Collect text logs from a host.
-
You have created indexes. For more information, see Create an index.
Overview
In the Field Configuration panel of a chart, select the pv field, set Cell Display Mode to Full Line Background Highlight, and set Color Scheme to Threshold. Then, add a condition to highlight the entire row in pink when the pv value exceeds 400. By default, other rows have a green background.
-
Query and analysis: Query and analyze logs in the console, performing operations such as log retrieval, aggregation, and statistical analysis.
-
Add a chart: Dashboards consist of charts, each powered by one or more query and analysis statements.
-
Set a table threshold: Set thresholds to make a table's appearance change dynamically based on your data and configured rules.
Step 1: Query and analyze logs
Log on to the Simple Log Service console. In the Projects section, click the project you want.

On the tab, click the logstore you want.

-
Enter a query and analysis statement, and then select a time range for the query, such as Last 15 Minutes.
Example:
-
The following is a sample query and analysis statement:
* | select request_url,count(*) as pv group by request_url order by pv
-
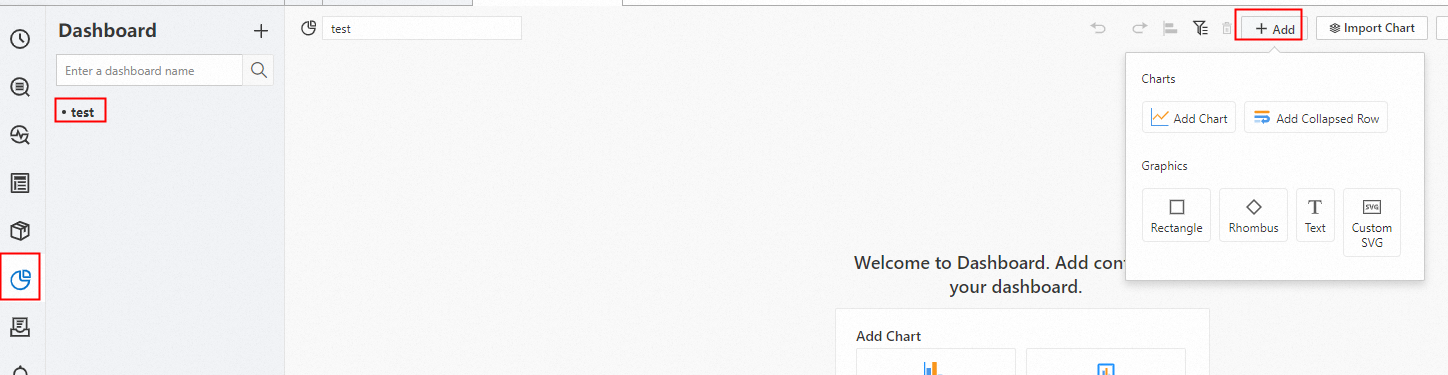
Step 2: Add a chart
In the left-side navigation pane, choose . In the Dashboard list, click the dashboard you want. In the upper-right corner of the dashboard page, click Edit. In edit mode, choose .
-
In the section, select the
 icon for Chart Type. On the Query and Analysis tab, select your data source (in this case, LogStore (SQL)), select the target Logstore, and enter a query statement.
In the upper-right corner, select a time range such as Last 15 Minutes and click Apply.
Set Chart Type to Table. An example query:
* | select *.
Step 3: Set a table threshold
-
: Sets the color scheme for the chart based on configured thresholds.
-
: Highlights the entire row based on a field's value and the threshold settings.
-
: Configures value-based conditions for a field. For example, for the
pvfield, set the threshold to 400. Rows wherepv > 400are then displayed with a pink background, and other rows with a green background.
In the Field Configuration panel, select the pv field. Set Cell Display Mode to Full Line Background Highlight and Color Scheme to Threshold. Then, add a threshold condition. For example, a threshold of 400 highlights the entire row in pink when the pv value exceeds 400. Other rows retain a green background by default.