Search, filter, variable replacement, and multi-statement queries
Configure search, filtering, variable replacement, and multi-statement queries for table charts in dashboards.
Prerequisites
-
Log data is collected. For more information, see Collect text logs from a host.
-
An index is created. For more information, see Create an index.
Overview
In a table chart, click the search icon in a column header to filter values such as POST and GET. In the General Settings panel, select a Search Mode (Search or Filter) and configure options such as multi-select.
-
Query and analysis: Query and analyze logs in the console — retrieve, aggregate, and view log statistics.
-
Add a chart: A dashboard consists of multiple charts, each based on one or more query and analysis statements.
-
Configure table features: Configure search, filtering, variable replacement, and multi-statement queries.
Step 1: Query and analysis
Log on to the Simple Log Service console. In the Projects section, click the project you want.

On the tab, click the logstore you want.

-
Enter a query and analysis statement, and then click Last 15 Minutes to set the query's time range.
Example:
-
${{date| 60}}specifies a variable. Use variables to dynamically modify the parameters of a query statement.* | select __time__ - __time__ % ${{date| 60}} as time,request_method
-
Step 2: Add a chart
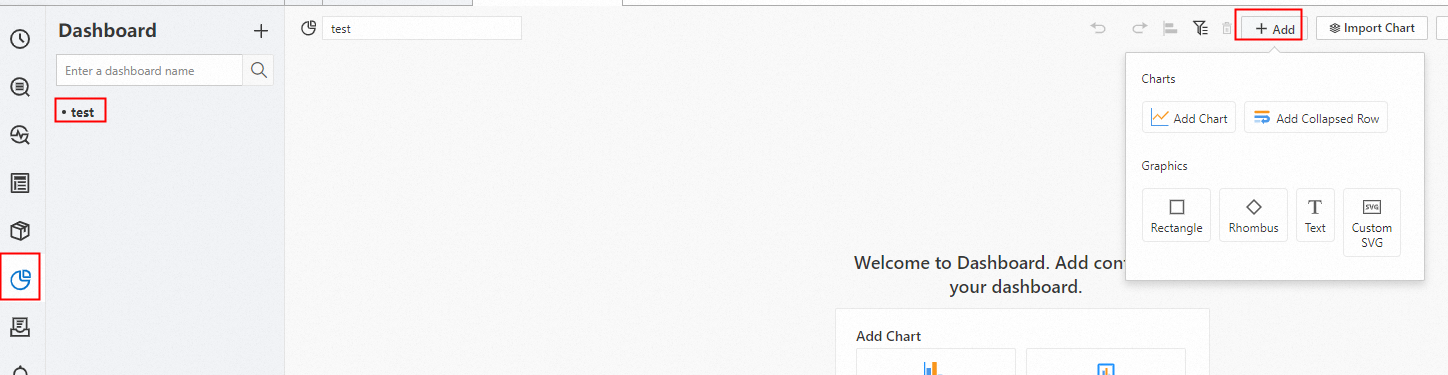
In the left-side navigation pane, choose . In the Dashboard list, click the dashboard you want. In the upper-right corner of the dashboard page, click Edit. In edit mode, choose .
-
In the section, select the
 icon for Chart Type. On the Query and Analysis tab, select your data source (in this case, LogStore (SQL)), choose the target Logstore, and enter a query statement.
In the upper-right corner, select a time range, such as Last 15 Minutes, from the drop-down list and click Apply.
Set Chart Type to Table. An example query statement is
* | select *.
Step 3: Configure table features
Search and filter
-
Search
-
In the panel, set Search Mode to Search. All fields become searchable.
-
Click the
 icon next to a column name and enter the search text.
You can also configure multi-select and exact search options in the Search Mode section.
-
-
Filter
-
In the panel, set Search Mode to Filter. All fields become filterable.
-
Click the
 > icons next to a column name to apply a filter. Multi-select is supported.
Enable multi-select in the Search Mode section of the Field/Column Settings panel.
-
 >
> 
Variable replacement
Click . Set Variable Key to date and Display Name to time. In the Variable Values section, set Display Name to min and Replacement Value to 100. This replaces the date variable in Query A with 100.
After configuration, a filter appears in the upper-left corner of the chart. When you select a value, SLS runs a query based on your selection. The resulting query statement is * | select __time__ - __time__ % 100 as time,request_method.
Multi-statement query
Click . Select the Logstore to query (for example, request_path), enter * | select *, and click Apply. Select Query B to view the results.