This guide explains how to migrate existing Kibana dashboards to a new Kibana instance connected to Simple Log Service (SLS) after you migrate your data.
Overview

-
Export the dashboard saved objects from your source Kibana instance as an
export.ndjsonfile. -
Replace the source
index pattern IDin theexport.ndjsonfile with the newindex pattern ID. -
Import the modified
export.ndjsonfile into your new Kibana instance.
Procedure
1. Prepare source environment and export dashboards
-
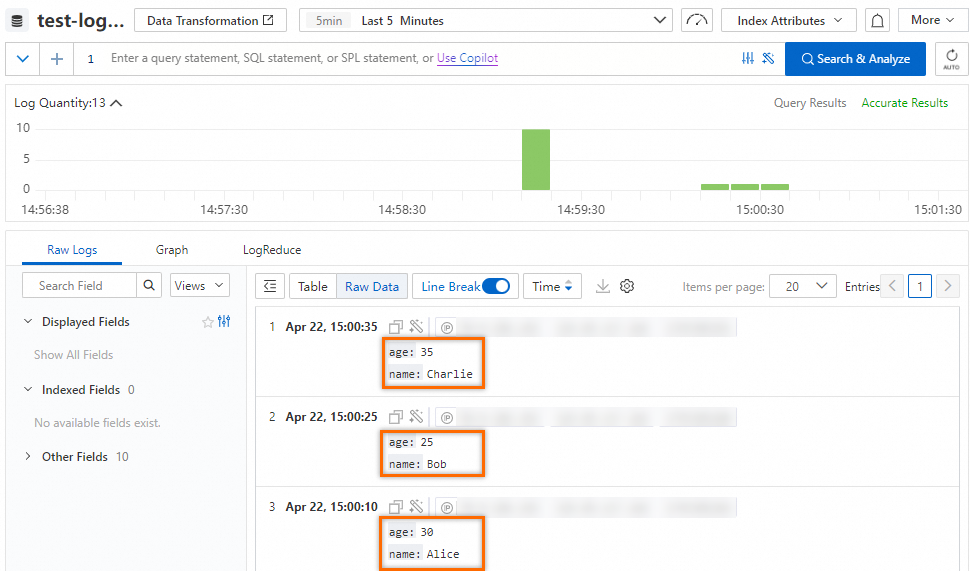
Write the following sample data to your source Elasticsearch instance.
POST people/_bulk { "index": {} } { "name": "Alice", "age": 30 } { "index": {} } { "name": "Bob", "age": 25 } { "index": {} } { "name": "Charlie", "age": 35 } -
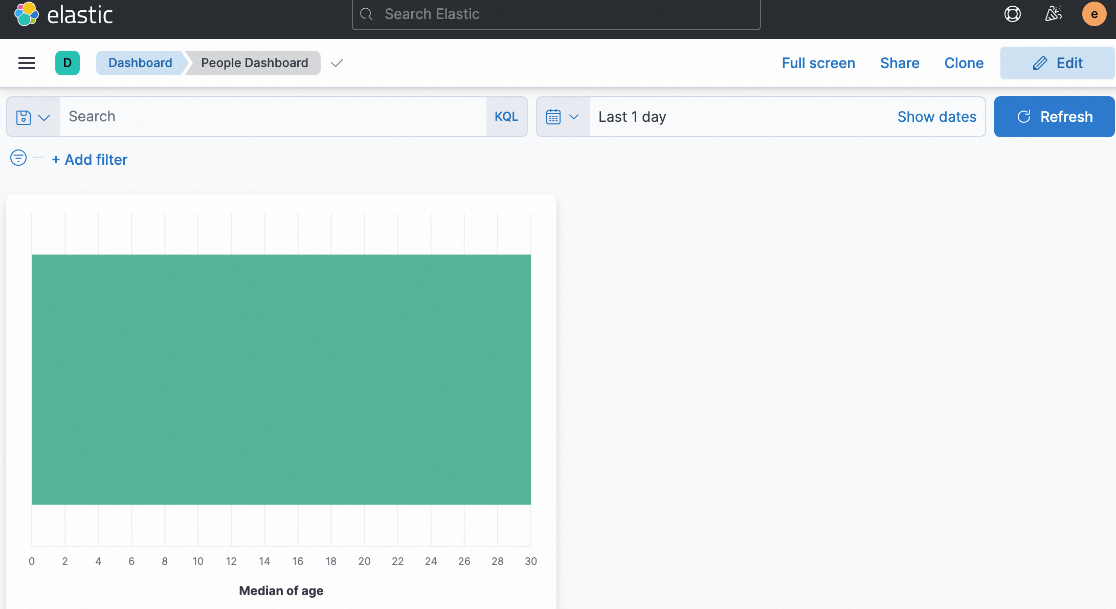
In your source Kibana, create two dashboards based on the people index, named
People DashboardandPeople Names.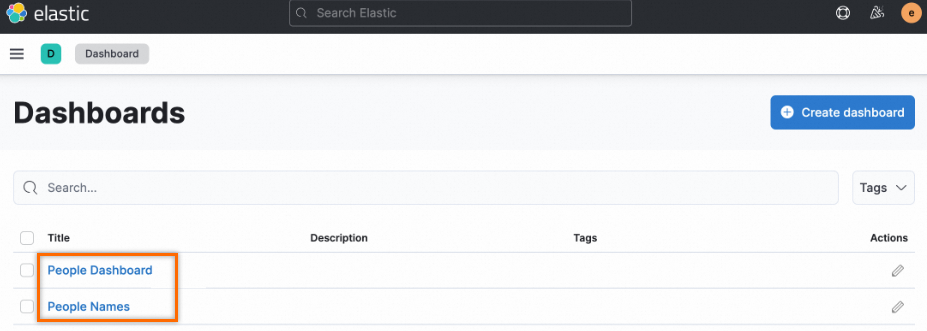
-
Create a sample chart within the
People Dashboard.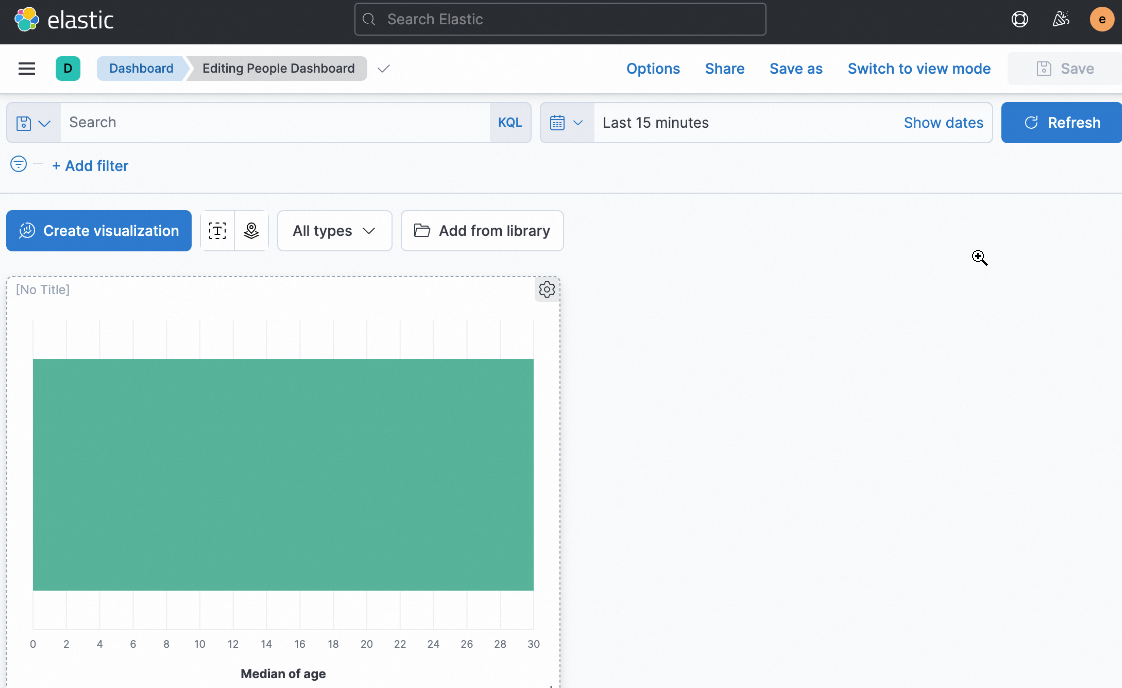
-
Navigate to . On the Saved Objects page, select the dashboards that you want to export. Ensure that the Include related objects checkbox is cleared, and then export the objects. This action saves the dashboard definitions to an
export.ndjsonfile.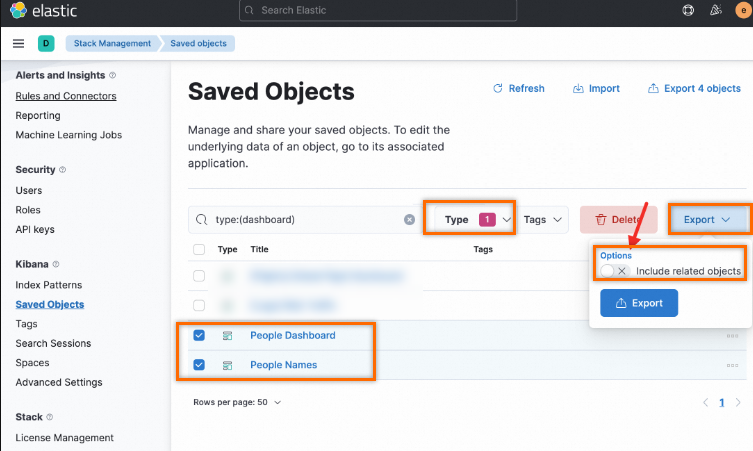
2. Prepare the target environment
Log on to the Simple Log Service console.
In the Projects section, click the one you want.

-
Write the same log data to your logstore. Ensure that the field names and types match those in the source Elasticsearch instance.
NoteThe fields in your source Elasticsearch must match the fields in your target logstore. Mismatched fields can cause errors, such as "field not found", when you open the migrated dashboard.
-
Deploy a new Kibana instance and connect it to SLS. For more information, see Connect to Kibana.
NoteUse the same versions of Elasticsearch and Kibana for both the source and target environments.
-
After you connect to SLS using
Docker Composeor aHelm chart, Kibana automatically creates the corresponding index pattern.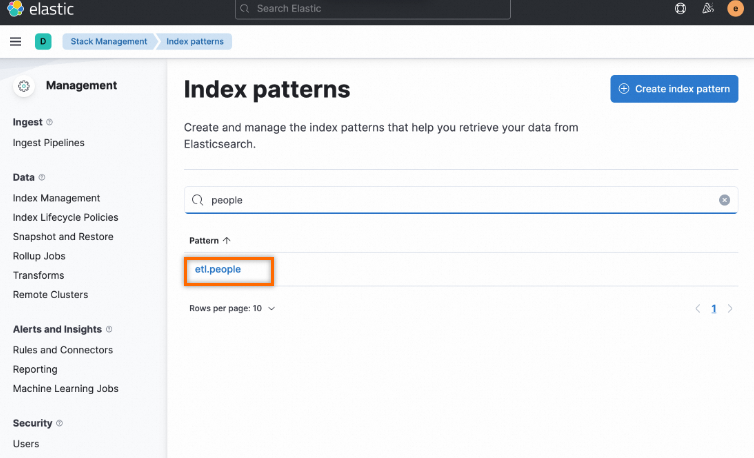
3. Perform the migration
-
Find the ID of the index pattern in your source Elasticsearch. The
kibana_config_1.jsonfile is as follows:{ "url" : "http://xxx:5601", "user" : "elastic", "password" : "", "space" : "default" }Run the following command using the ptn_list.py script to find the index pattern ID.
➜  python ptn_list.py kibana_config_1.json
f06fc2b0-****-****-****-15adf26175c7    people
In the output,
f06fc2b0-****-****-****-15adf26175c7is the ID of the source people index pattern. You can find references to this ID in the exportedexport.ndjsonfile.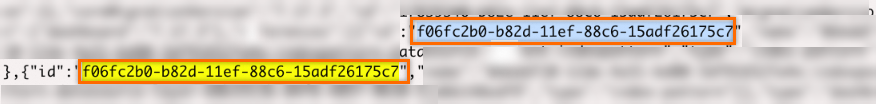
-
Find the ID of the new index pattern in the Kibana instance connected to SLS.
Use the ptn_list.py script again to find the ID of the index pattern in the new Kibana.
# Prepare kibana_config_2.json

➜  python ptn_list.py kibana_config_2.json
ef710470-****-****-****-ad198b7b763d	etl.people
Run the sed command to replace all occurrences of the old ID with the new one in the
export.ndjsonfile.sed -i 's/f06fc2b0-****-****-****-15adf26175c7/ef710470-****-****-****-ad198b7b763d/' export.ndjson -
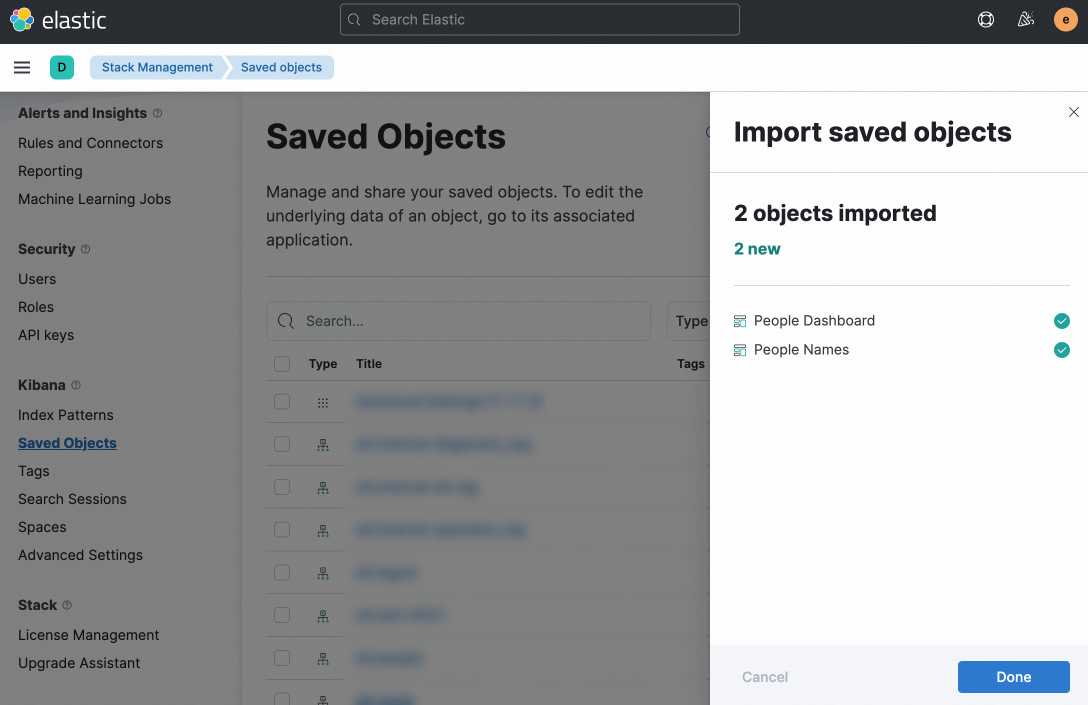
In your new Kibana instance, navigate to . On the Saved Objects page, click Import and upload the modified export.ndjson file. A success message appears after the import completes.
-
Open the newly imported dashboards to verify the results.