Add a progress bar to a table
To track the progress of data import or export in a dashboard, use a progress bar in a table.
Prerequisites
-
You have collected access logs for data import or export operations. For more information, see Collect text logs from a host.
-
You have created indexes. For more information, see Create indexes.
Overview
In a dashboard chart, run the query statement * | select split_part(request_url,'?',1) as path, count(1) as pv group by split_part(request_url,'?',1) order by pv desc limit 10 to count page views (PVs) per request path. In the field configuration panel, configure the pv field: set Maximum Value to 500, select gradient progress bar for cell display mode, and select threshold for the color scheme. Then set multiple thresholds: green (default), red (greater than 300), yellow (greater than 400), and blue (greater than 450).
-
Query and analysis: Query and analyze logs in the console.
-
Add a chart: Add a chart to a dashboard. Each chart runs one or more query statements.
-
Add a progress bar: Use a progress bar to visualize the number of data import requests.
Step 1: Query and analyze data
Log on to the Simple Log Service console. In the Projects section, click the project you want.

On the tab, click the logstore you want.

-
Enter a query statement, and then click Last 15 Minutes to set the query time range.
For example, to view the paths and number of imported files, use the following query statement:
* | select split_part(request_uri,'?',1) as path, count(1) as count group by split_part(request_uri,'?',1) order by count desc limit 10
Step 2: Add a chart
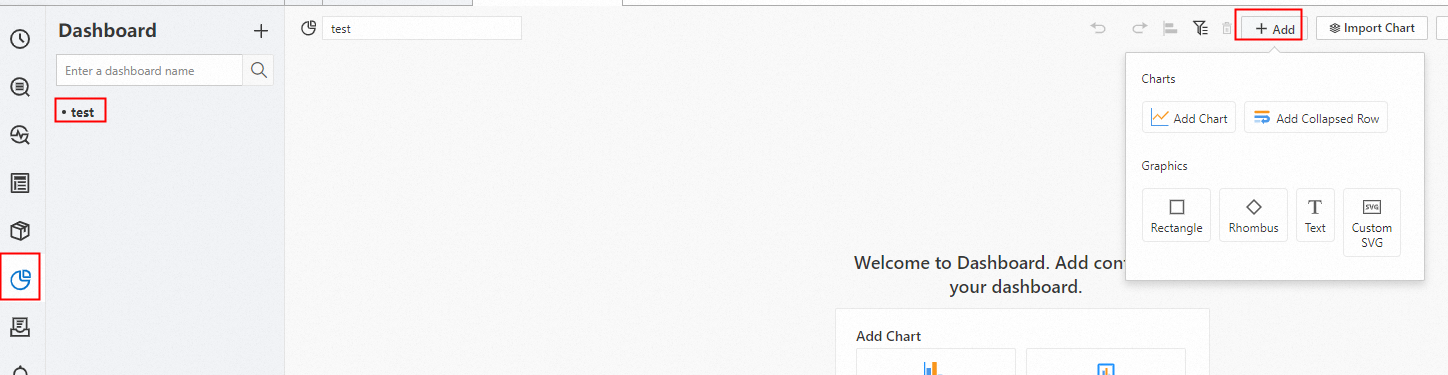
In the left-side navigation pane, choose . In the Dashboard list, click the dashboard you want. In the upper-right corner of the dashboard page, click Edit. In edit mode, choose .
-
In the section, select the
 icon for Chart Type. On the Query and Analysis tab, select your data source (in this case, LogStore (SQL)), select the target Logstore, and enter a query statement.
In the upper-right corner, select a time range such as Last 15 Minutes and click Apply.
Set Chart Type to Table. An example query:
* | select *.
Step 3: Add a progress bar
Progress bar
-
: Set the value for 100% progress.
-
: Sets the progress bar color based on specified thresholds.
-
: Displays the
countfield as a progress bar. -
: Set the data threshold for the
countfield to 400. The progress bar is red forcountvalues below 400 and green forcountvalues of 400 or greater.
LCD progress bar
-
: Set the value for 100% progress.
-
: Sets the progress bar color based on specified thresholds.
-
: Displays the
countfield as an LCD progress bar. -
: Set the data threshold for the
countfield to 400. The progress bar is red forcountvalues below 400 and green forcountvalues of 400 or greater.
Gradient progress bar
-
: Set the value for 100% progress.
-
: Sets the progress bar color based on specified thresholds.
-
: Displays the
countfield as a gradient progress bar. -
: Set multiple data thresholds for the
countfield. The progress bar turns red if thecountvalue is greater than 300, yellow if thecountvalue is greater than 400, and blue if thecountvalue is greater than 450.