Security Center gives you a unified view of security alerts across your cloud assets — so you can spot risks quickly, act on the most urgent ones first, and keep historical data for audit or investigation.
View security alert statistics
The Alert page provides a summary dashboard of your alert protection status at a glance.
Log on to the Security Center consoleSecurity Center consoleSecurity Center consoleSecurity Center consoleSecurity Center console.
In the left navigation bar, select Detection and Response > Alert. In the upper-left corner, select the region for the assets you want to protect: Chinese Mainland or Outside Chinese Mainland.
If you have enabled the Agentic SOC service, the navigation path changes to Agentic SOC > Manage > Alert.
On the Alert page, view the alert statistics above the CWPP tab.
| Statistic | Description | Action |
|---|---|---|
| Alerting Servers | Number of instances with active security alerts. | Click the value to go to the Host Assets page. |
| Urgent Alerts | Number of unhandled alerts at the Urgent risk level. Handle these first. | Click the value to filter for all Urgent alerts. |
| Total Unhandled Alerts | Total number of unhandled alerts. Displayed in the alert list on the CWPP tab by default. | See Assess and handle security alerts. |
| Precise Defense | Number of virus alerts automatically blocked by the Malicious Host Behavior Defense feature. A blocked alert means the threat was neutralized — no action needed. | Click the value to filter for all automatically blocked virus alerts. |
| Enabled IP Address Blocking Policies/All Policies | Active IP blocking policies: blocking records from enabled brute-force attack protection rules. All policies: blocking records from all rules, including disabled ones. | Click the value to open the IP Rule Policy Library panel. See brute-force attack protection. |
| Quarantined Files | Number of threat files quarantined during alert handling. Quarantined files no longer pose a business risk. | Click the value to open the File Quarantine panel. |
| Network Defense Alert | Attack Analysis statistics for the last 7 days by default, including basic attacks detected and automatically blocked. | Click the value to view attack counts, type distribution, top 5 attack sources, top 5 attacked assets, and the attack details list. See Network Defense Alert. |
View AI-detected malicious file alerts
Security Center uses a large model detection engine to intelligently identify malicious files. Alerts from this engine are tagged AI Detected, which you can use as a filter condition.
The large model detection engine currently supports malicious file alerts only.
Log on to the Security Center consoleSecurity Center consoleSecurity Center consoleSecurity Center consoleSecurity Center console.
In the left navigation bar, select Detection and Response > Alert. In the upper-left corner, select the region for the asset you want to protect: Chinese Mainland or Outside Chinese Mainland.
If you have enabled the Agentic SOC service, the navigation path changes to Agentic SOC > Manage > Alert.
Click the filter condition drop-down list, select AI Detected as the condition, and set the value to Yes.
View archived alert data
Security Center automatically archives handled alerts older than 30 days once the total count exceeds 100. Unhandled alerts are never archived. Archived alerts are not viewable in the console, but you can download them for offline analysis.
Log on to the Security Center consoleSecurity Center consoleSecurity Center consoleSecurity Center consoleSecurity Center console.
In the left navigation bar, select Detection and Response > Alert. In the upper-left corner, select the region for the assets you want to protect: Chinese Mainland or Outside Chinese Mainland.
If you have enabled the Agentic SOC service, the navigation path changes to Agentic SOC > Manage > Alert.
In the upper-right corner of the Alert page, click Cloud Workload Alert Management > Archive data.
In the Archive data dialog box, review the archived data.
In the Download Link column, click Download to save the file to your local device.
The archived file is in XLSX format. The download typically takes 2–5 minutes, depending on network bandwidth and file size. The file includes the following fields: Alert ID, Alert Name, Alert Details, Risk Level, Status, Affected Asset, Affected Asset Remarks, Impact Summary, and First Seen.
An alert with the Expired status was not handled within 30 days of being generated. Handle all security alerts promptly to avoid expiration.
Export alert data
Export security alerts filtered by risk level, status, time range, asset group, or alert name. Only the filtered results are exported.
Log on to the Security Center consoleSecurity Center consoleSecurity Center consoleSecurity Center consoleSecurity Center console.
In the left navigation bar, select Detection and Response > Alert. In the upper-left corner, select the region for the target asset: Chinese Mainland or Outside Chinese Mainland.
If you have enabled the Agentic SOC service, the navigation path changes to Agentic SOC > Manage > Alert.
On the Alert page, on the CWPP tab, apply the filters for the alerts you want to export.
In the upper-right corner of the alert list, click the
 icon.
icon.When the export is complete, click Download in the Exported dialog box (upper-right corner) to save the file.
View and recover quarantined files
When Security Center detects a threat file, it moves the file to the File Quarantine panel. Quarantined files are automatically purged after 30 days. If you determine a file is safe before that, you can recover it.
Log on to the Security Center consoleSecurity Center consoleSecurity Center consoleSecurity Center consoleSecurity Center console.
In the left navigation bar, select Detection and Response > Alert. In the upper-left corner, select the region for your assets: Chinese Mainland or Outside Chinese Mainland.
If you have enabled the Agentic SOC service, the navigation path changes to Agentic SOC > Manage > Alert.
In the upper-right corner of the Alert page, click Cloud Workload Alert Management > Quarantined Files.
On the Quarantined Files panel, take one of the following actions:
View quarantined files: The list shows the host, file path, status, and quarantine time for each file.
Recover a file: In the Actions column for the target file, click Recover. The file is removed from quarantine and may reappear in the list of unhandled alerts.
Network Defense Alert (formerly Attack Analysis)
Background
When you enable Brute-force Attack Protection for hosts and the Network Threat Prevention rules for Malicious Behavior Defense for hosts, Security Center automatically blocks detected attacks based on these rules and reports the data on the Network Defense Alert page.
For new cloud products, Security Center takes approximately 3 hours to synchronize network attack data before it appears.
Defensive alerts mean attacks have already been automatically blocked. No manual action is required.
Usage notes
For business-critical or high-risk assets, build a more granular, defense-in-depth posture:
Use WAF to defend against complex application-layer attacks.
Configure Cloud Firewall for fine-grained network access control and perimeter protection.
For persistent high-risk attack source IPs, create blocking policies in Cloud Firewall or a security group for more thorough isolation.
Attack data details
| Data category | Details | Core purpose |
|---|---|---|
| Number of attacks | Total basic network attacks on all assets within a specified time range. | Assess overall attack intensity. |
| Attack type distribution | Number and percentage of each attack type, shown in a pie or bar chart. Covers brute-force attacks, web attacks, vulnerability exploits, and DDoS attacks. | Identify the primary attack methods and threat vectors to focus security hardening. For example, if brute-force attacks dominate, prioritize strengthening account and password policies. |
| Top 5 attack sources | Top 5 source IPs by attack volume, with basic info such as region and ISP. | Identify major threat sources. For persistent high-frequency attackers, add these IPs to a blocklist or use them as starting points for threat investigation. |
| Top 5 attacked assets | Top 5 most-attacked cloud assets, identified by asset type (ECS, SLB, RDS, etc.) and asset ID. | Identify high-priority targets so you can concentrate protection resources — upgrade policies or patch vulnerabilities on these assets first. |
| Attack details list | Complete logs for all network defense events, including Attack-associated Vulnerabilities (CVE) and Attack Payload. | Supports in-depth security analysis, compliance auditing, and forensics, such as tracing the full path of a specific attack. |
Number of attacks
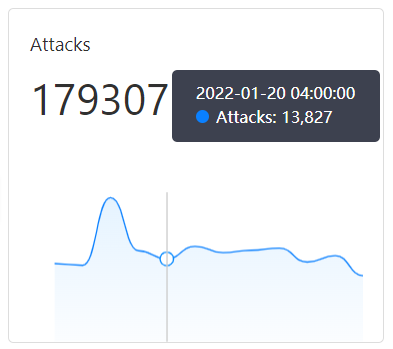
In the Attacks section, view a line chart of the total number of attacks on your assets within a specified time range, along with peak and trough values. Hover over the chart to see the date, time, and attack count.

Attack type distribution
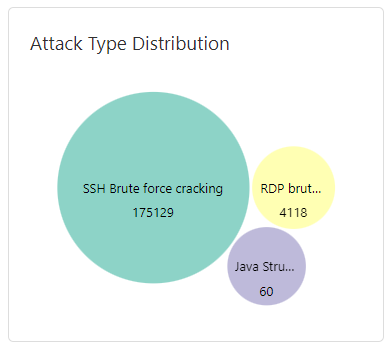
In the Distribution by Attack Type area, view each attack type and its total number of occurrences.

Top 5 attack sources
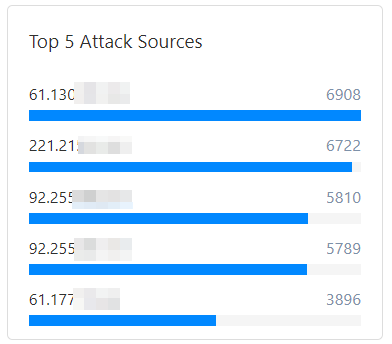
In the Top 5 Attack Sources area, view the top five source IPs and their corresponding attack counts.

Top 5 attacked assets
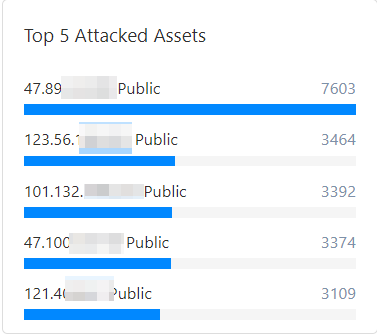
In the Top 5 Attacked Assets section, view the public IPs and attack counts for your five most-attacked assets.

Attack details list
The attack details list shows time, source IP, attacked asset, attack type, attack method, and attack status for each event.

The list displays a maximum of 10,000 attack entries. To view more data, adjust the Time Range to narrow the scope.
Attack details parameters
| Parameter | Description |
|---|---|
| Last Occurred At / First Occurred At | The time the attack occurred. |
| Attack Source | Source IP address and region. |
| Attacked Asset | Name, public IP, and private IP of the attacked asset. |
| Port | Attacked port number. Displayed only for SSH brute-force attacks. |
| Attack Type | Type of attack event — for example, SSH brute-force attack or code execution. |
| Attack Status | Current status of the attack event. Attacks blocked by Security Center show the status Defended. Abnormal intrusion events are displayed on the Alert page, CWPP tab. |
Supported operations
Attack source details
Click Details in the Actions column to view the full analysis of a specific Network Defense Alert:
Attack Source Intelligence: Analyzes the attack source attributes, including Basic Information (Discovery Time, Attack Source IP, Last Active Time, Country/Region, and Threat Tags). Click Details next to the source IP to open the Threat Intelligence console and view the complete IP profile and associated threat data.
Attack-associated Vulnerabilities (CVE): Lists vulnerabilities directly related to the alert behavior. Handle any listed vulnerabilities promptly to close the security loop. See View and handle vulnerabilities.
Attack Payload: The portion of attack traffic that carries the malicious instructions or data. For example, in an HTTP request, the payload may be JSON or XML data in a POST request used to trigger a vulnerability or perform a malicious action.
Attacked asset information
The attack event list also shows detailed information about the attacked asset.

Export the attack event list
Click the ![]() icon in the upper-left corner of the attack event list to export all detected attack events. The exported file is in Excel format.
icon in the upper-left corner of the attack event list to export all detected attack events. The exported file is in Excel format.
Disable interception rules
Some attack types display an ![]() icon in the Attack Type column. Hover over the icon to open the Disable Interception Rule dialog box. You can disable system interception rules for the following attack types:
icon in the Attack Type column. Hover over the icon to open the Disable Interception Rule dialog box. You can disable system interception rules for the following attack types:
SQL Server brute-force attack
SSH brute-force attack
RDP brute-force attack
AntSword WebShell communication
China Chopper WebShell communication
XISE WebShell communication
WebShell upload
PHP WebShell upload
JSP WebShell upload
ASP WebShell upload
WebShell upload with special suffix
Intelligent defense for WebShell upload
Adaptive web attack defense
Java generic RCE vulnerability blocking
To stop Security Center from automatically blocking a specific attack type, click Go to the Malicious behavior Defense page. to navigate to the Malicious Behavior Defense page and disable the corresponding system defense rule.