Visual MapReduce model
When a distributed job splits into subtasks, diagnosing failures or tracking progress at the individual subtask level is difficult with the standard MapReduce model. The visual MapReduce model solves this by adding per-subtask observability -- a task list, execution logs, tracing, and the ability to stop or re-run individual subtasks -- without requiring any code changes. Switch the execution mode in the SchedulerX console to enable these capabilities.
When to use visual MapReduce
Visual MapReduce is designed for jobs that split into a manageable number of subtasks where individual monitoring matters. Standard MapReduce handles volume; visual MapReduce adds visibility.
| Criteria | MapReduce | Visual MapReduce |
|---|---|---|
| Maximum subtasks | > 1,000,000 | <= 1,000 |
| Task list in console | No | Yes |
| Per-subtask logs, tracing, and thread dumps | No | Yes |
| Custom business labels on subtasks | No | Yes (via BizSubTask interface) |
| Stop or re-run a single subtask | No | Yes |
| Job development code | Same | Same |
Choose visual MapReduce when:
The job produces fewer than 1,000 subtasks.
You need to debug or audit individual subtask results (for example, processing customer accounts, regional data, or compliance checks).
Choose standard MapReduce when:
The job produces more than 1,000 subtasks.
Per-subtask monitoring is not required.
Prerequisites
Before you begin, make sure that you have:
A SchedulerX Professional Edition instance
SDK version later than V1.12.2 (earlier versions contain security vulnerabilities)
Develop a visual MapReduce job
The visual MapReduce model inherits all interfaces from the standard MapReduce model. No code changes are needed to switch between the two models. The only difference is the execution mode set in the console.
Step 1: Define subtask objects
Each subtask object represents one unit of parallel work. To display custom business labels in the console task list, implement the com.alibaba.schedulerx.worker.processor.BizSubTask interface and its labelMap() method.
| Interface | Method | Required |
|---|---|---|
BizSubTask | public Map<String, String> labelMap() | No. Outputs the label information of subtasks, such as account name, product code, city, and other custom features. Only required if you want custom labels in the task list. |
The following example defines a bank account object with a custom label that displays the account name in the console:
public class ParallelAccountInfo implements BizSubTask {

    /**
     * Primary key
     */
    private long id;

    private String name;

    private String accountId;

    public ParallelAccountInfo(long id, String name, String accountId) {
        this.id = id;
        this.name = name;
        this.accountId = accountId;
    }

    /**
     * Return label key-value pairs that appear in the console task list.
     */
    @Override
    public Map<String, String> labelMap() {
        Map<String, String> labelMap = new HashMap();
        labelMap.put("Account name", name);
        return labelMap;
    }
}
After you implement this interface, each subtask shows its label in the Subtask list tab. Filter or search subtasks by label to quickly locate a specific account.
Step 2: Implement the processor
Extend com.alibaba.schedulerx.worker.processor.MapReduceJobProcessor and implement the process method. In the root task, build the list of subtask objects and call map() to distribute them. In each subtask, retrieve the object and run the business logic.
public class ParallelJob extends MapReduceJobProcessor {

    private static final Logger logger = LoggerFactory.getLogger("schedulerx");

    @Override
    public ProcessResult reduce(JobContext context) throws Exception {
        return new ProcessResult(true);
    }

    @Override
    public ProcessResult process(JobContext context) throws Exception {
        if (isRootTask(context)) {
            logger.info("Build parallel computing tasks.");
            List<ParallelAccountInfo> list = new LinkedList();
            /**
             * Root task: build parallel subtask objects.
             * In practice, load objects based on your requirements. Examples:
             *  1. Load unprocessed customer accounts from a database.
             *  2. Build a region table to distribute work by province, city, or district.
             *  3. Classify tasks by business category (appliance, daily necessity, food).
             *  4. Partition by time period (January, February, and so on).
             */
            for (int i = 0; i < 20; i++) {
                list.add(new ParallelAccountInfo(i, "CUS" + StringUtils.leftPad(i + "", 4, "0"),
                        "AC" + StringUtils.leftPad(i + "", 12, "0")));
            }
            return map(list, "transfer");
        } else {
            // Subtask: retrieve the object and run business logic.
            ParallelAccountInfo obj = (ParallelAccountInfo) context.getTask();
            logger.info("Process task information: {}", JSON.toJSONString(obj));
            return new ProcessResult(true);
        }
    }
}
After you develop and deploy the job, create a scheduled task in the SchedulerX console to run it. See Configure a visual MapReduce job in the console for details.
Configure a visual MapReduce job in the console
Log on to the SchedulerX console. In the left-side navigation pane, click Task Management.
On the Task Management page, click Create task.
In the Create task panel, select Visual MapReduce from the Execution mode drop-down list.
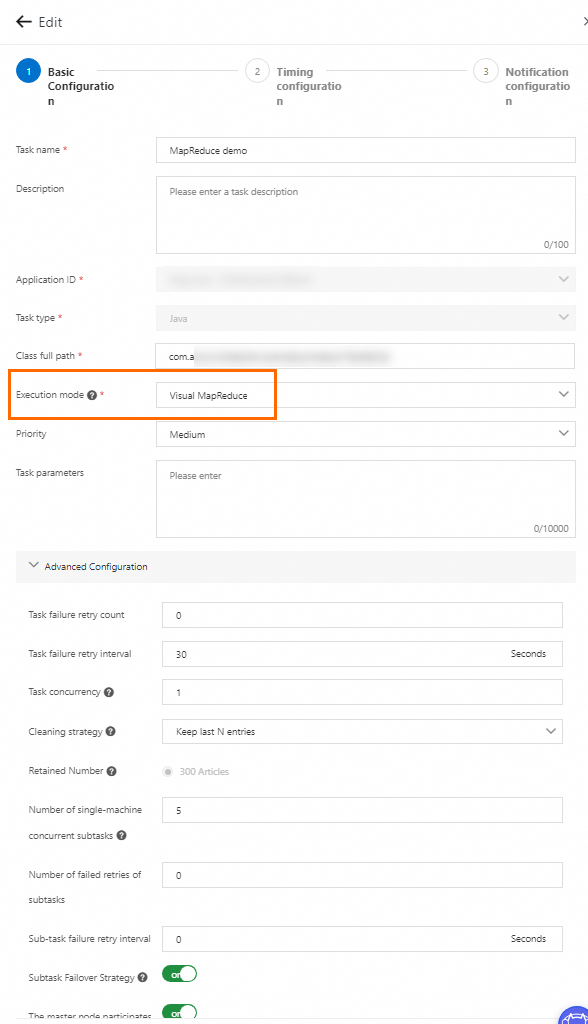
In the Advanced Configuration section, configure the parameters described in the following tables. For details about other parameters, see Advanced parameters for job management.
Distribution and concurrency
| Parameter | Description | Default |
|---|---|---|
| distribution policy | Polling Scheme: distributes an equal number of subtasks to each worker. Best for subtasks that take roughly the same time. Worker load optimal strategy: the master node detects worker loads and distributes accordingly. Best for subtasks with varying execution times. | Polling Scheme |
| Number of single-machine concurrent subtasks | Execution threads per worker. Increase to speed up execution; decrease if downstream systems or databases cannot handle the load. | 5 |
The distribution policy parameter is available only for client version V1.10.14 or later.
Retry and failover
| Parameter | Description | Default |
|---|---|---|
| Number of failed retries of subtasks | Retry count when a subtask fails. | 0 |
| Sub-task failure retry interval | Interval between retries, in seconds. | 0 |
| Subtask Failover Strategy | When enabled, a failed subtask is rescheduled to a different worker. Because this may cause a subtask to run more than once, make sure that subtask logic is idempotent. | - |
The Subtask Failover Strategy parameter is available only for client version V1.8.13 or later.
Master node participation
| Parameter | Description | Default |
|---|---|---|
| The master node participates in the execution | When enabled, the master node also runs subtasks. Requires at least two workers. For jobs with a large number of subtasks, disable this to reduce load on the master node. | - |
The The master node participates in the execution parameter is available only for agent version V1.8.13 or later.
Monitor and debug subtasks
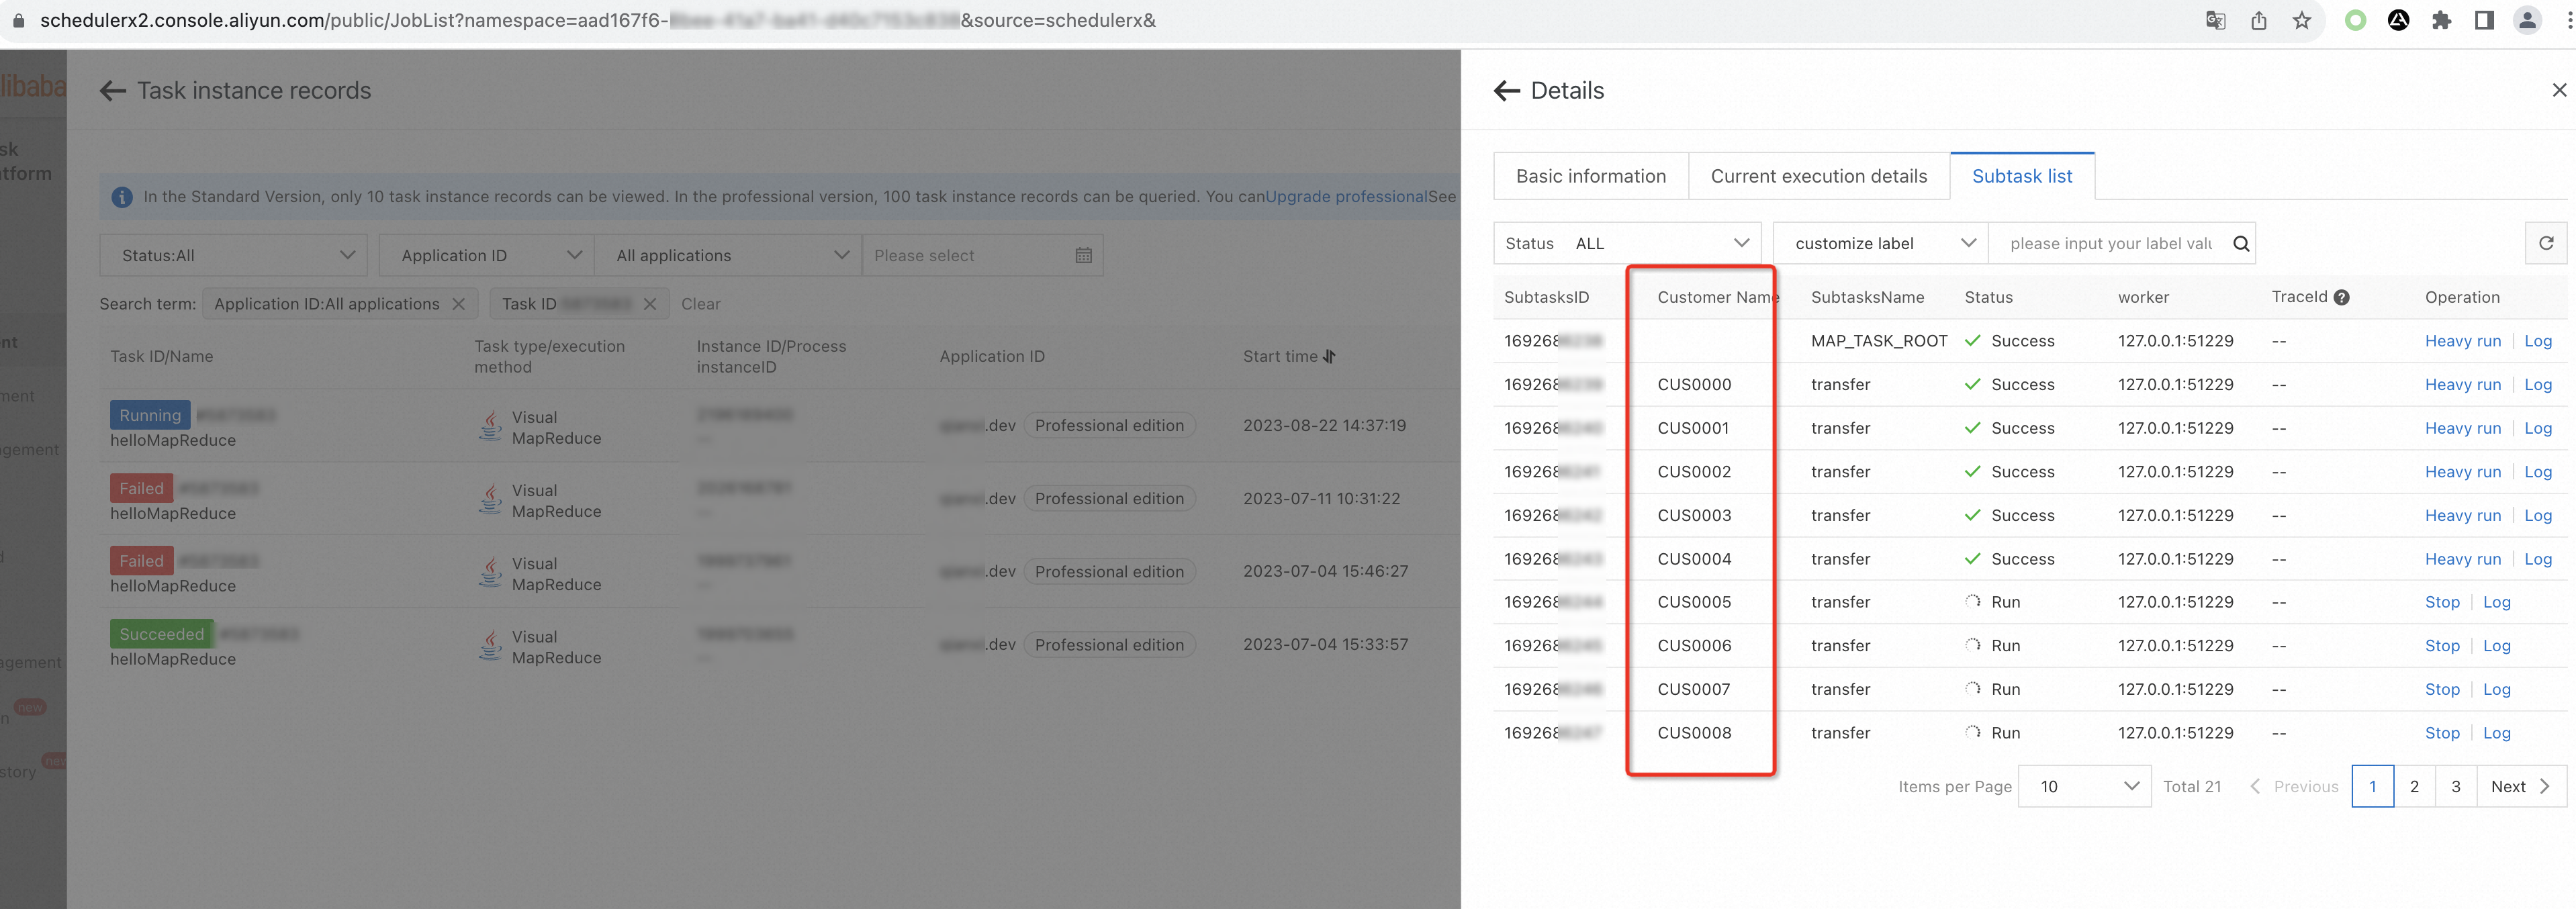
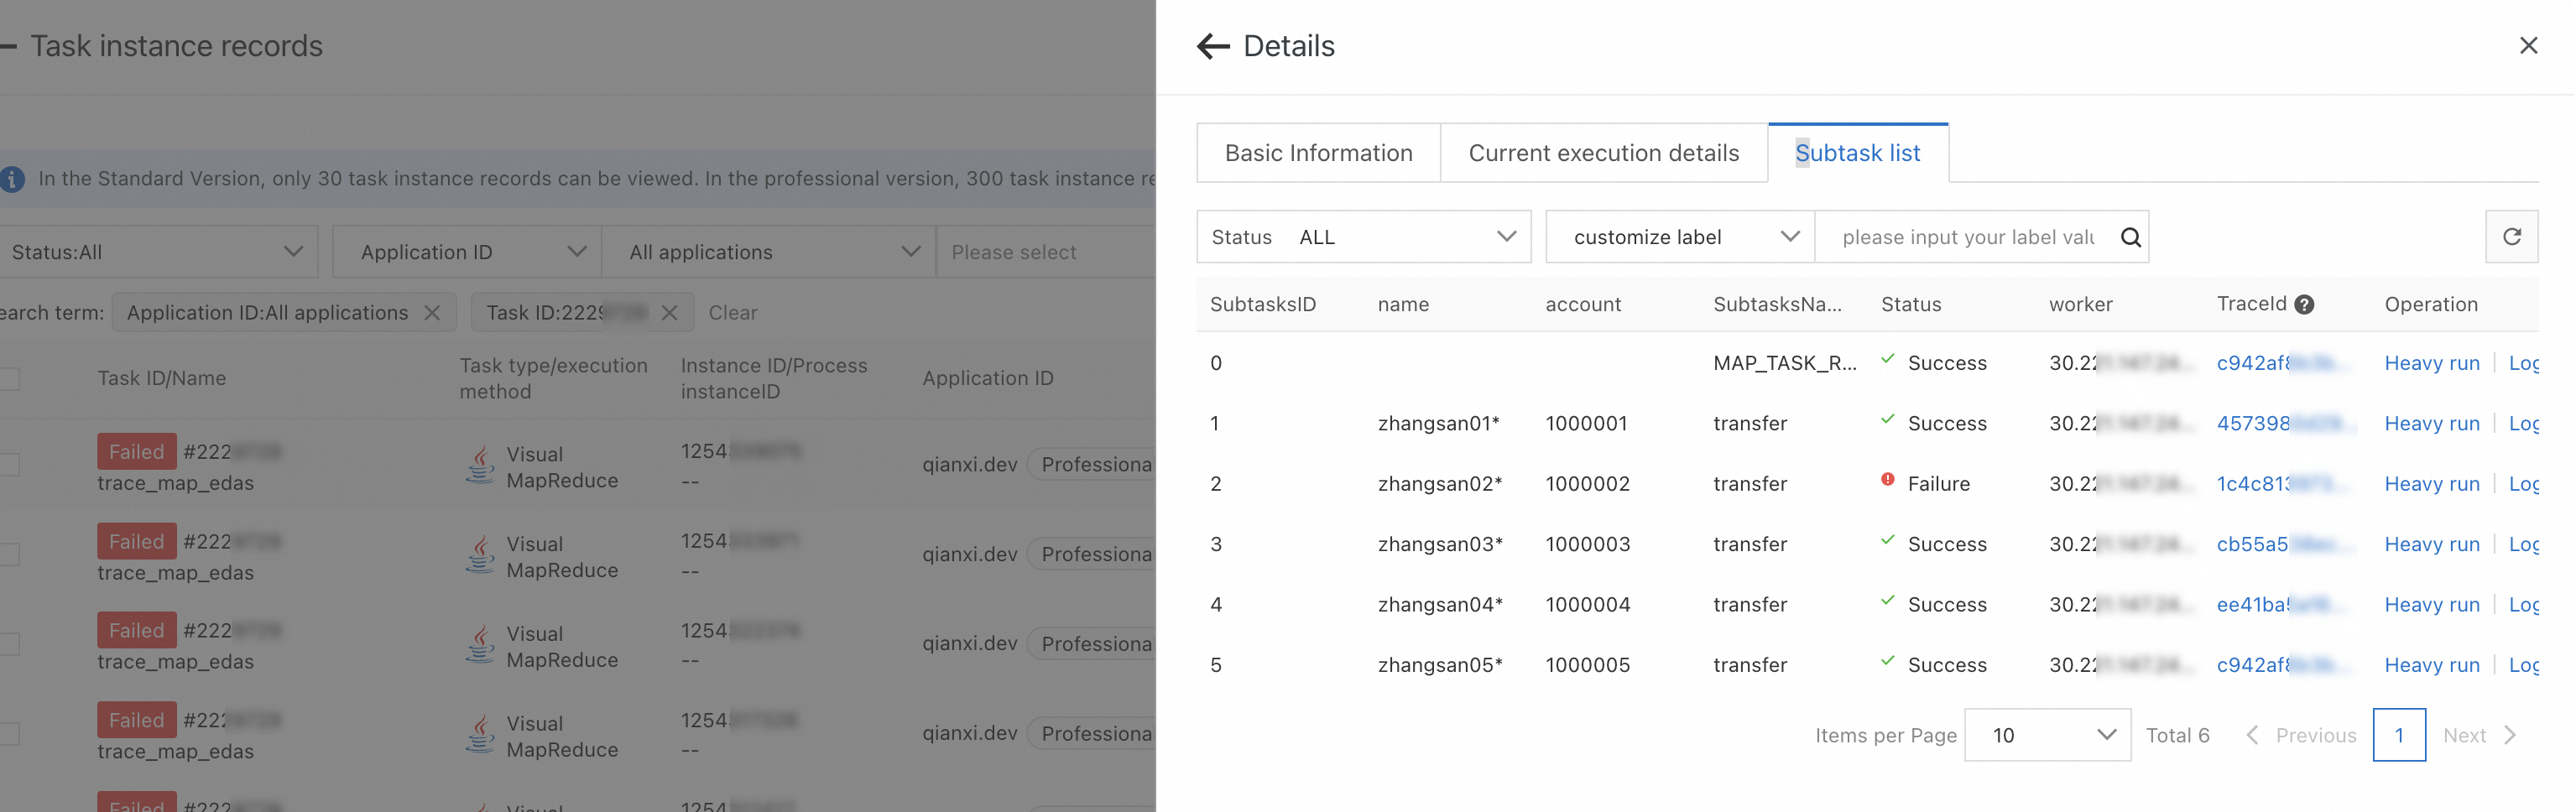
After a job runs, go to the Execution List page and click Details to inspect individual subtasks.
View subtask status
On the Subtask list tab, view the execution status of each subtask, including custom labels.

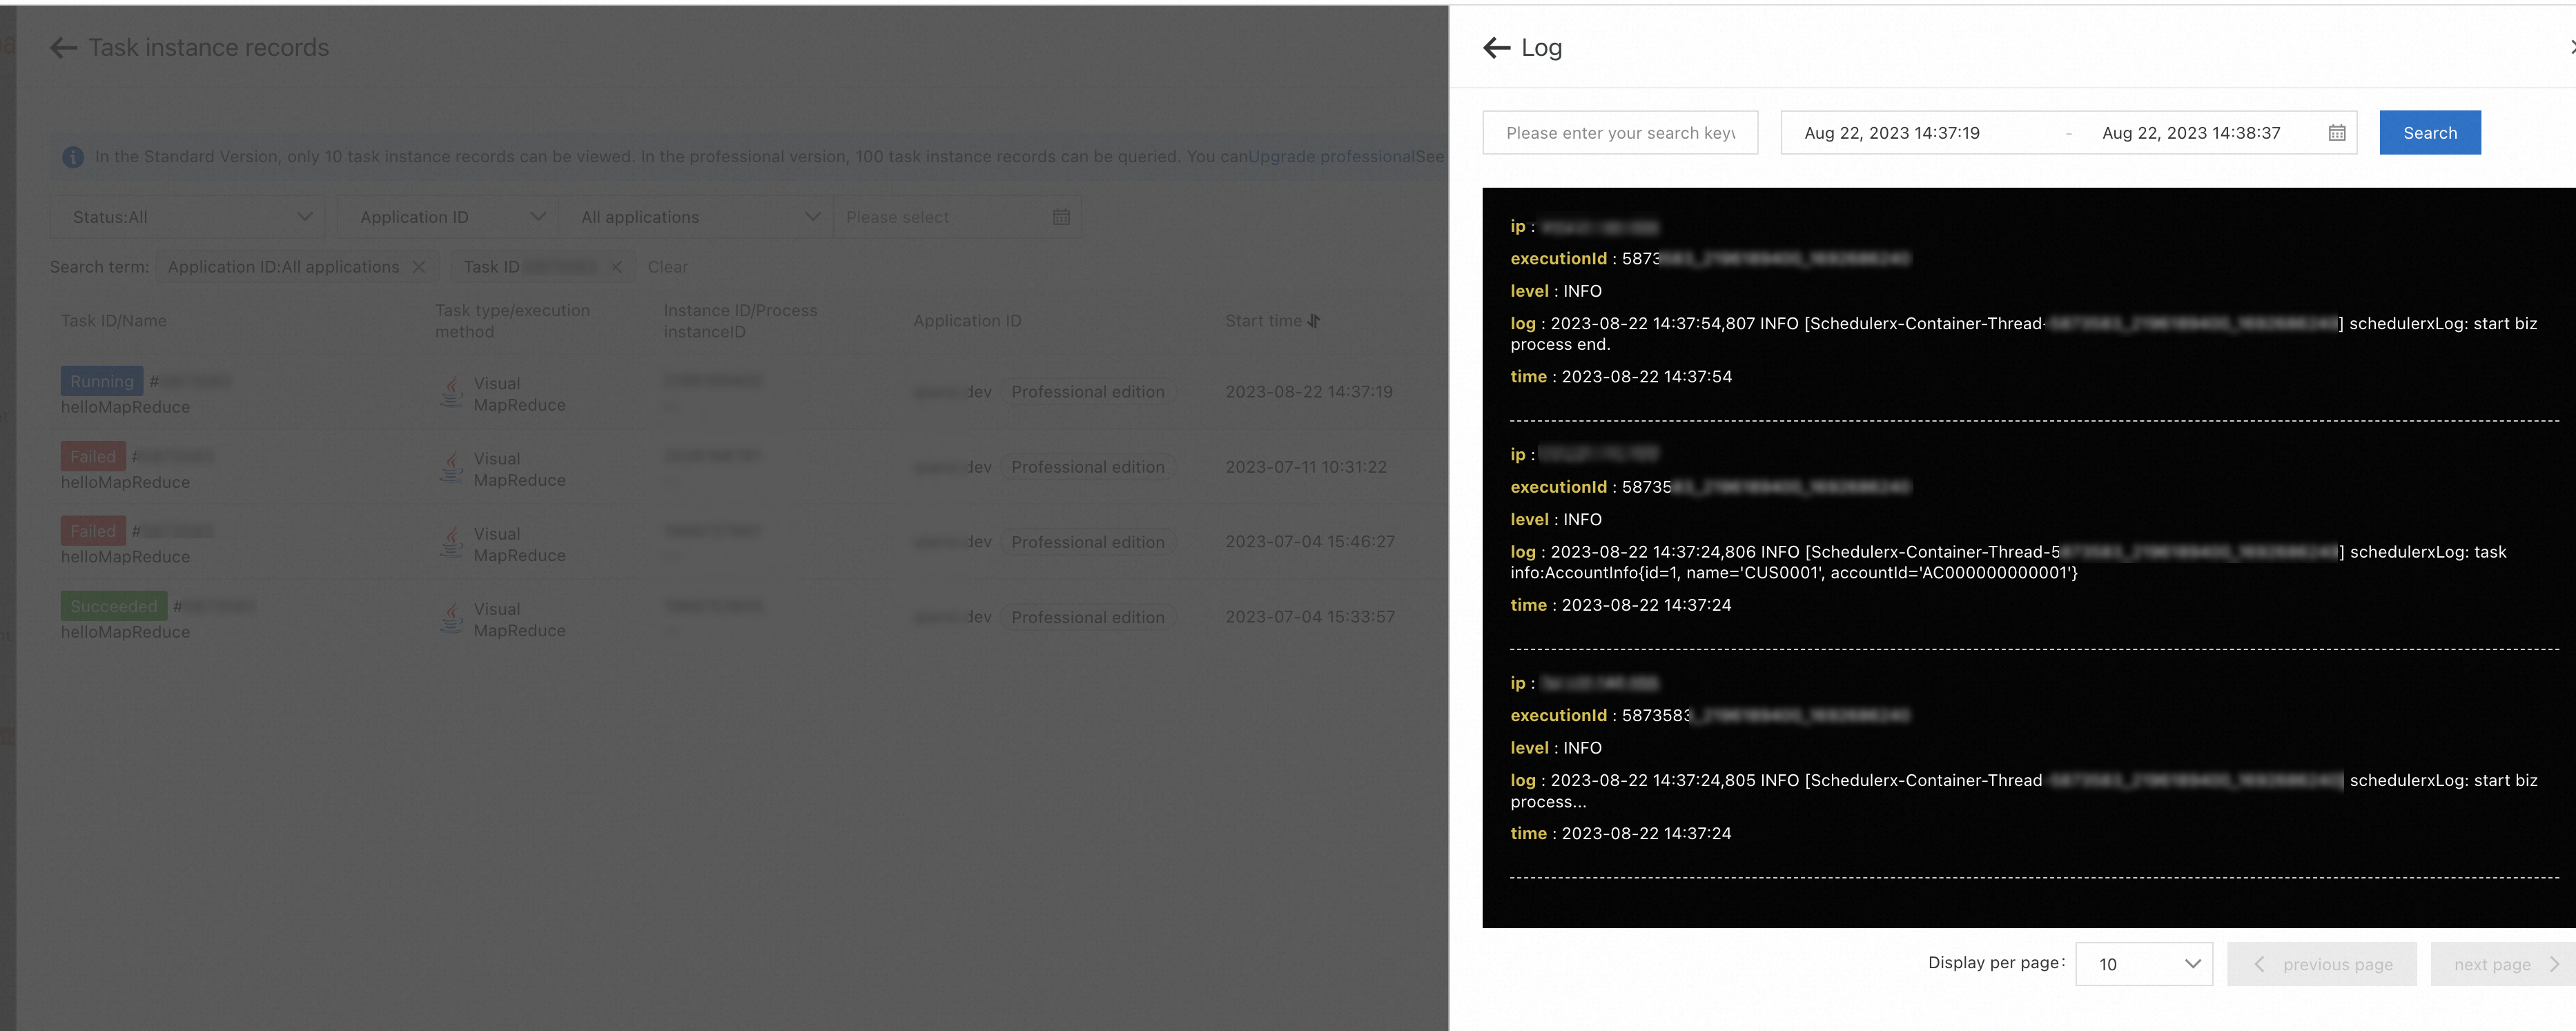
View subtask logs
On the Subtask list tab, find the target subtask and click Log in the Operation column to view its business log output.
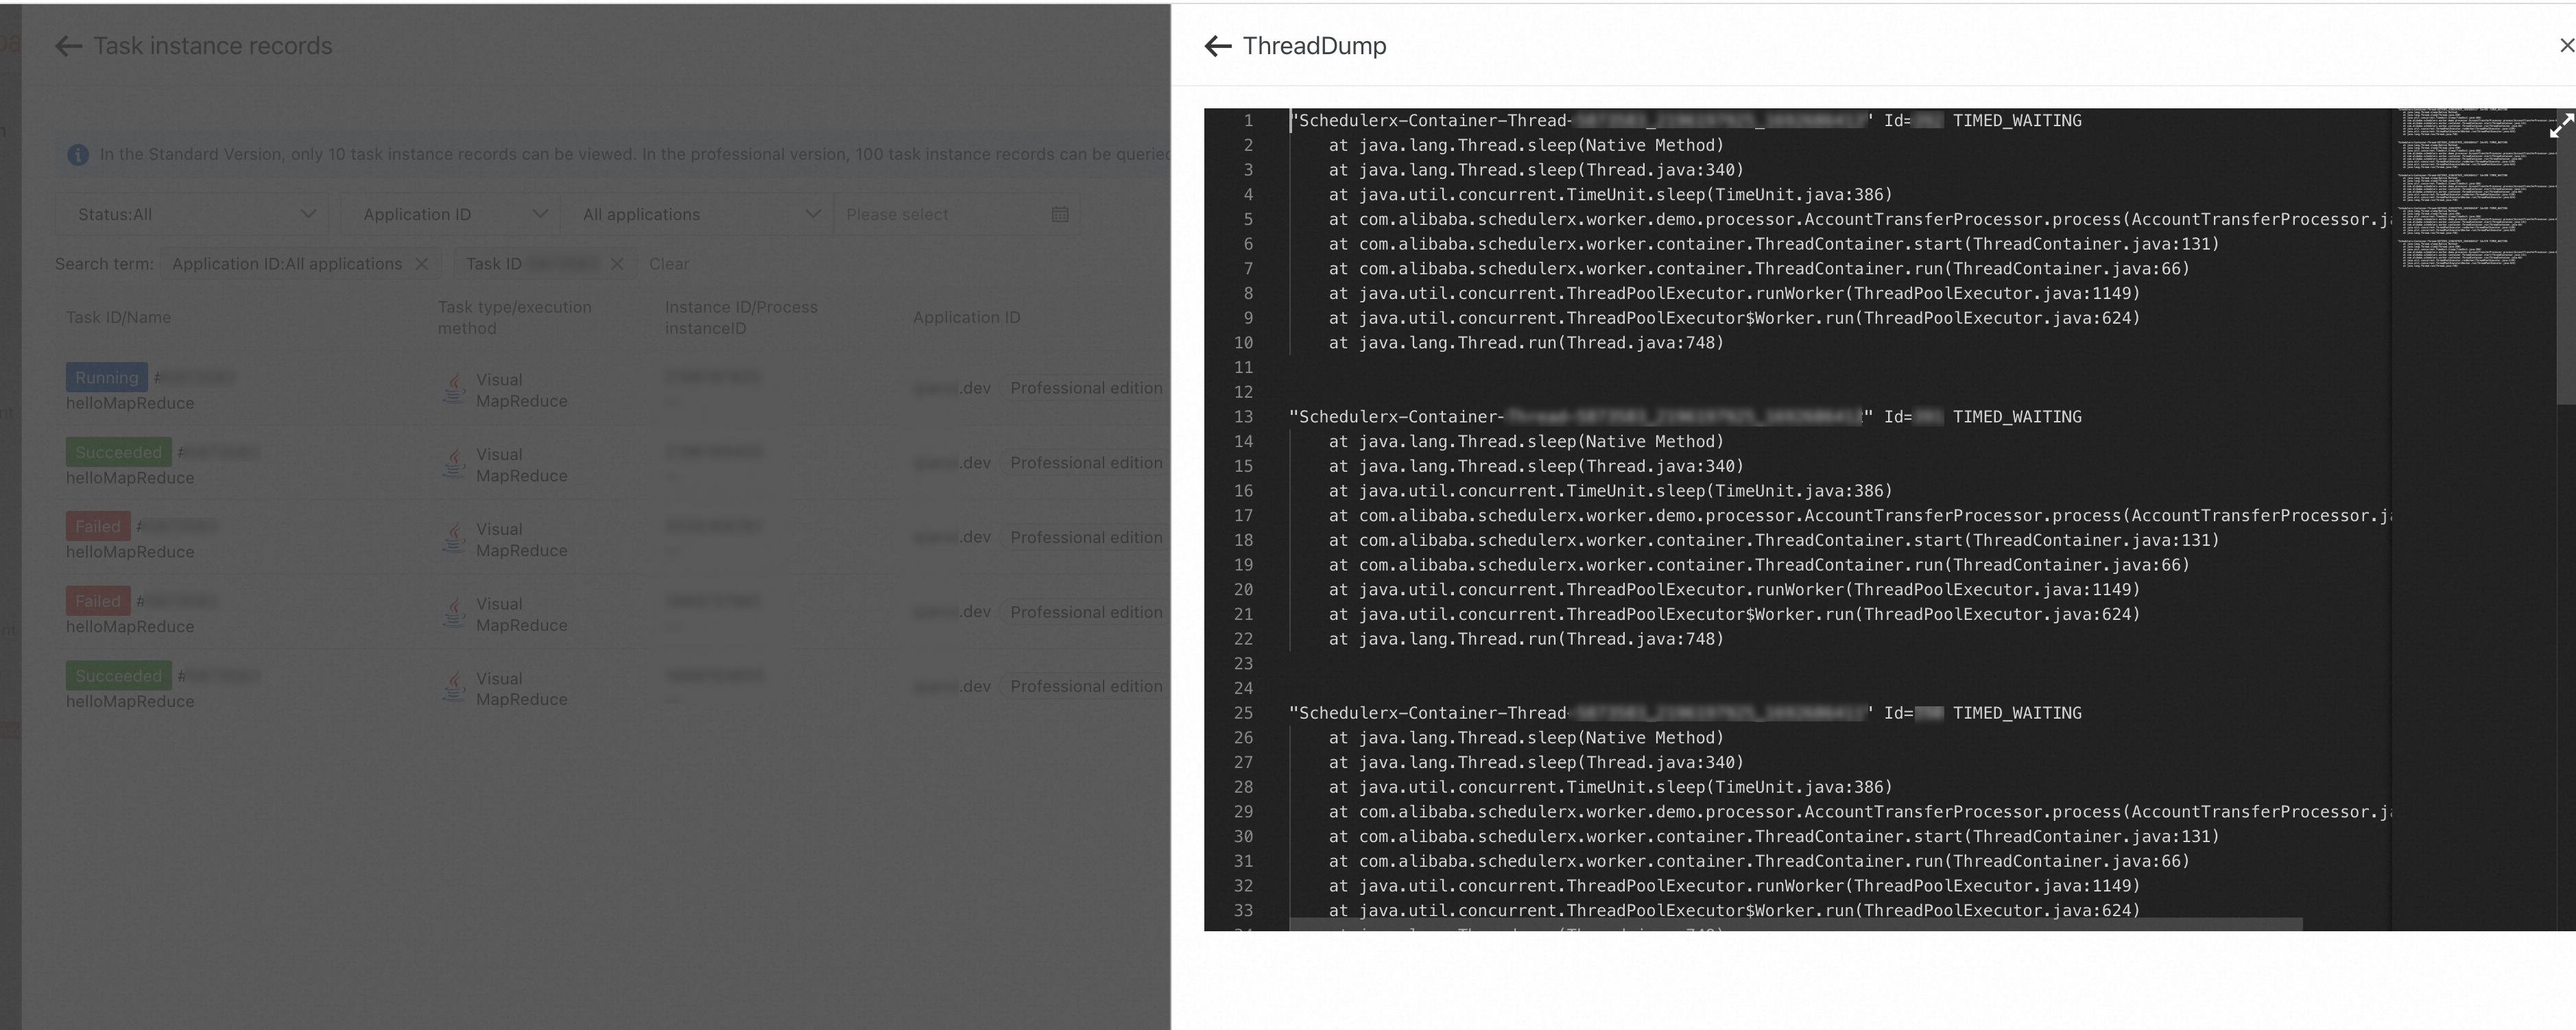
Analyze thread dumps
On the Current execution details tab, click ThreadDump to inspect thread execution on the relevant machine. Use this to diagnose stuck or slow subtasks.
Trace subtask execution
If Tracing Analysis is enabled, click the TraceId value on the Subtask list tab to view the distributed trace for that subtask. For setup instructions, see Integrate tracing analysis.
Limits
Hard limits
| Constraint | Limit |
|---|---|
| Subtask count per job | 1,000 |
| Subtask size | 64 KB |
ProcessResult result field | 1,000 bytes |
Developer responsibilities
Idempotence. If a failover is triggered, SchedulerX may run a subtask more than once. Make sure that each subtask is idempotent.
Memory on the master node. If the job uses the
reducemethod, the results of all subtasks are cached on the master node. Keep the subtask count and result size small to avoid memory pressure. Ifreduceis not needed, extendMapJobProcessorinstead ofMapReduceJobProcessor.